Screenshots
The desktop application with the demo project on the simulated bus. The images follow the light or dark theme of this site.
Demo
Creating a project, starting a measurement, the Trace with a filter, a frame with signals and a signal in Graphics. 36 s.
Gallery
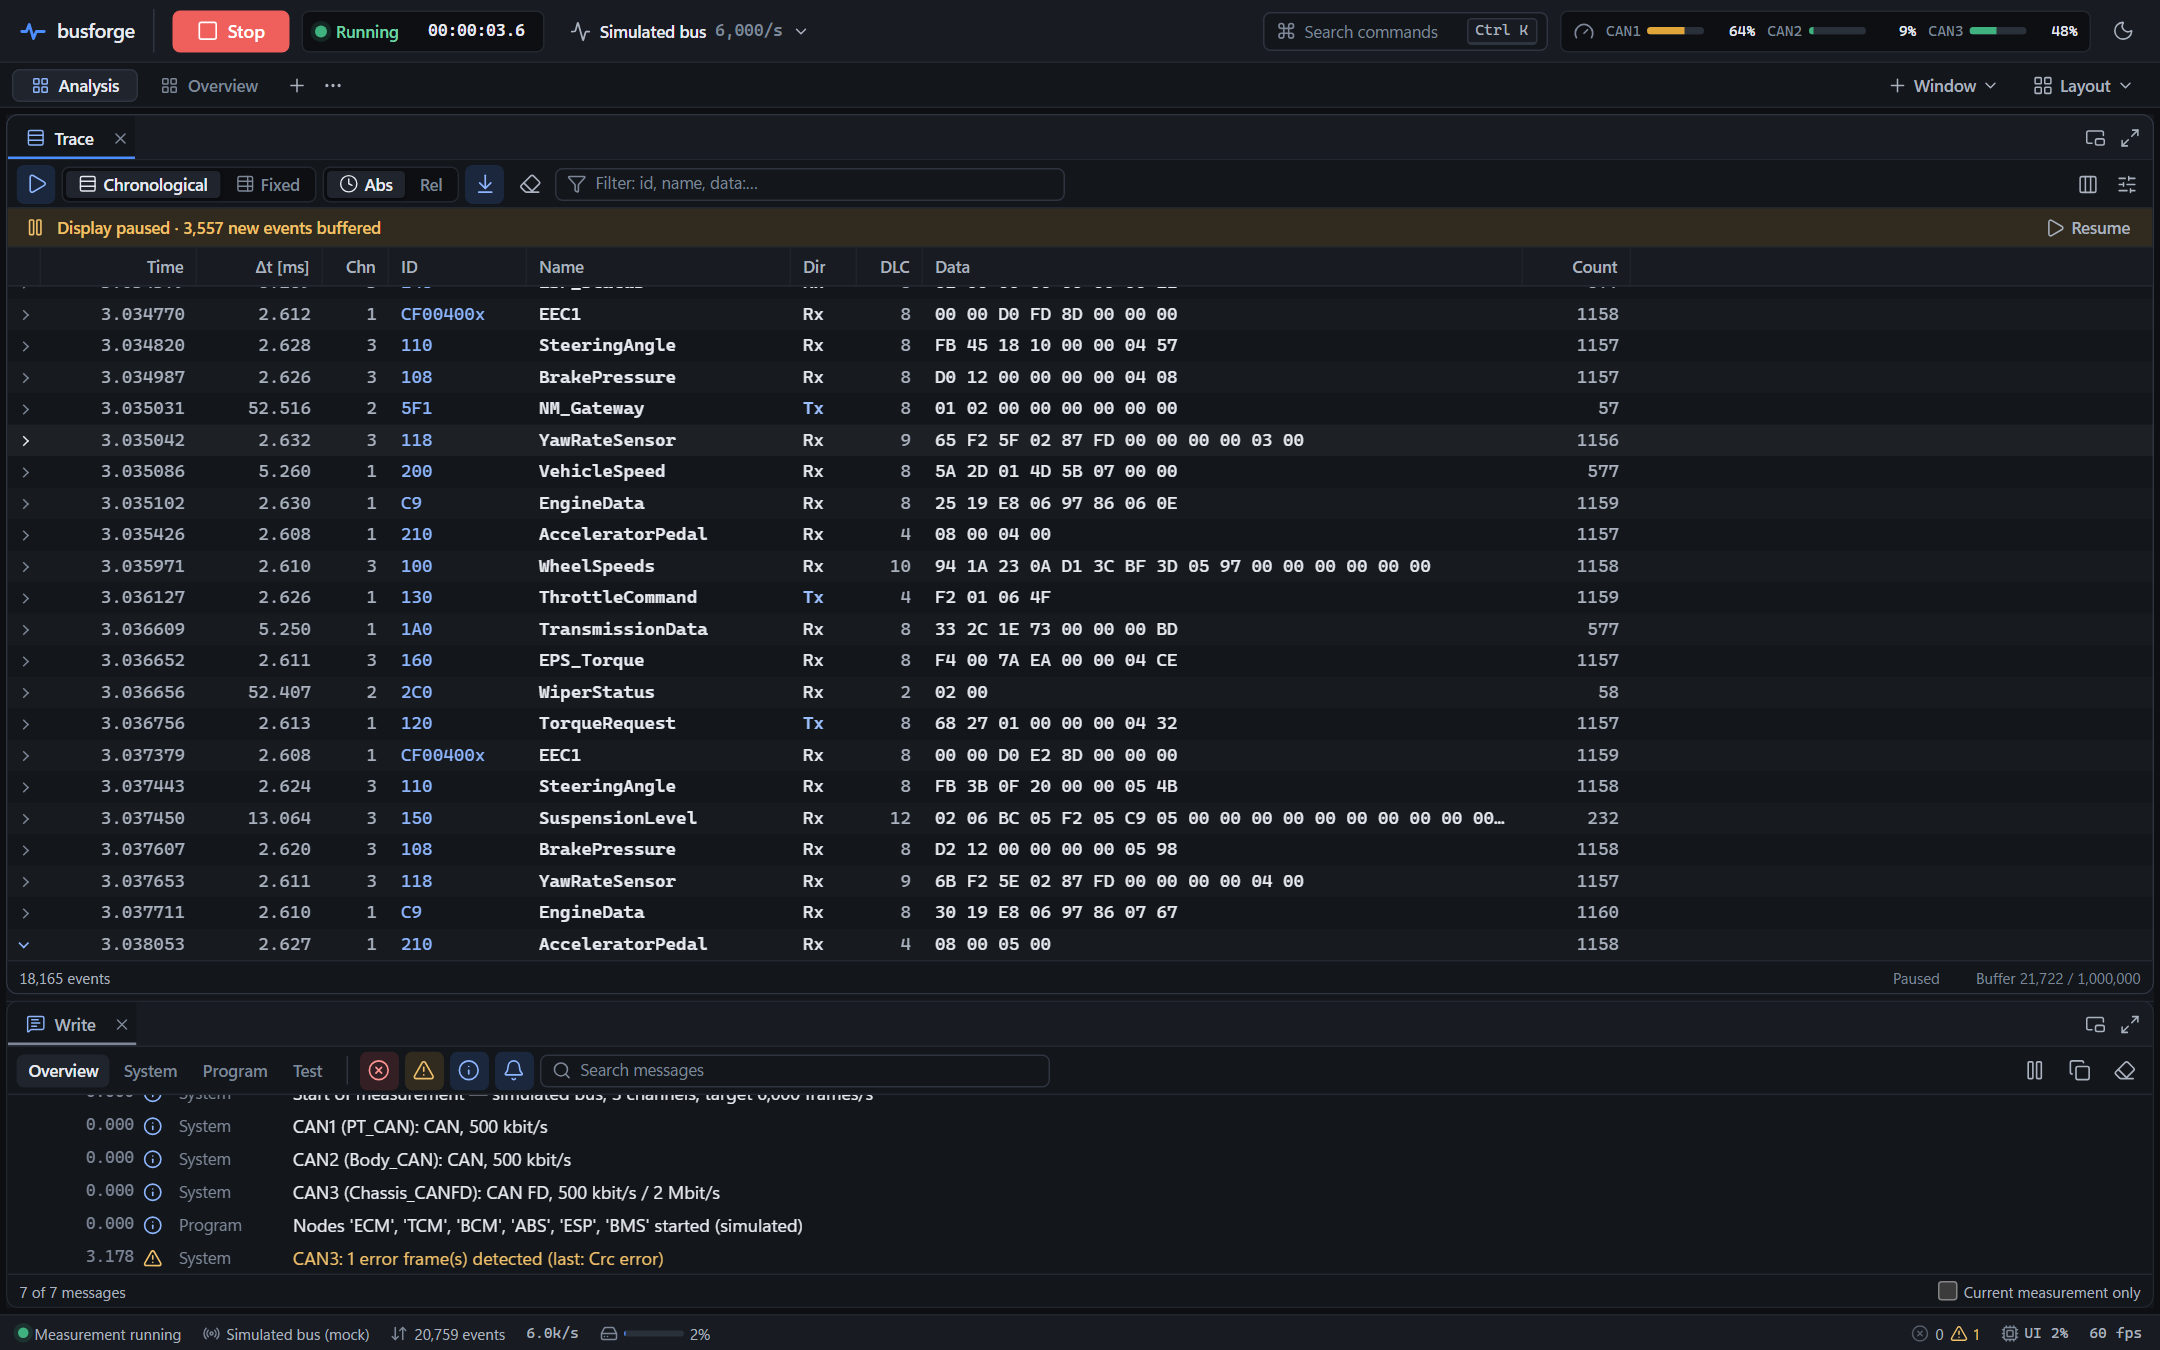
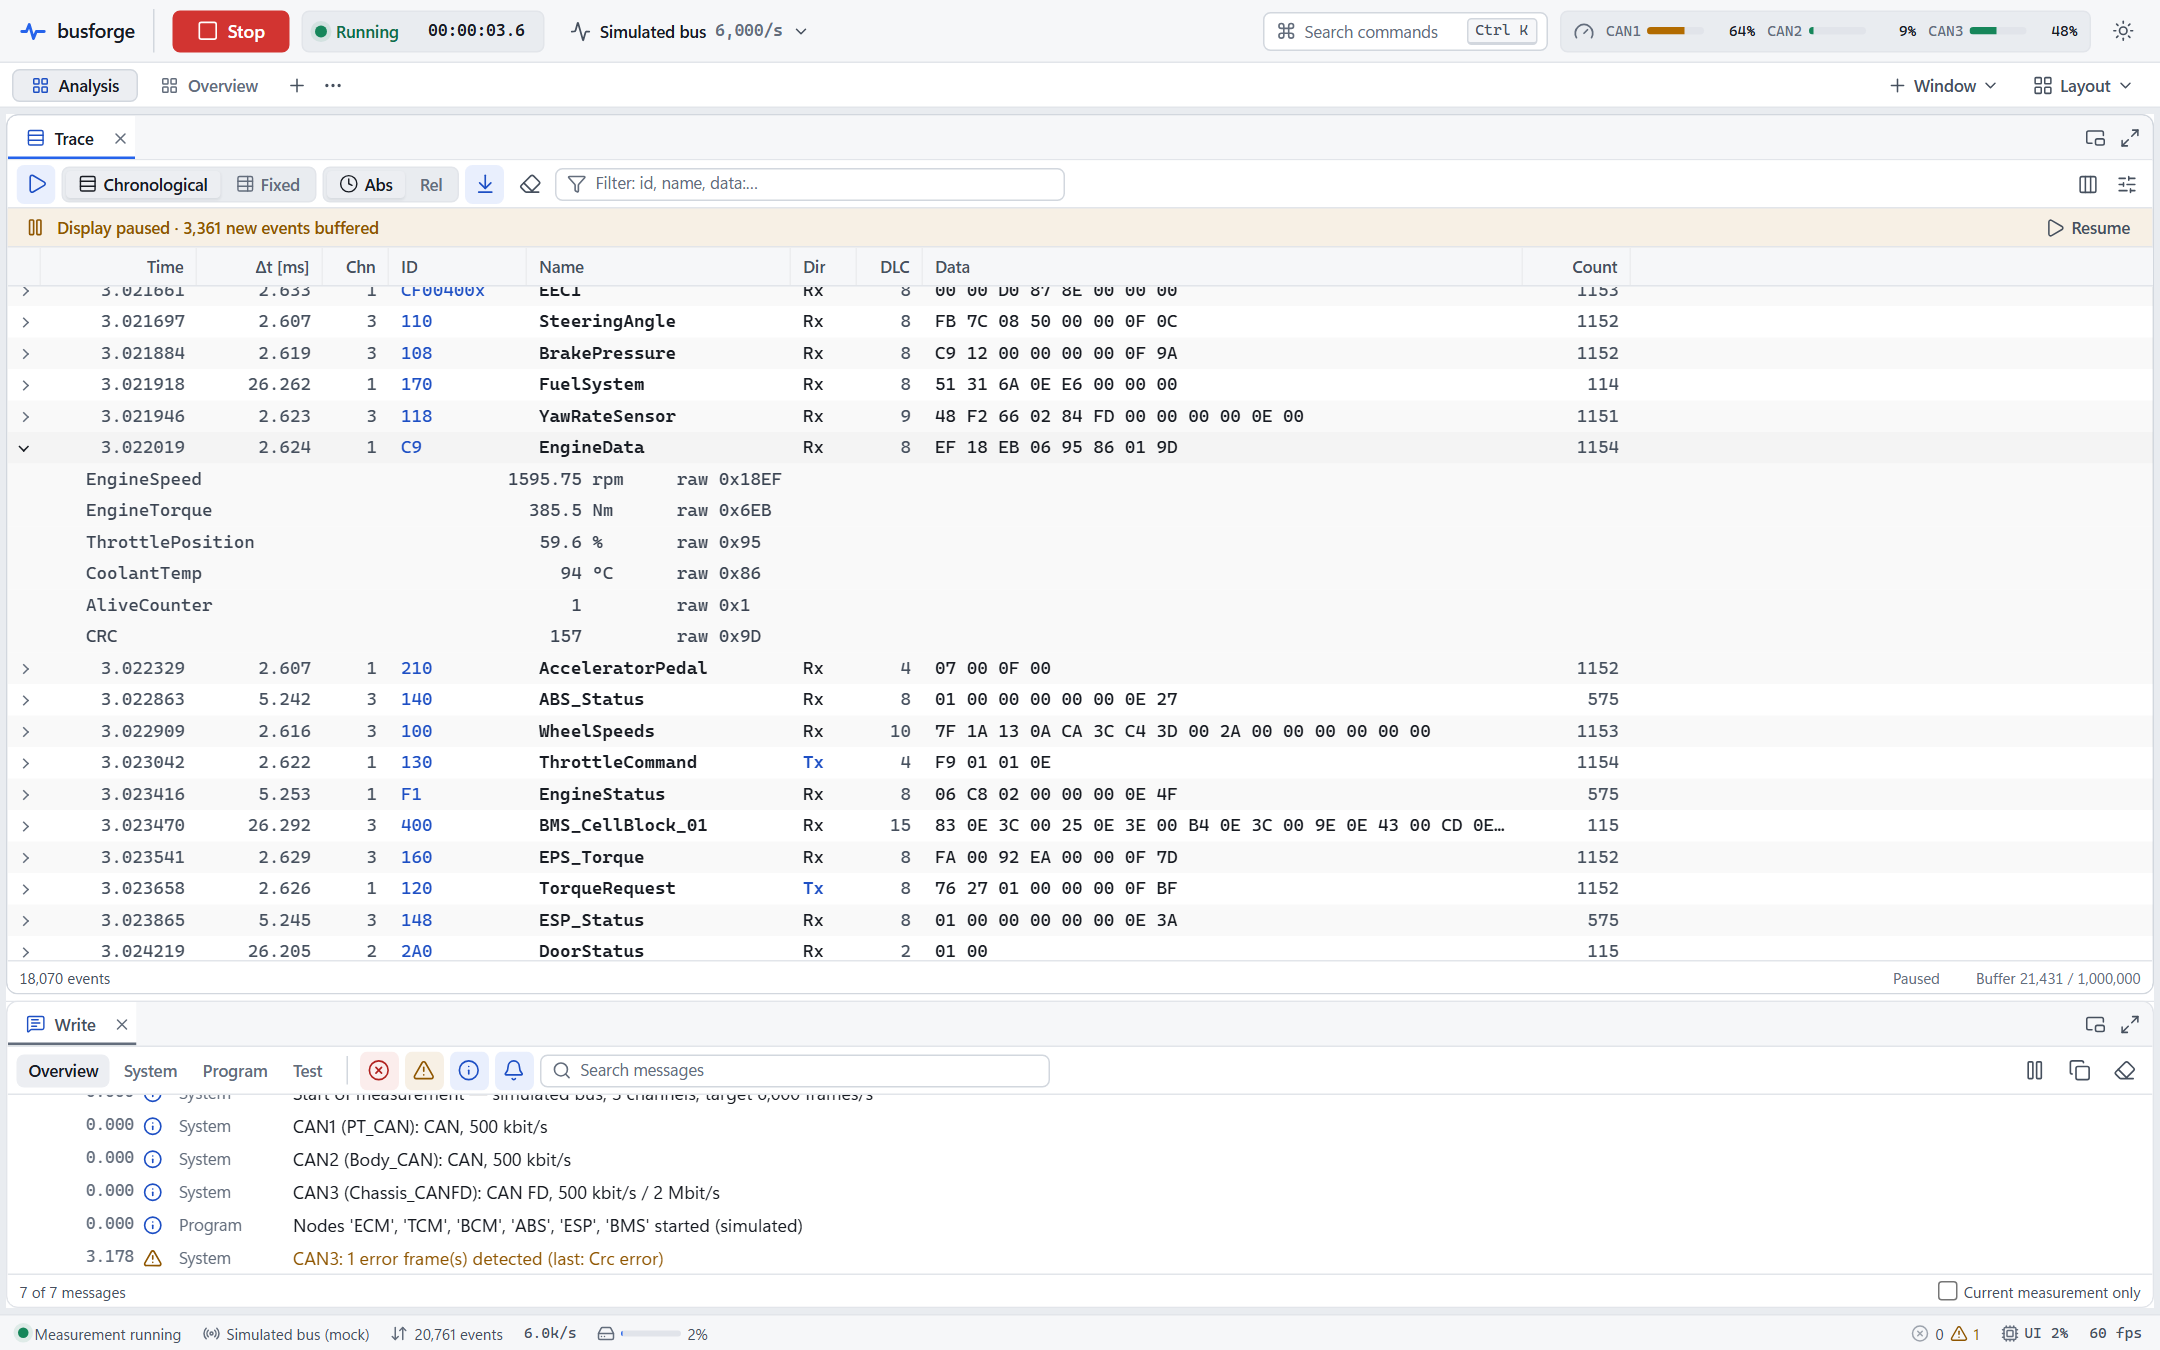
Live Trace at 6,000 frames/s on three channels (CAN, CAN, CAN FD), with the Write window below.
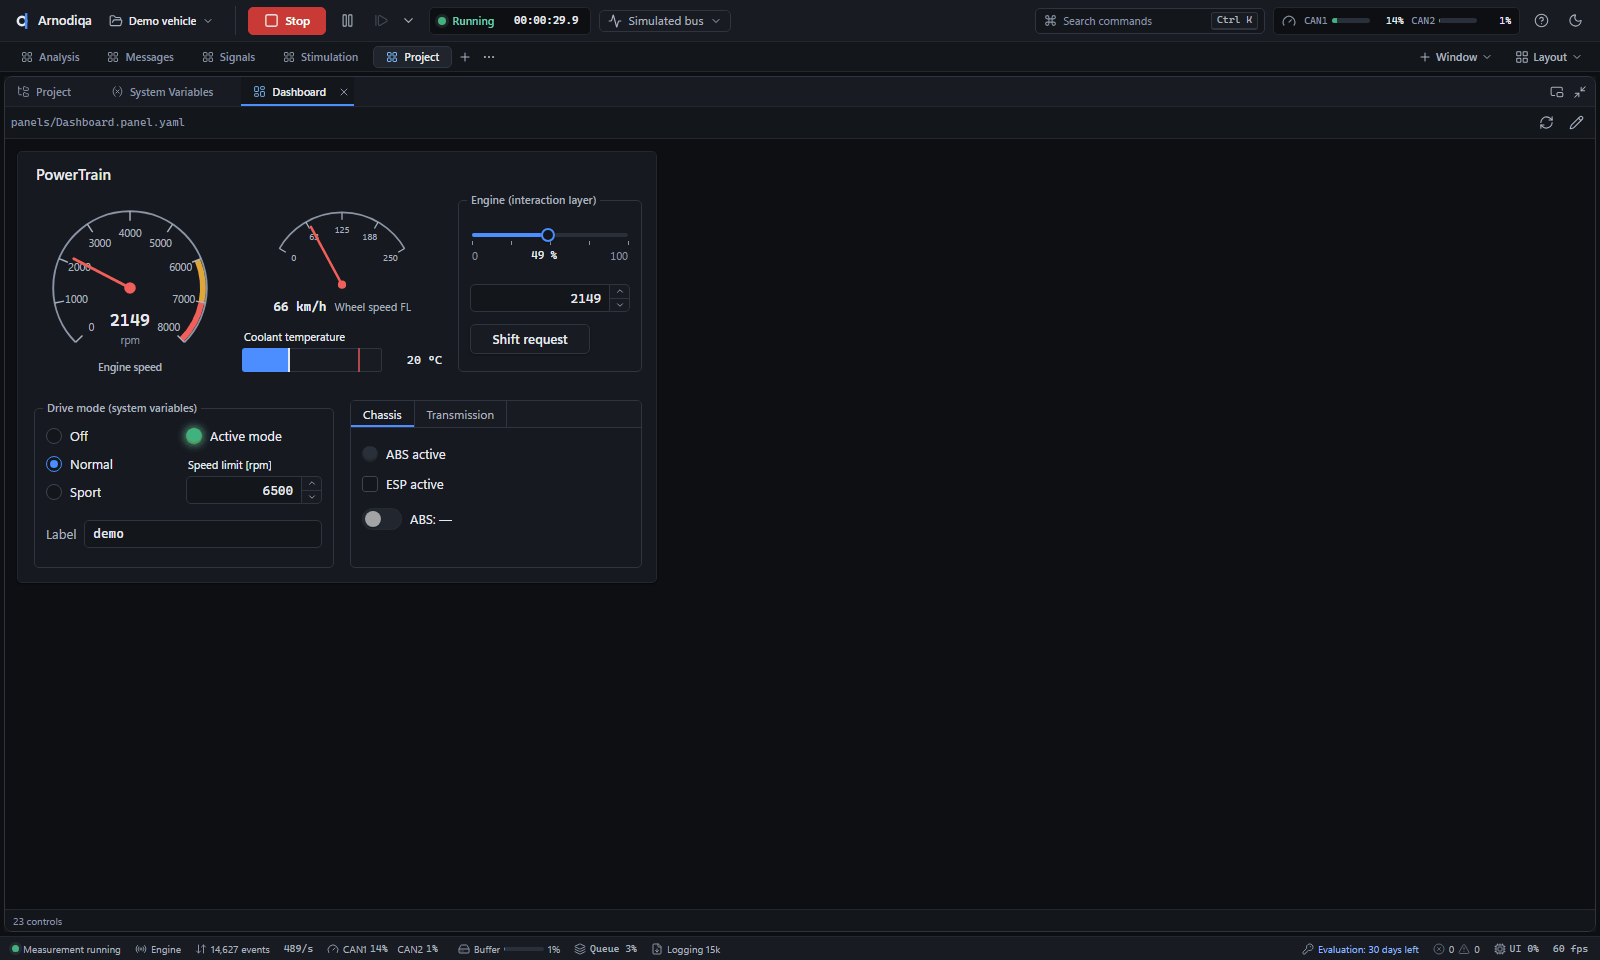
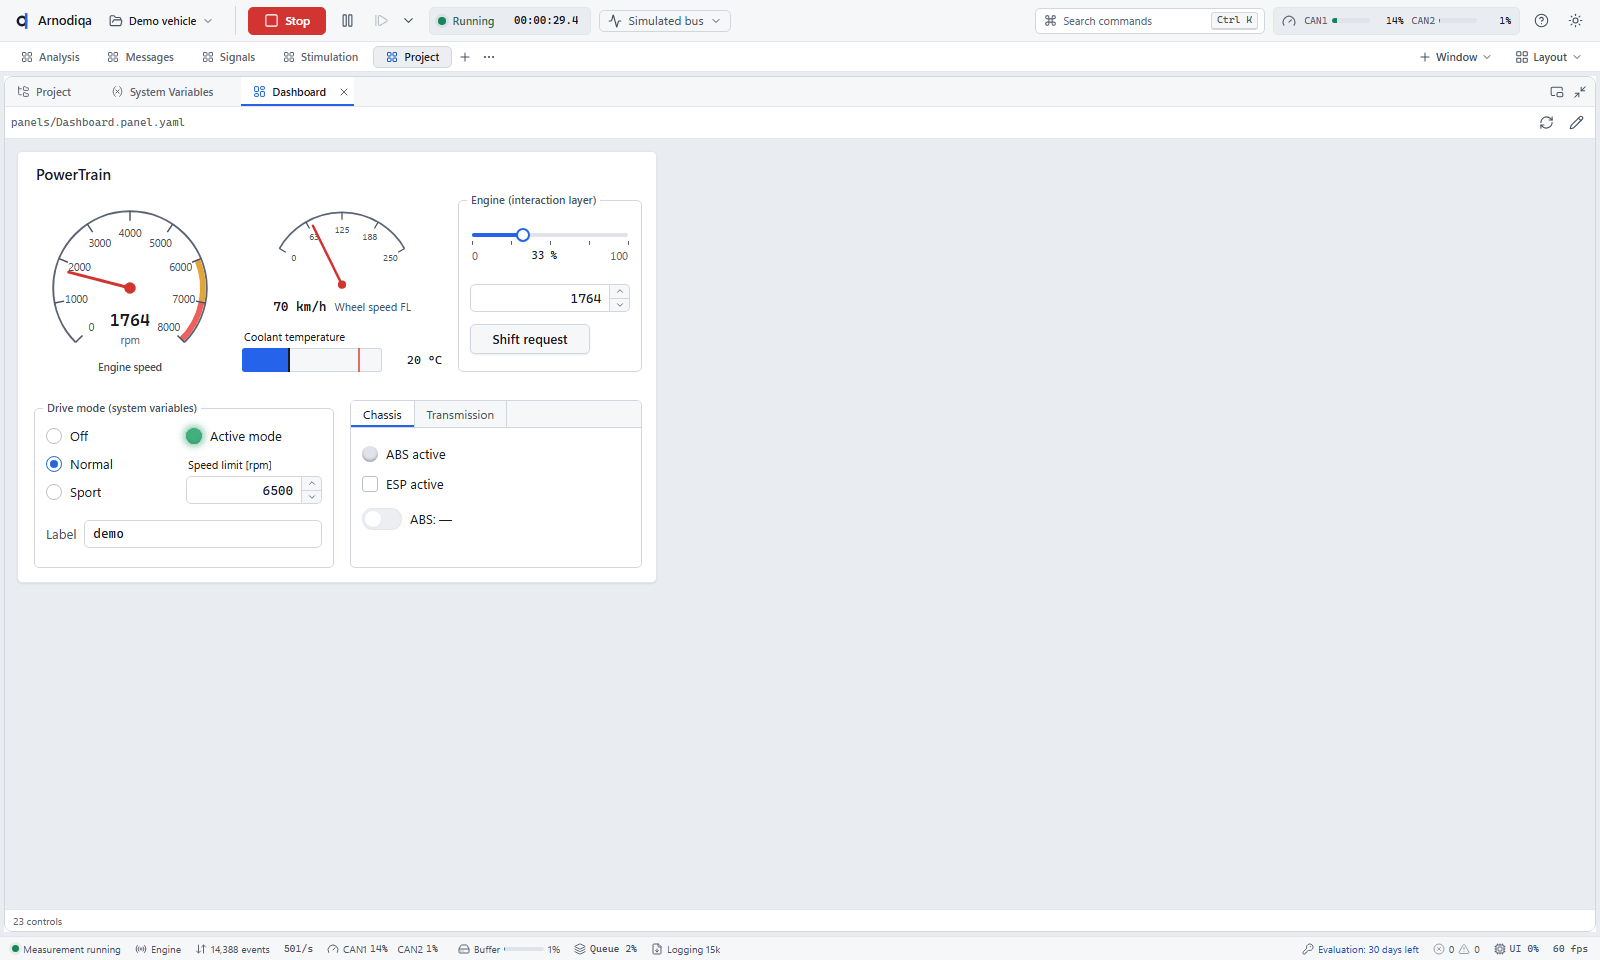
Control panel during a measurement: gauges for engine and vehicle speed, a temperature bar, a slider and an input box on Interaction Layer signals, radio buttons on a system variable.
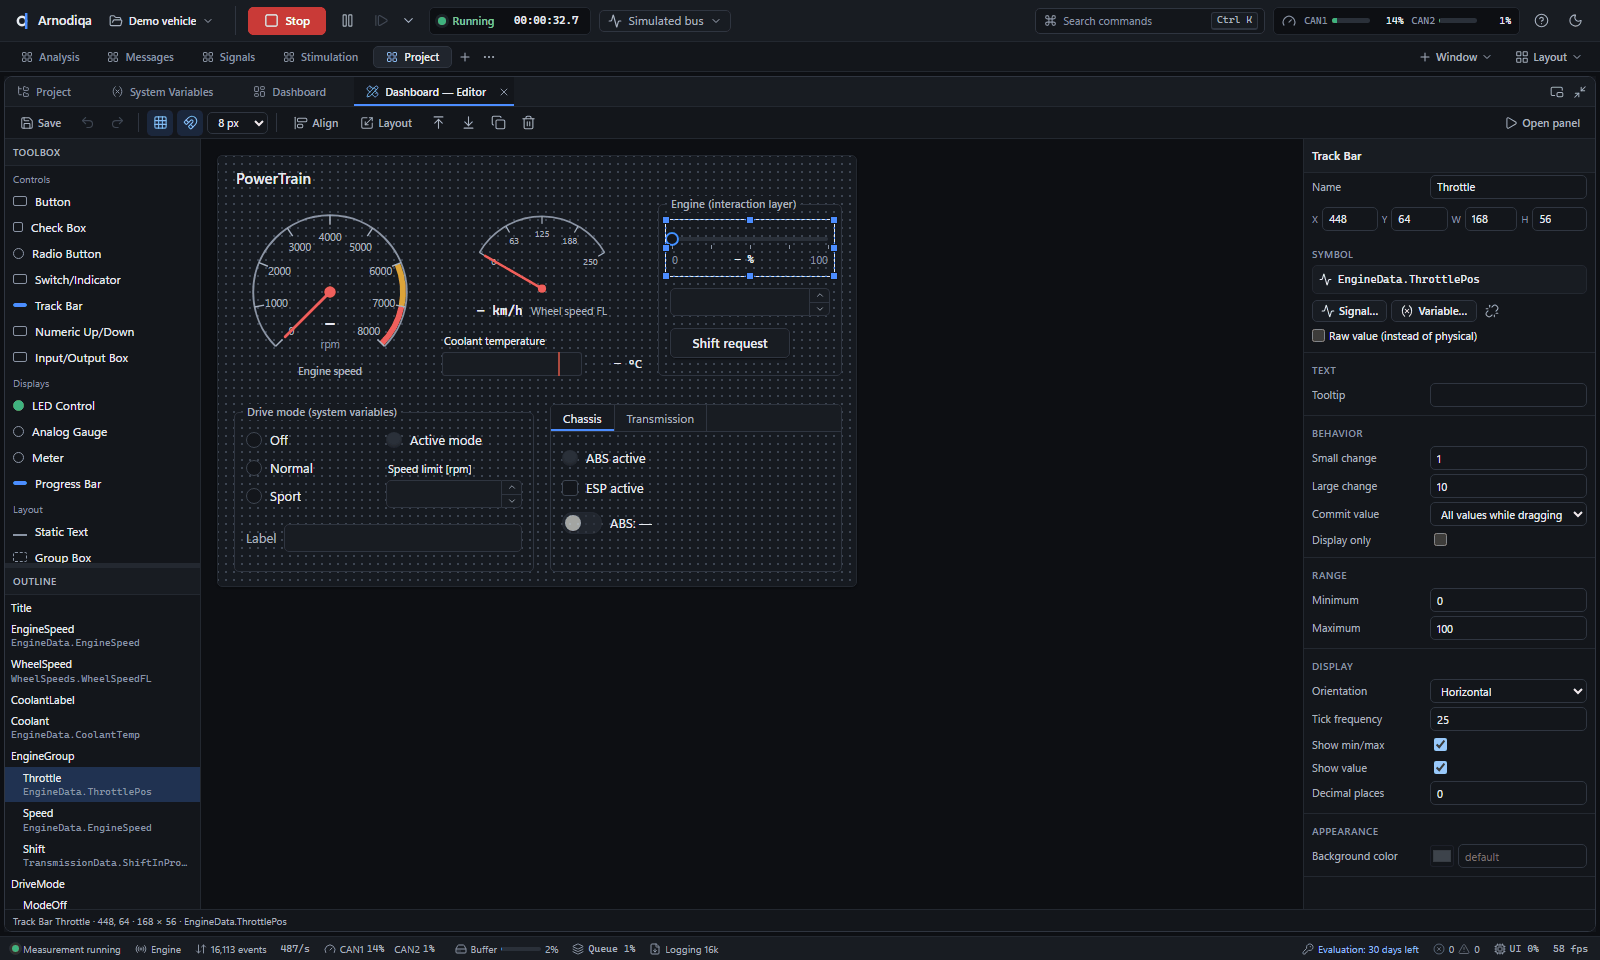
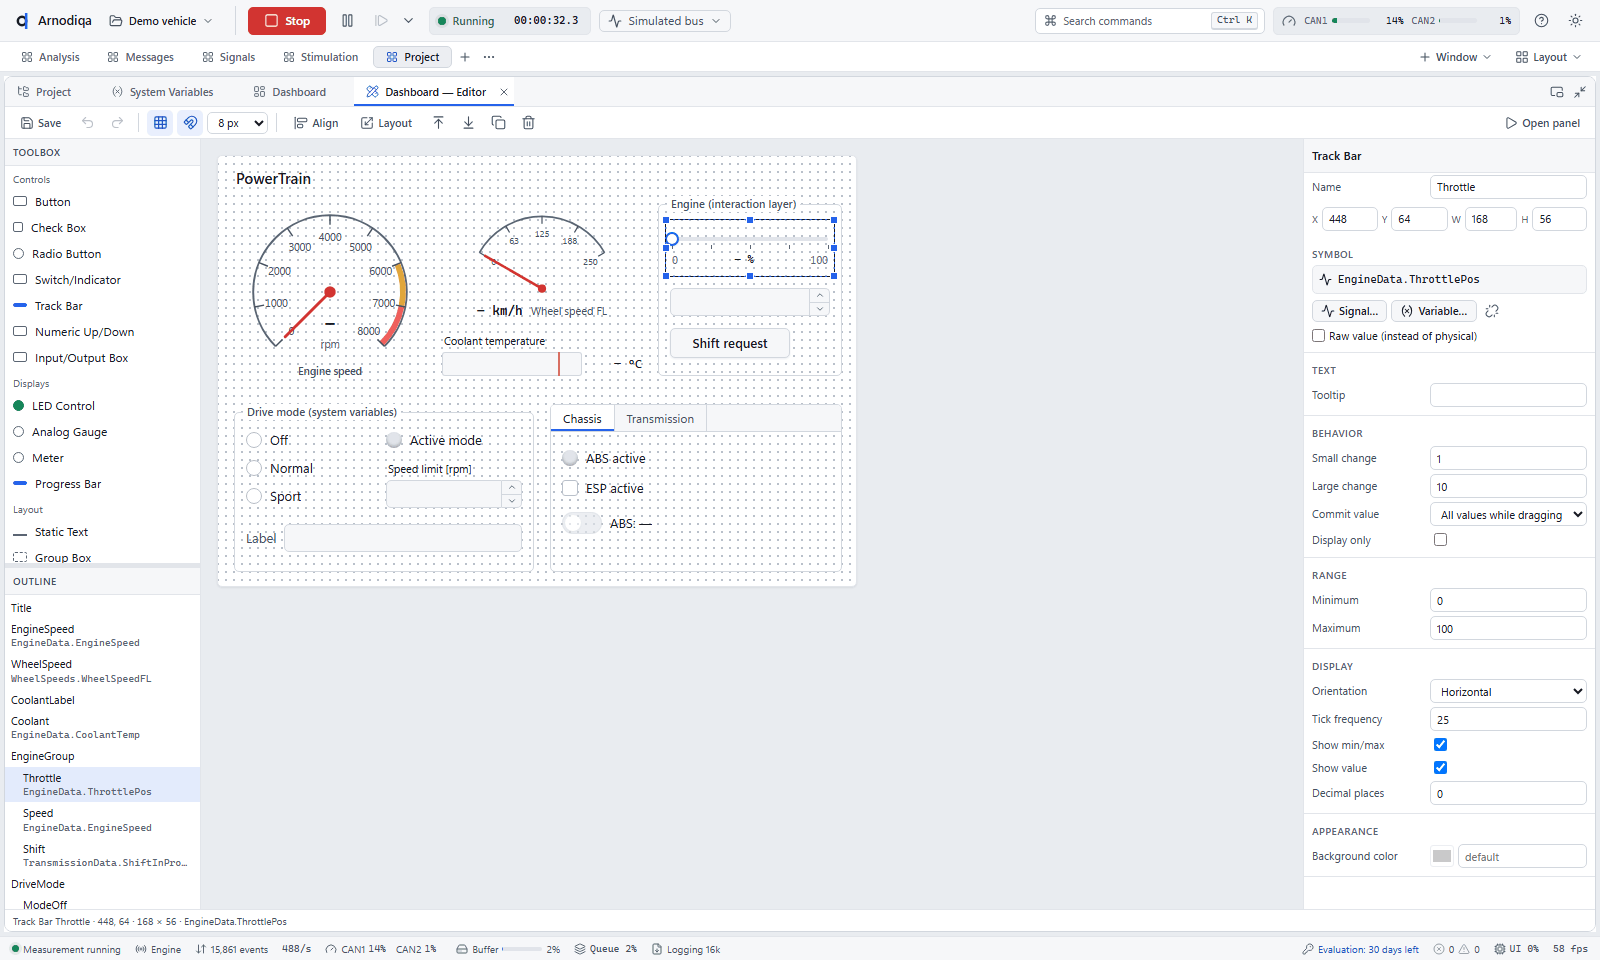
Panel editor with outline, canvas with grid and property panel. The selected slider is bound to EngineData.ThrottlePosition.
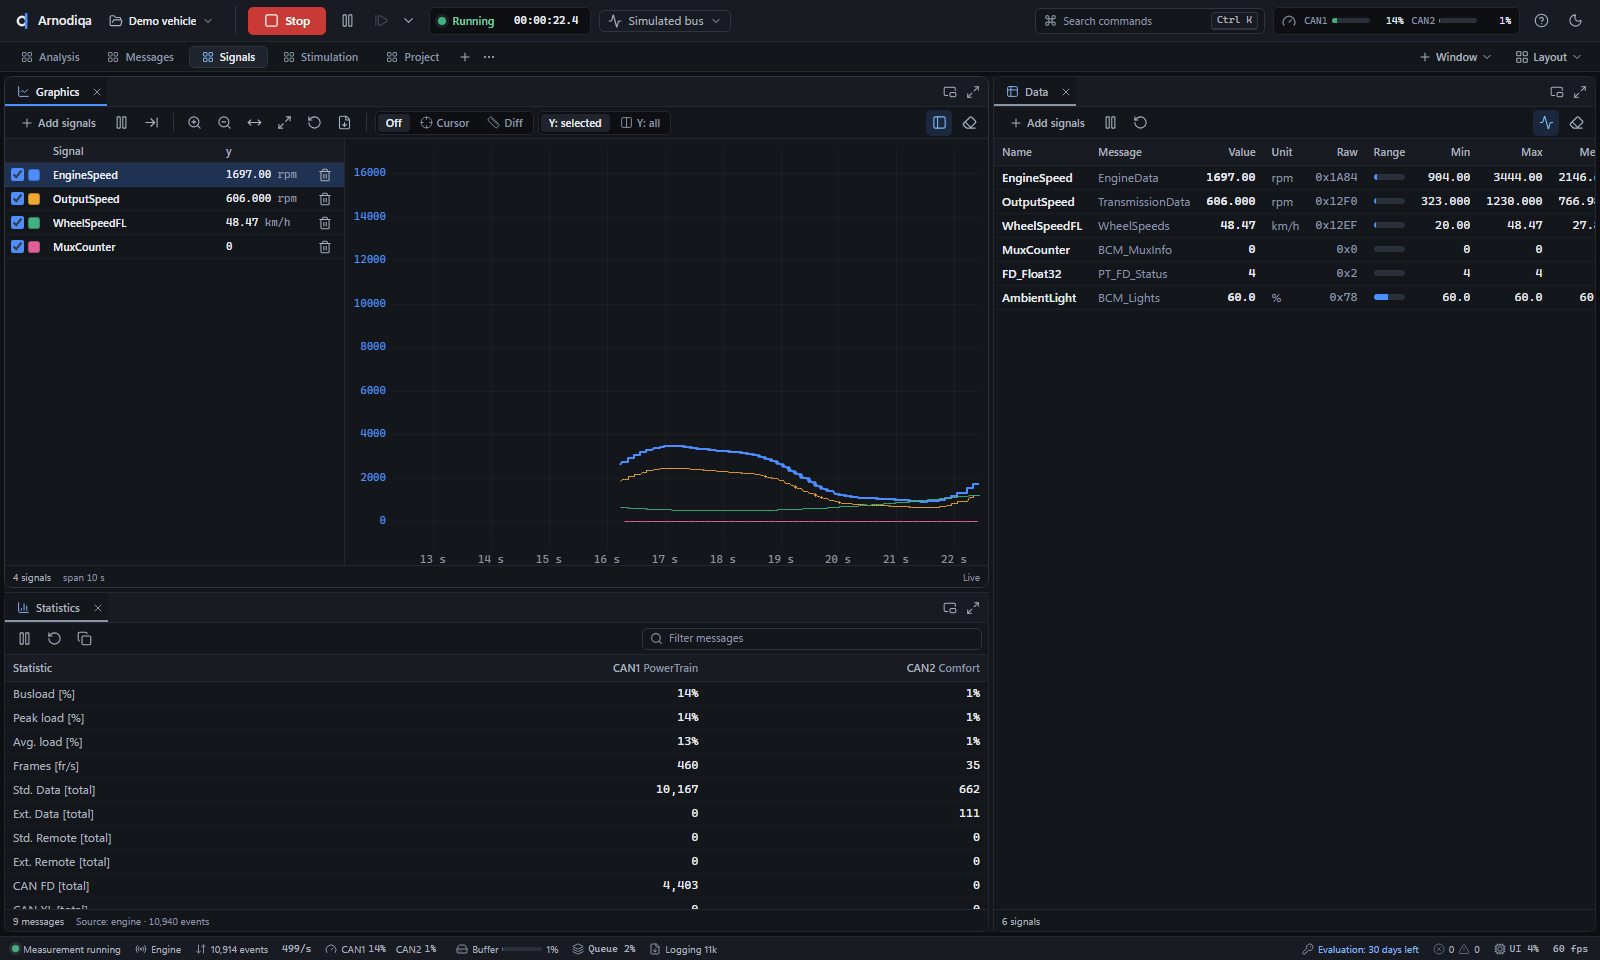
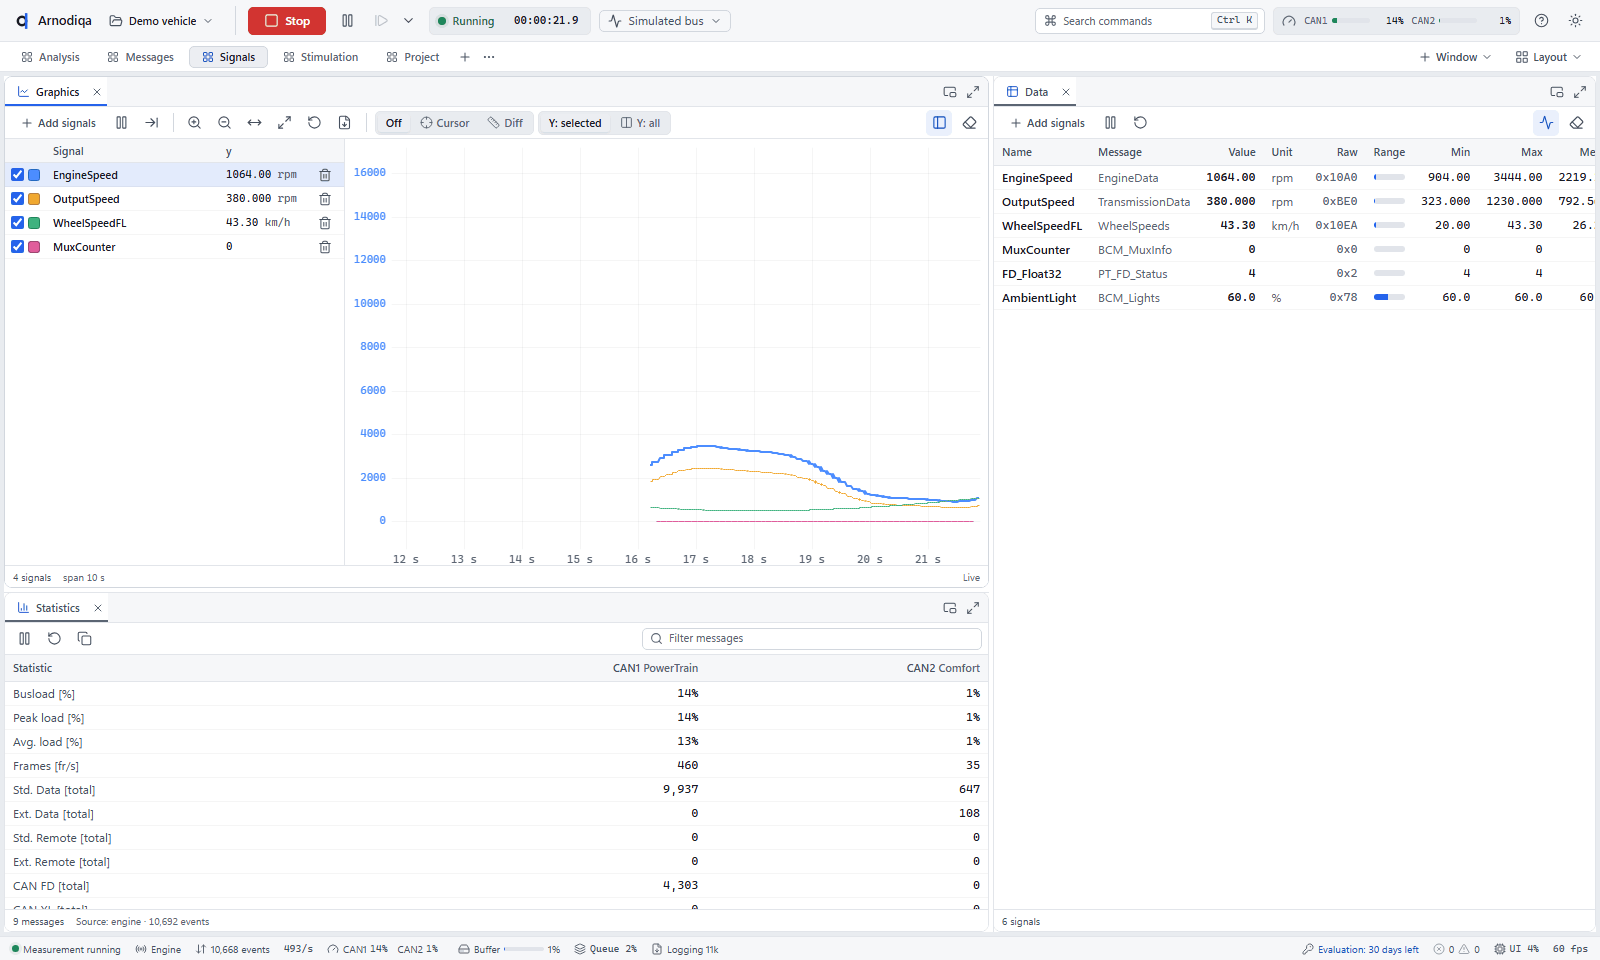
Signal plot with two measurement cursors and their differences, current signal values with minimum, maximum and mean, and bus statistics per channel.
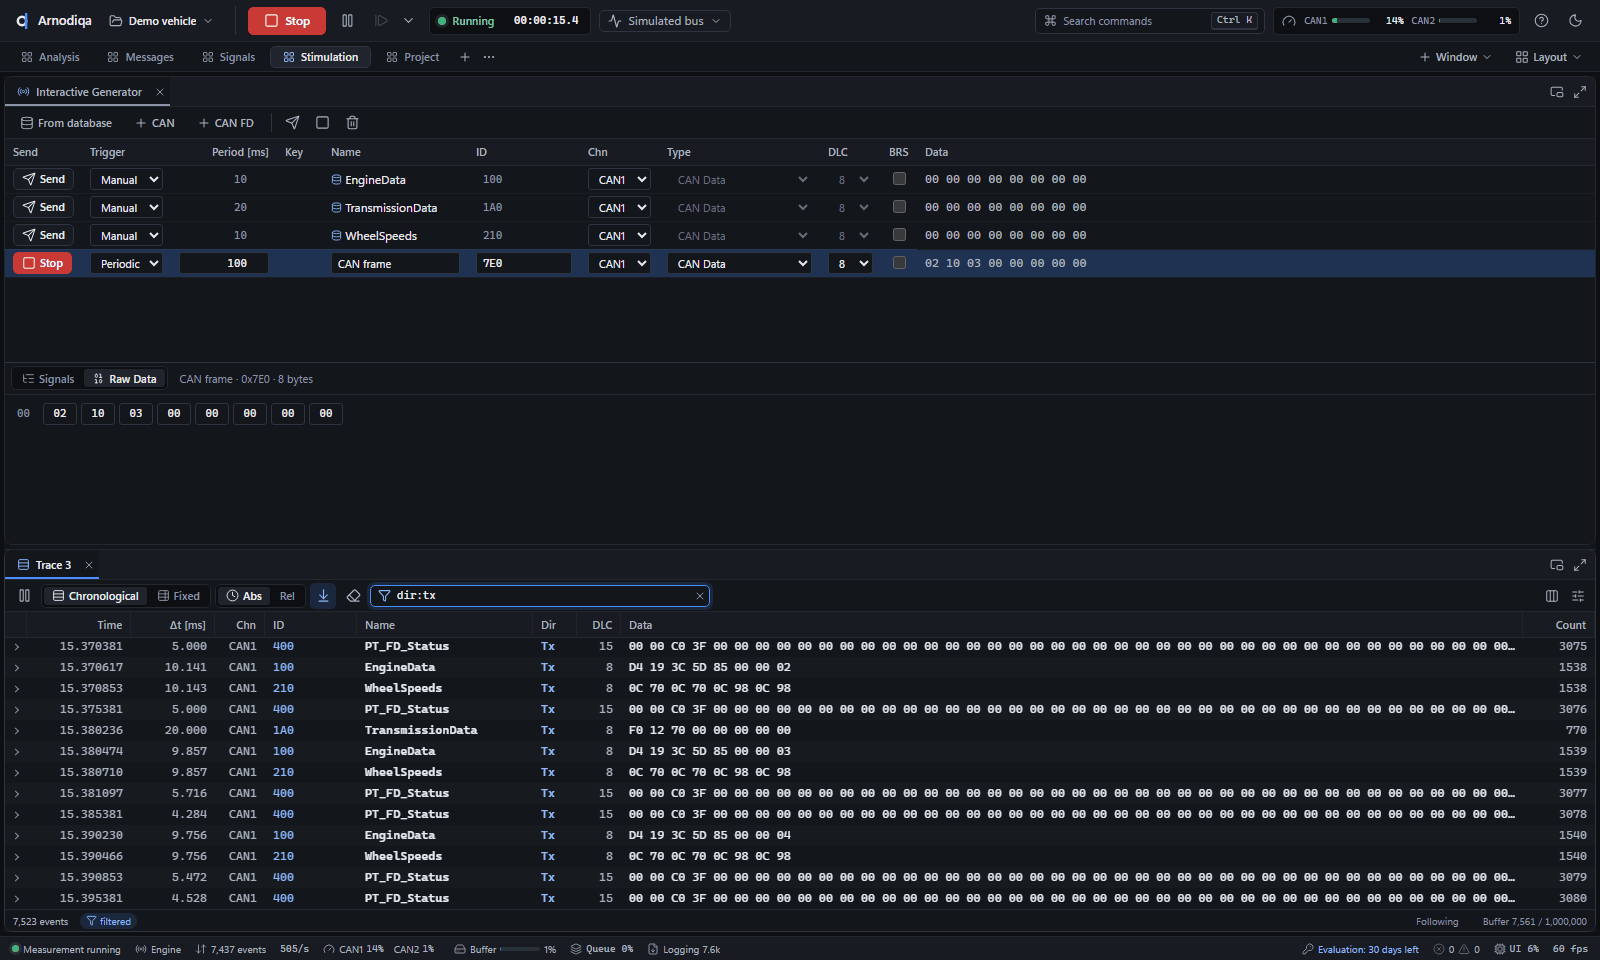
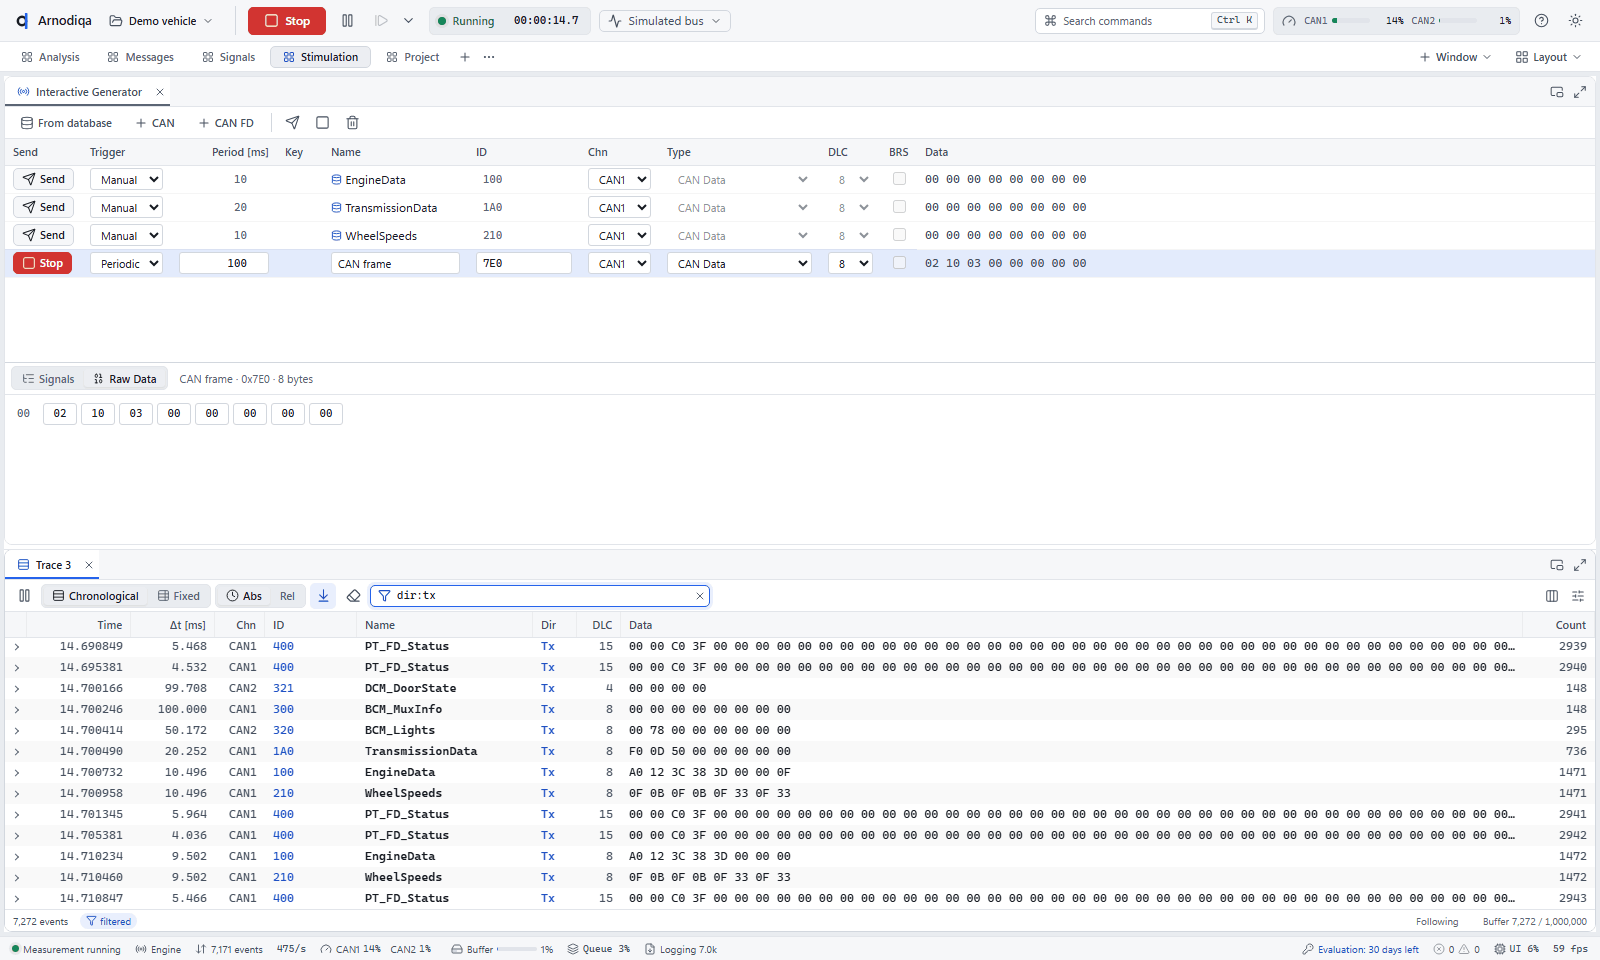
Sending frames manually, periodically or on a key press, including CAN FD; one message is taken from the database. Below, the Trace filtered on transmitted frames.
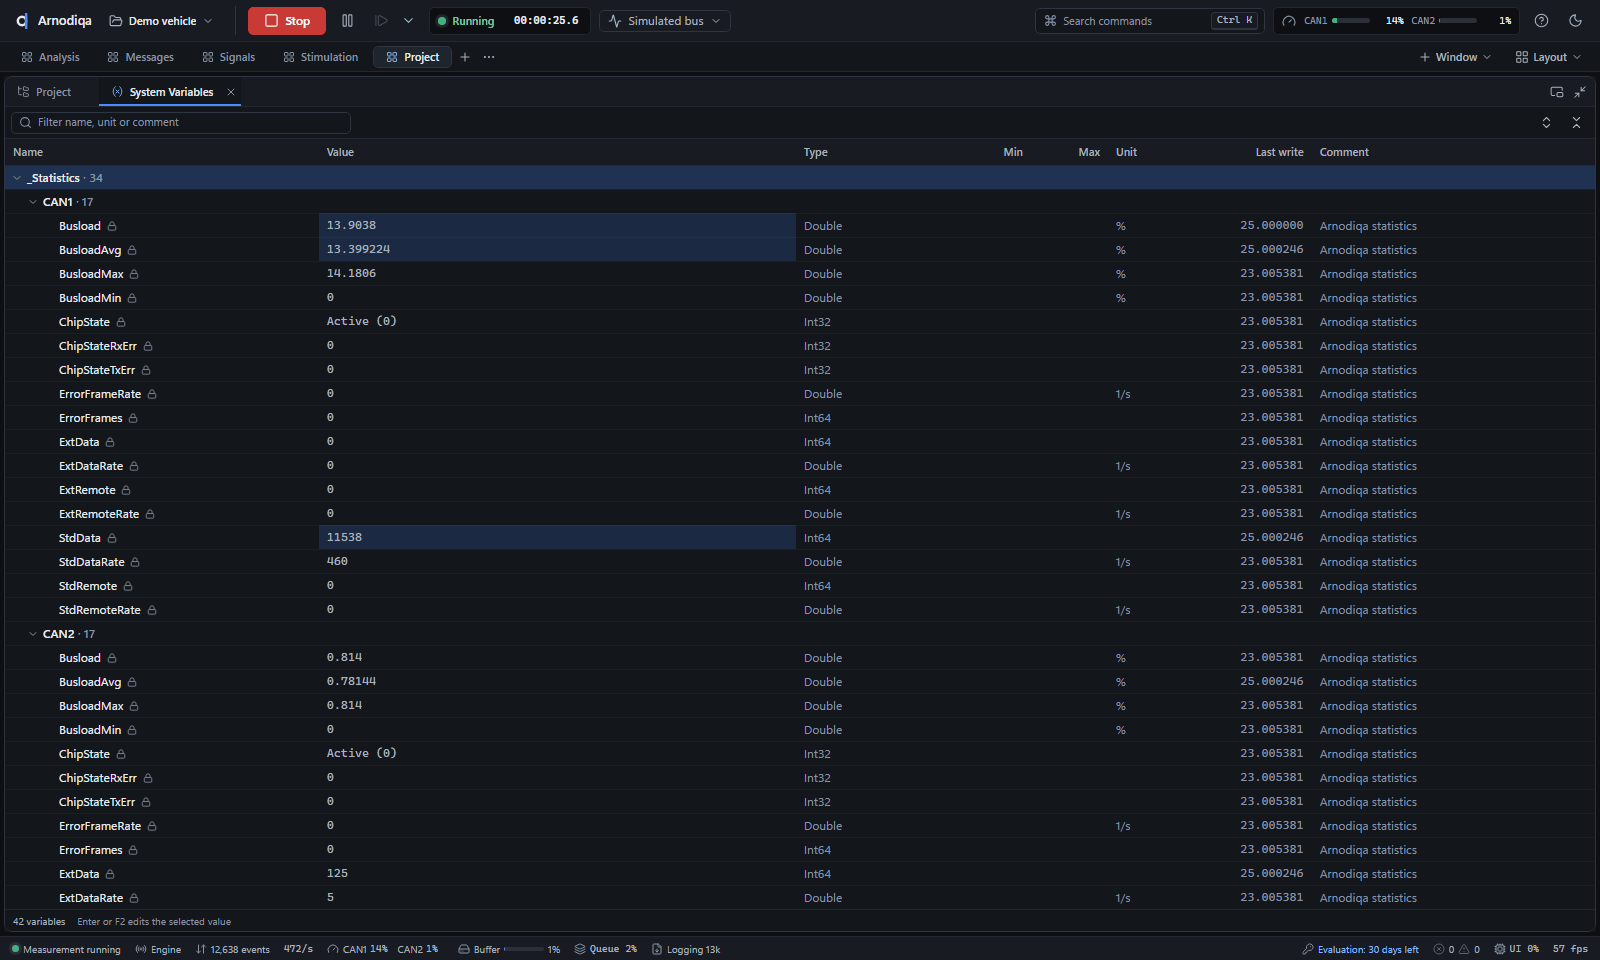
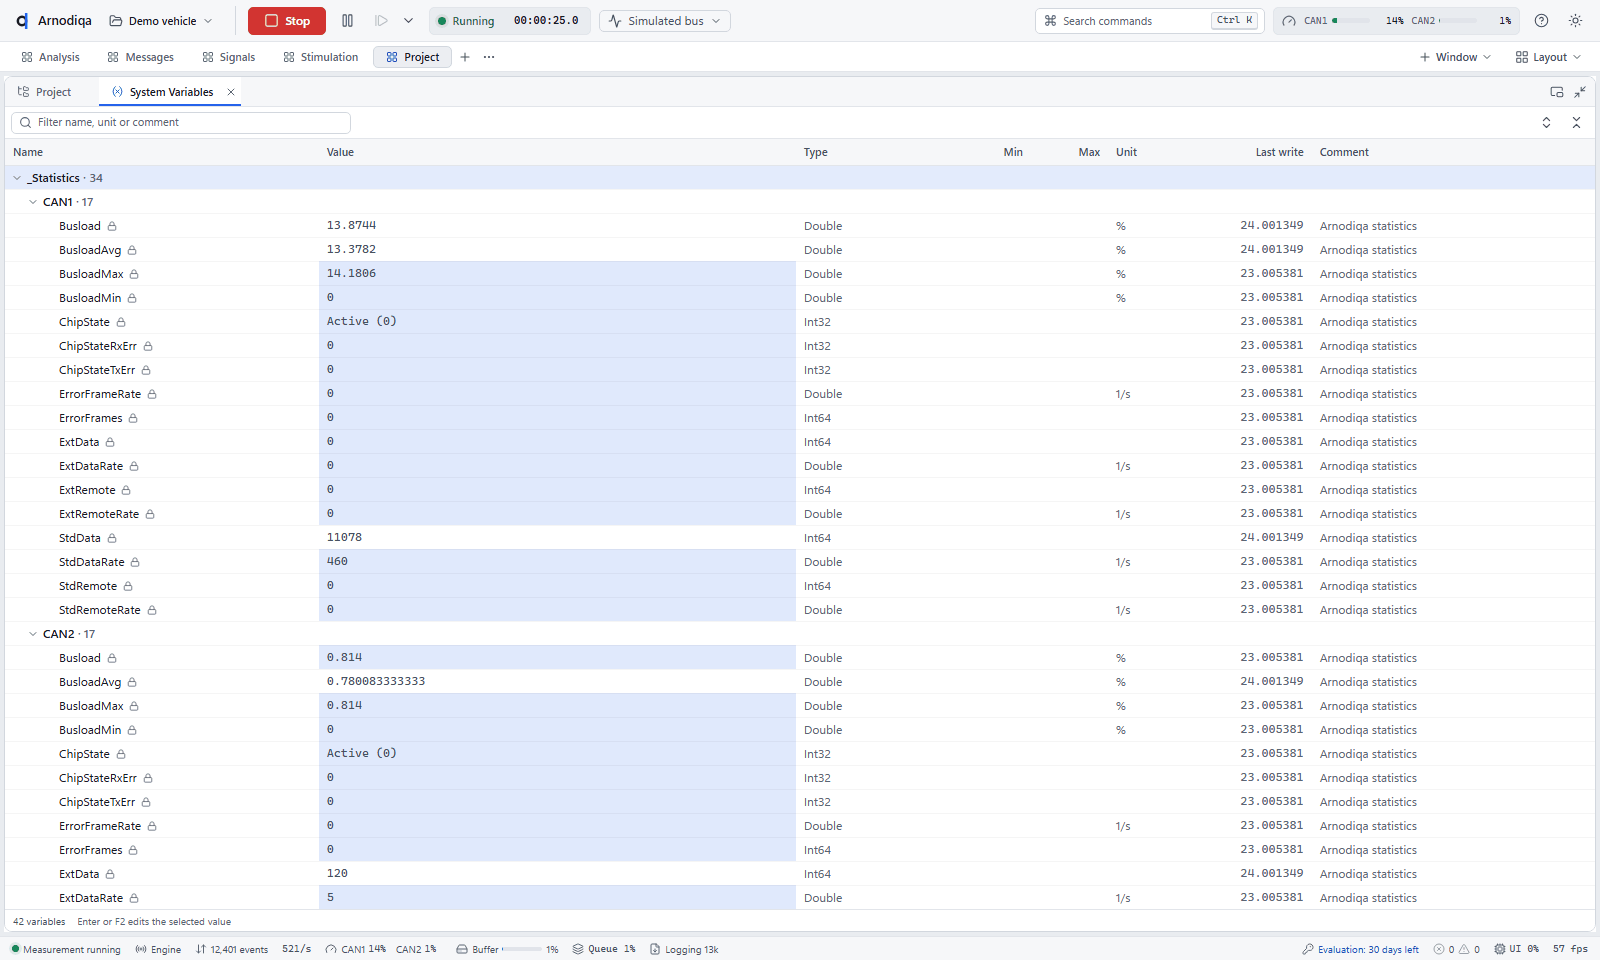
System variables per namespace with value, type, range and unit. A value outside the range is flagged before it is written.
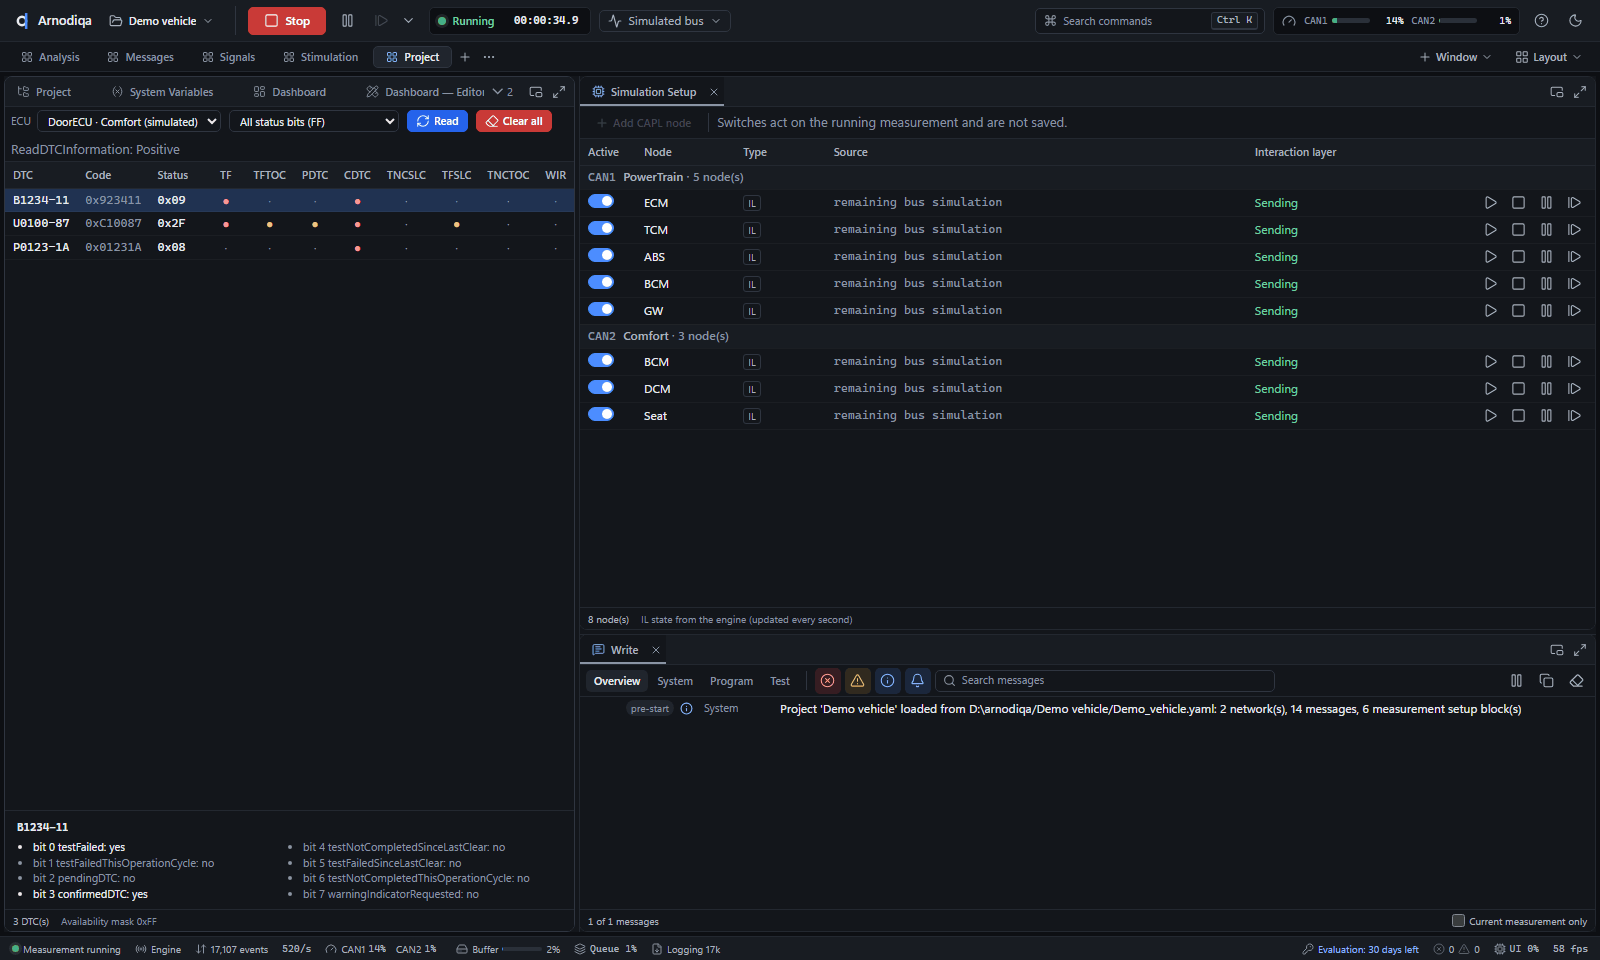
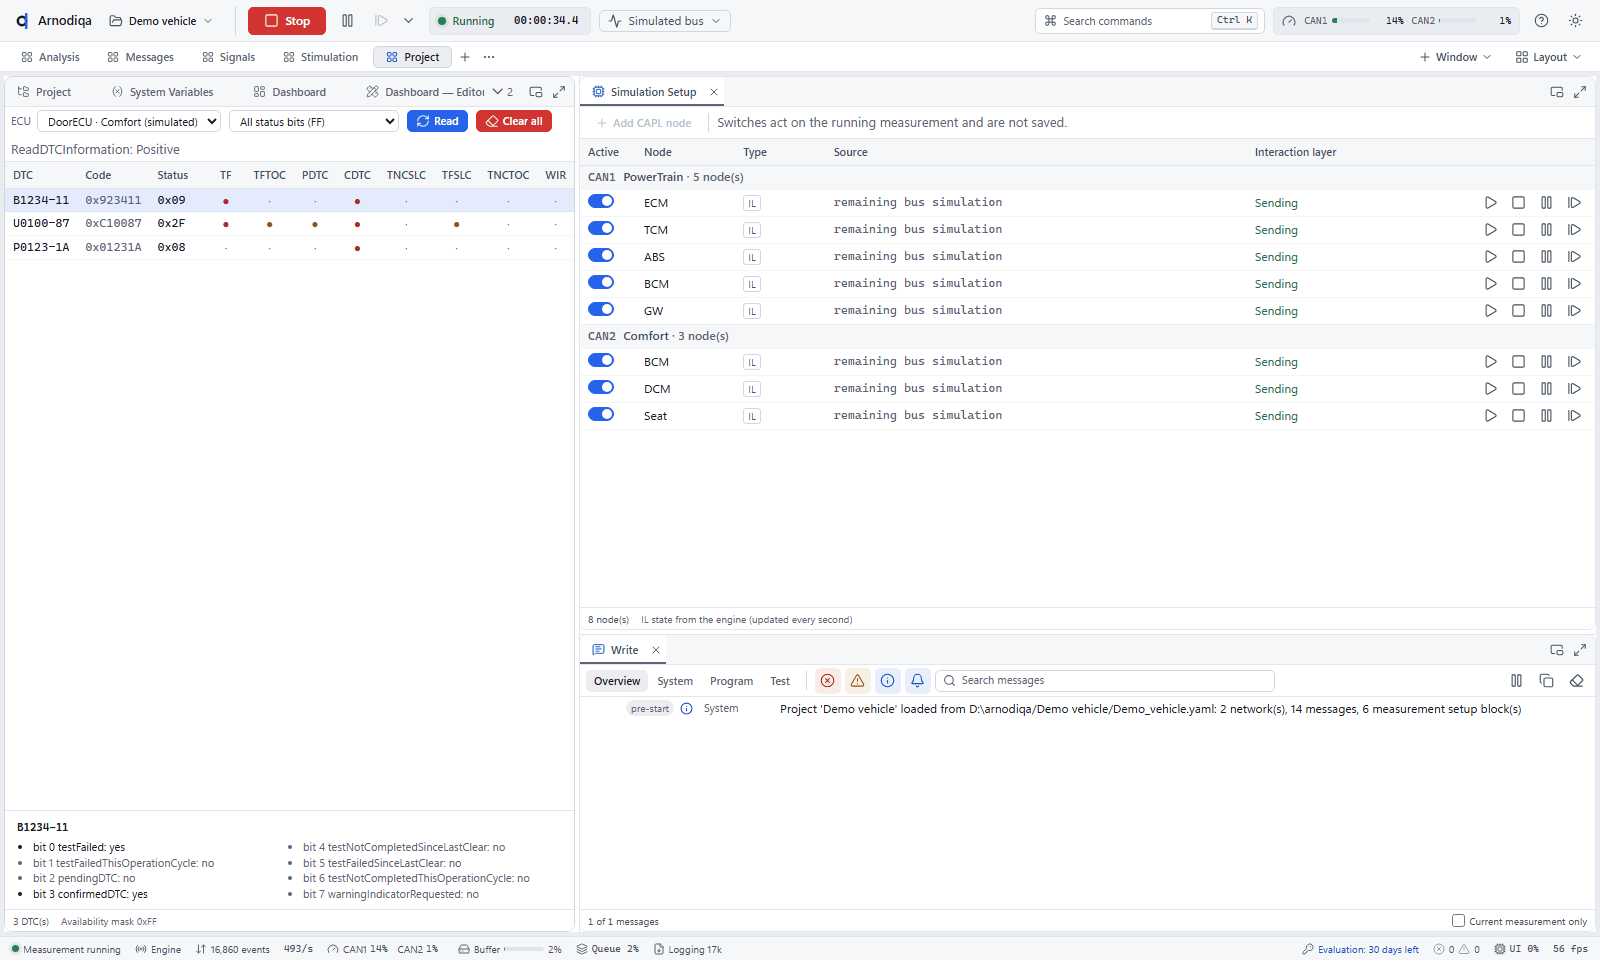
Fault memory of a simulated ECU via UDS (19 02): DTCs with status bits and details of the selected DTC. On the right, the Simulation Setup with the rest-bus nodes.
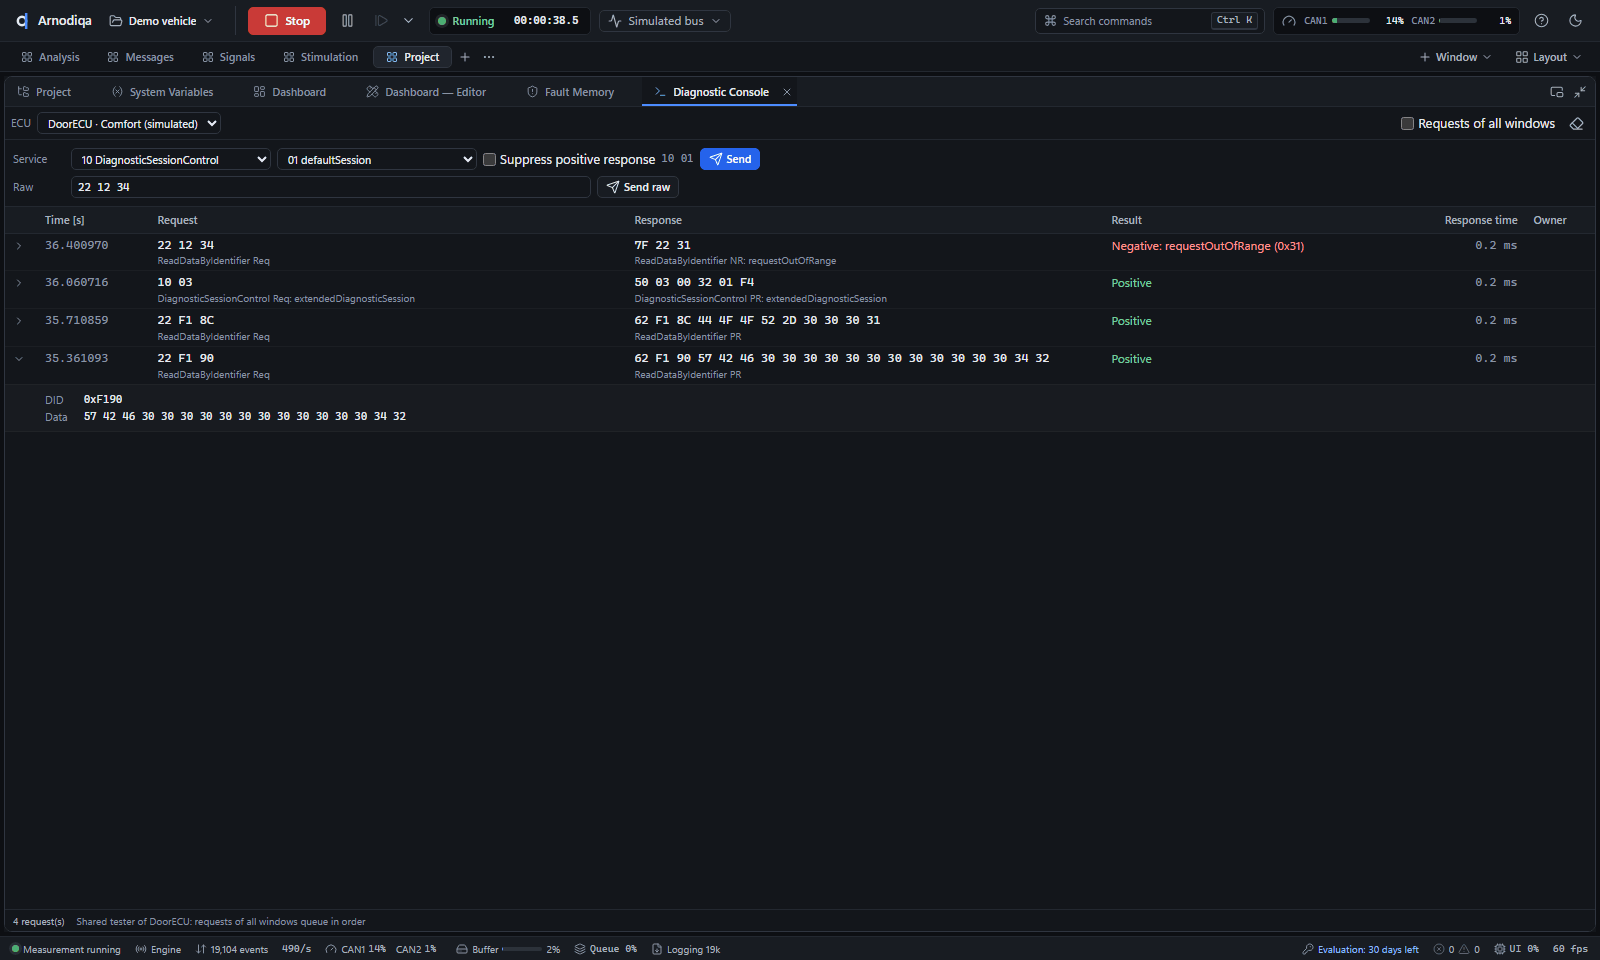
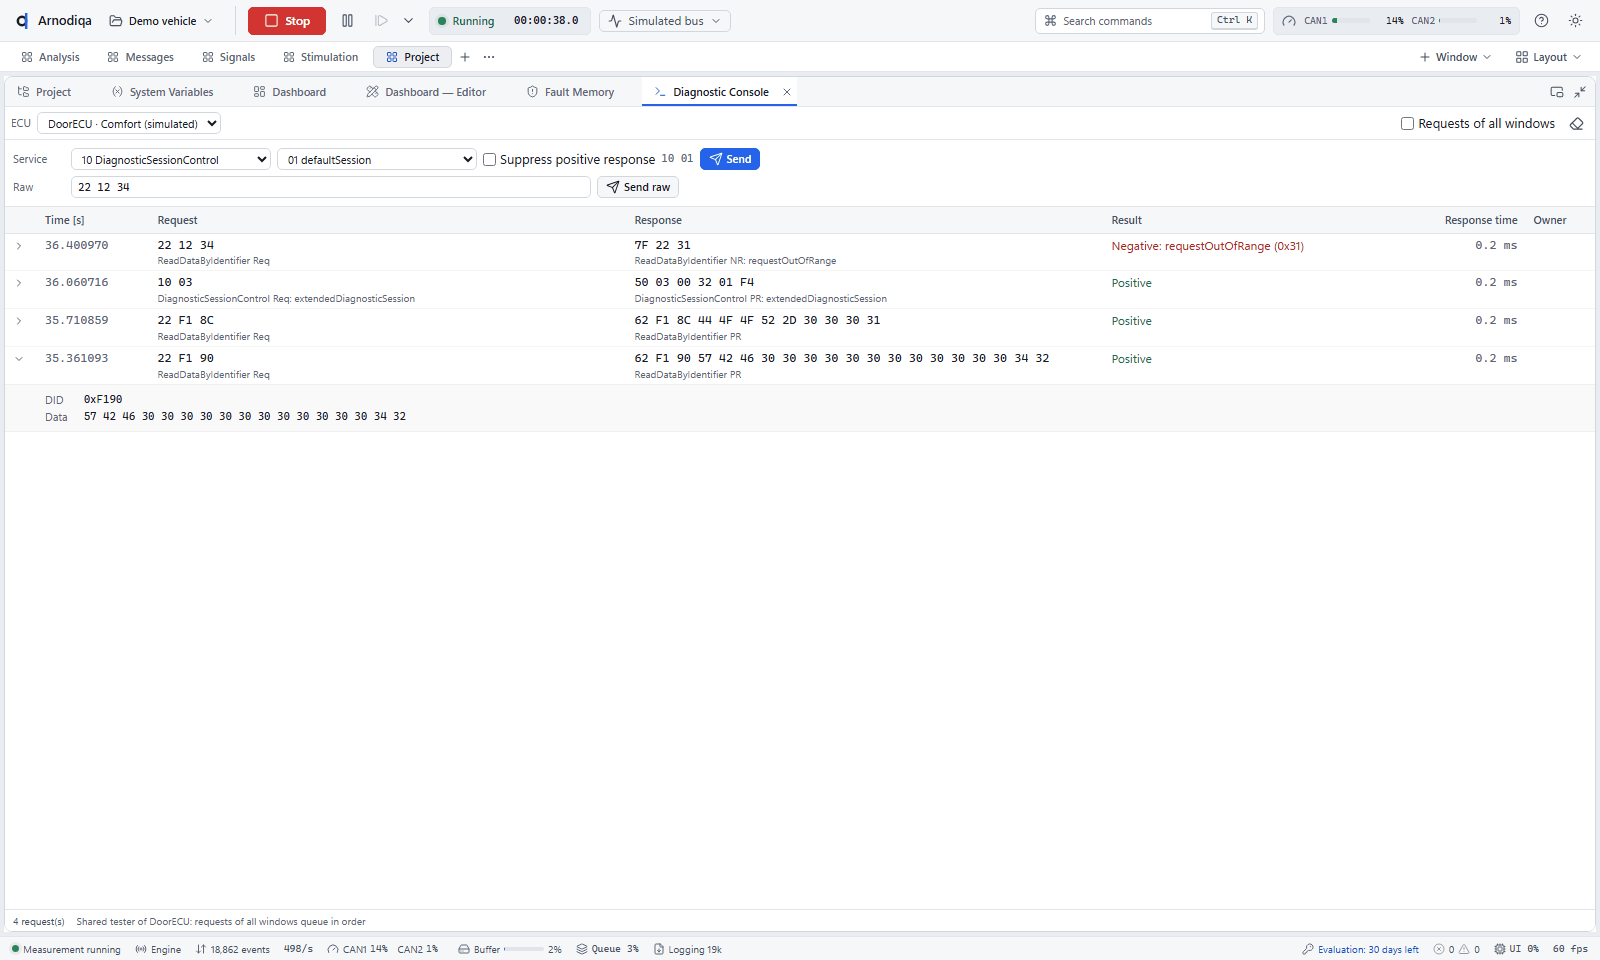
Diagnostic requests as a service or as raw bytes, with decoded positive and negative responses and the details of a DID.
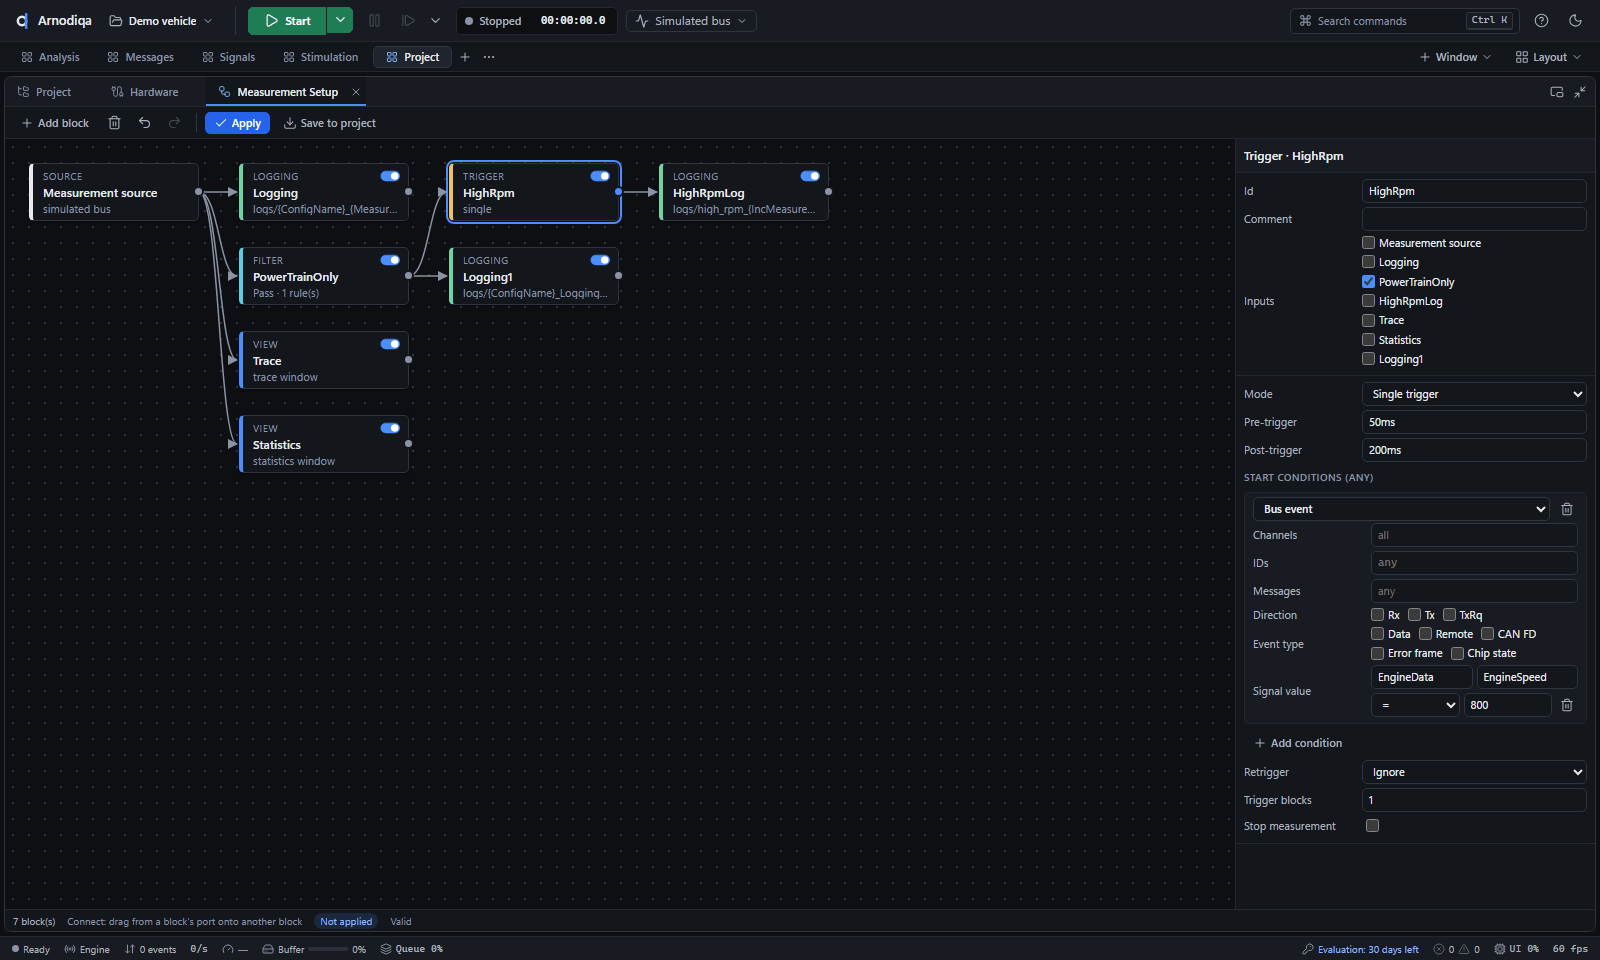
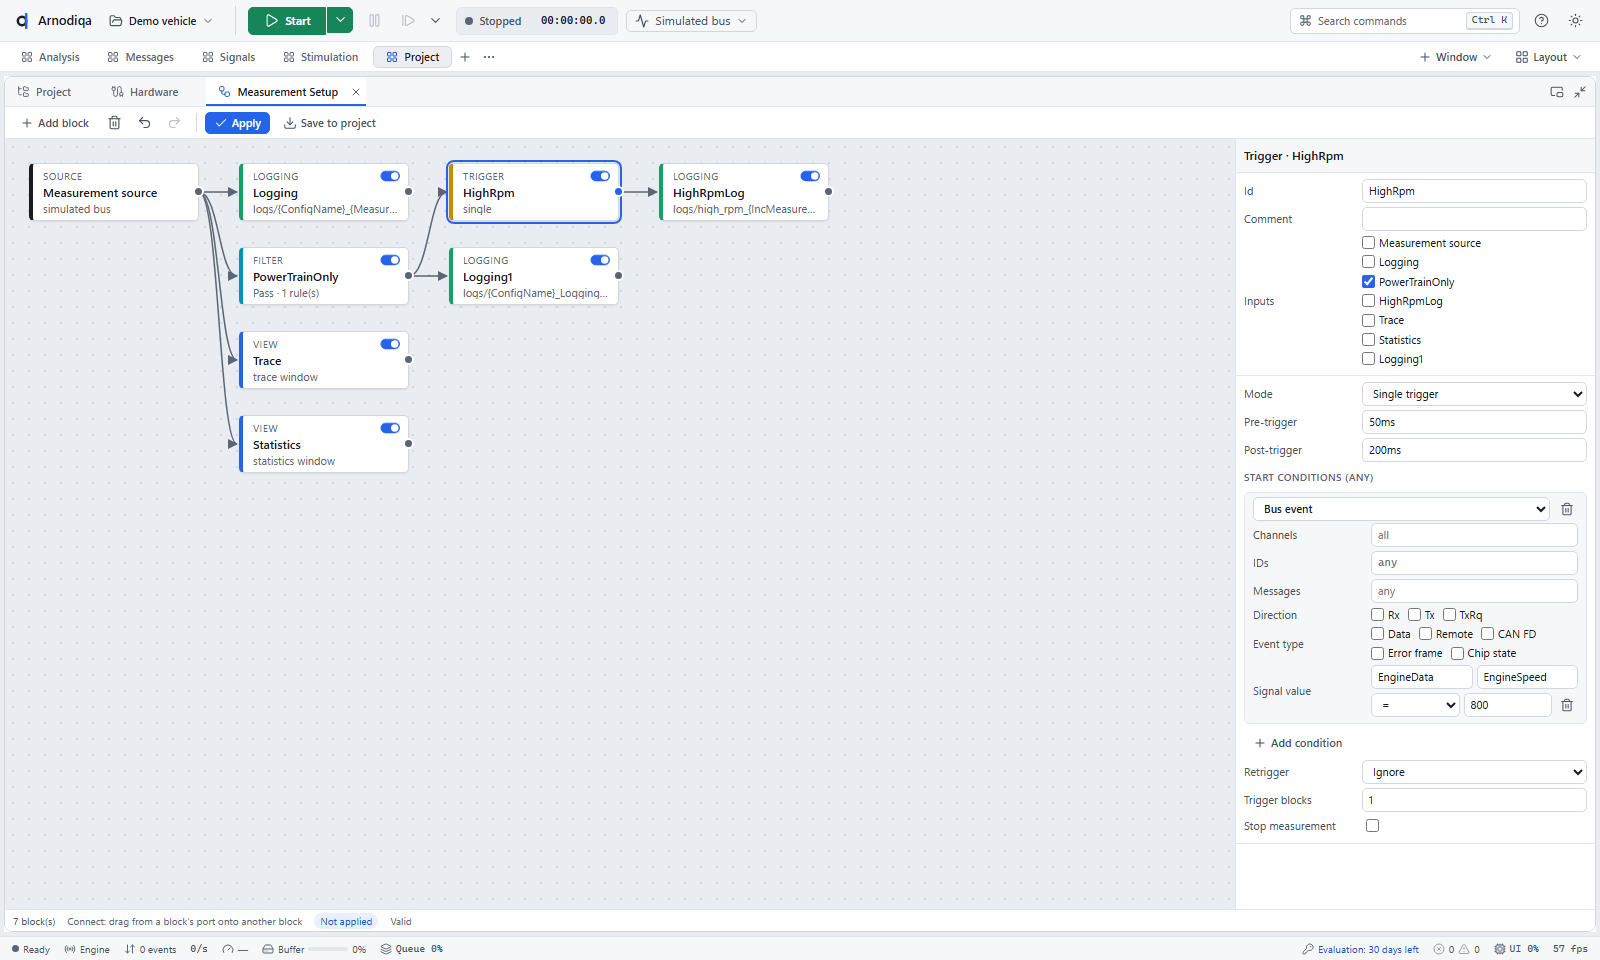
Graphical editor for the Measurement Setup: measurement source, filter, trigger, logging and view blocks with their connections; on the right, the properties of the selected trigger.
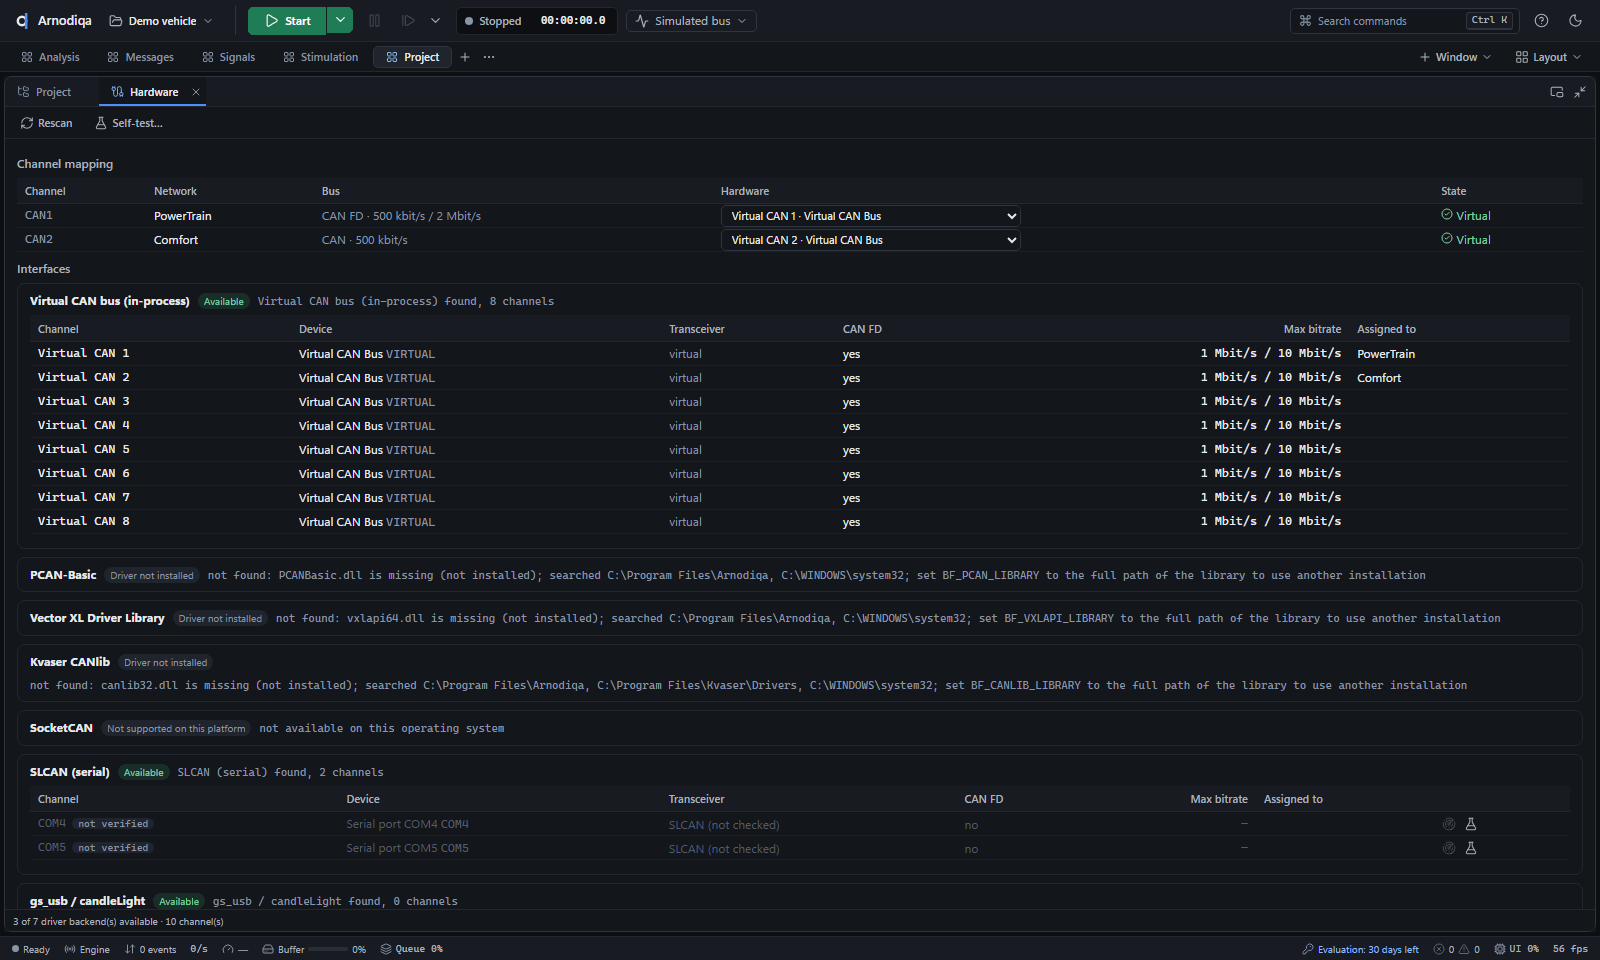
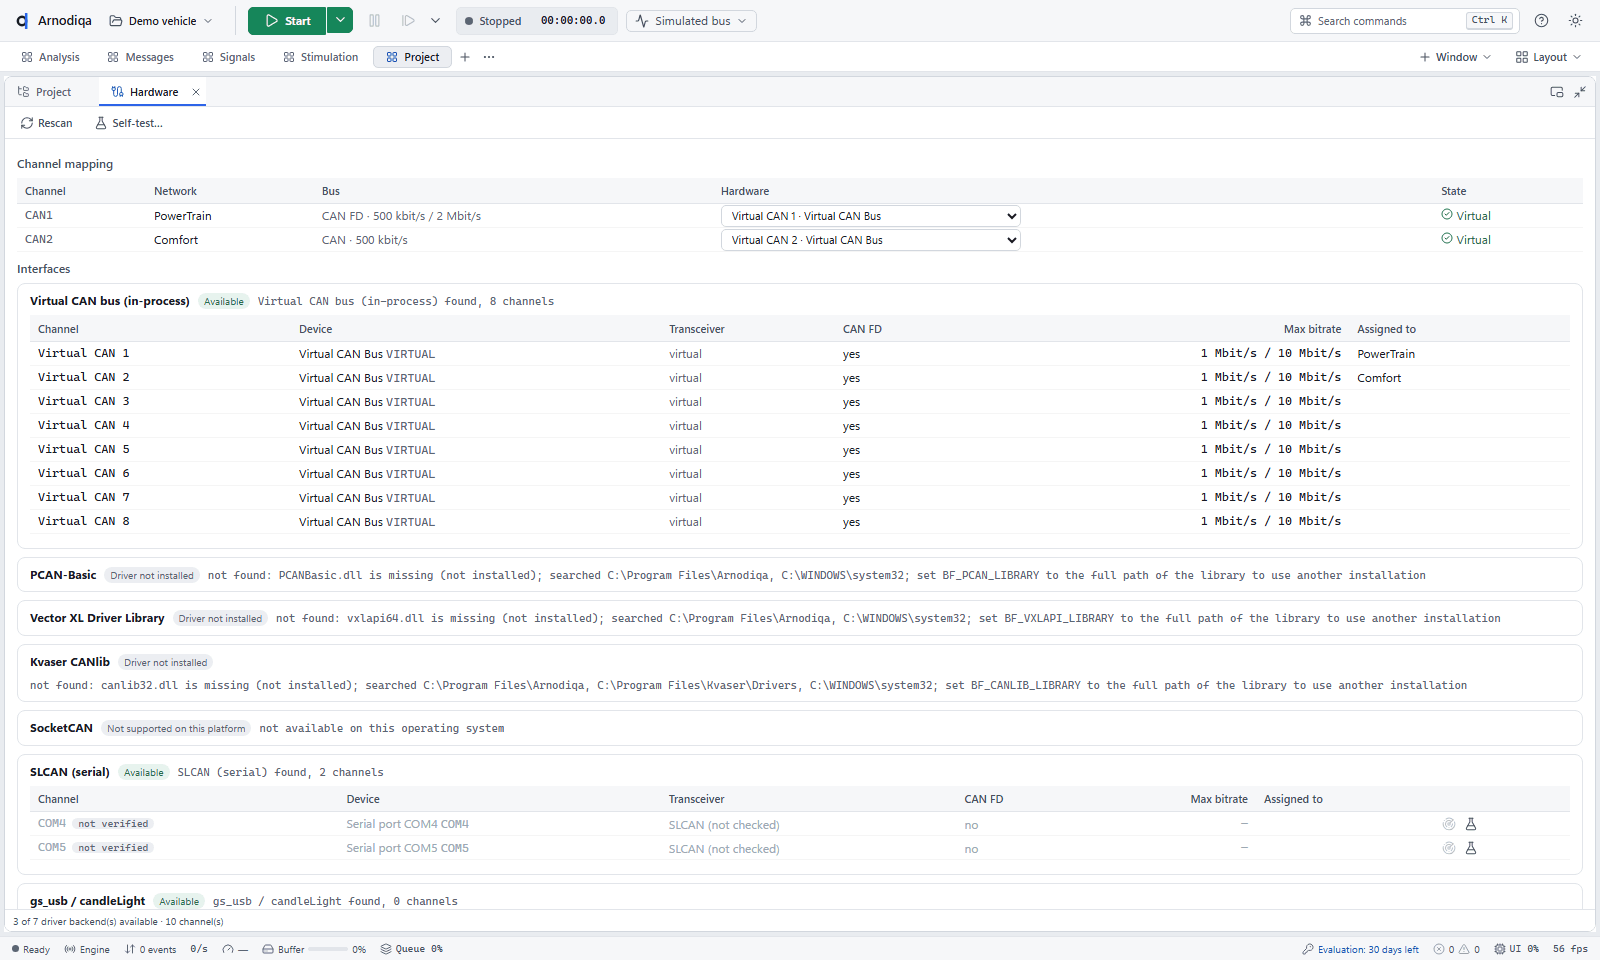
Channel assignment per network and the status of each driver: interfaces found with channels, CAN FD and maximum bit rate, or the name of the missing driver library.
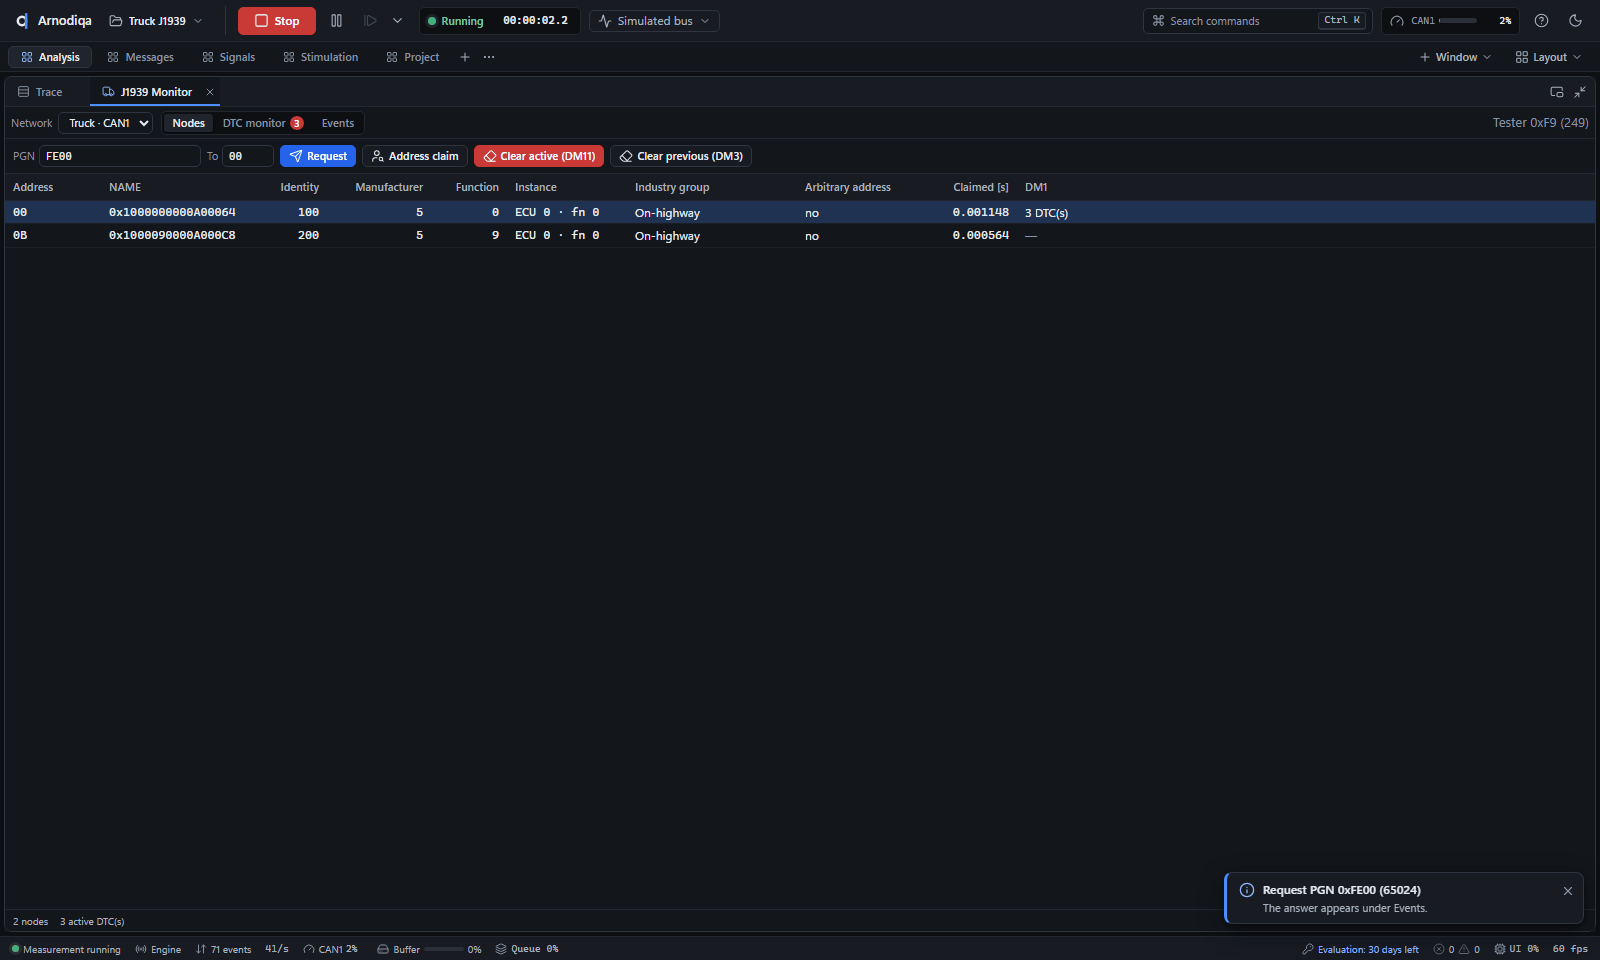
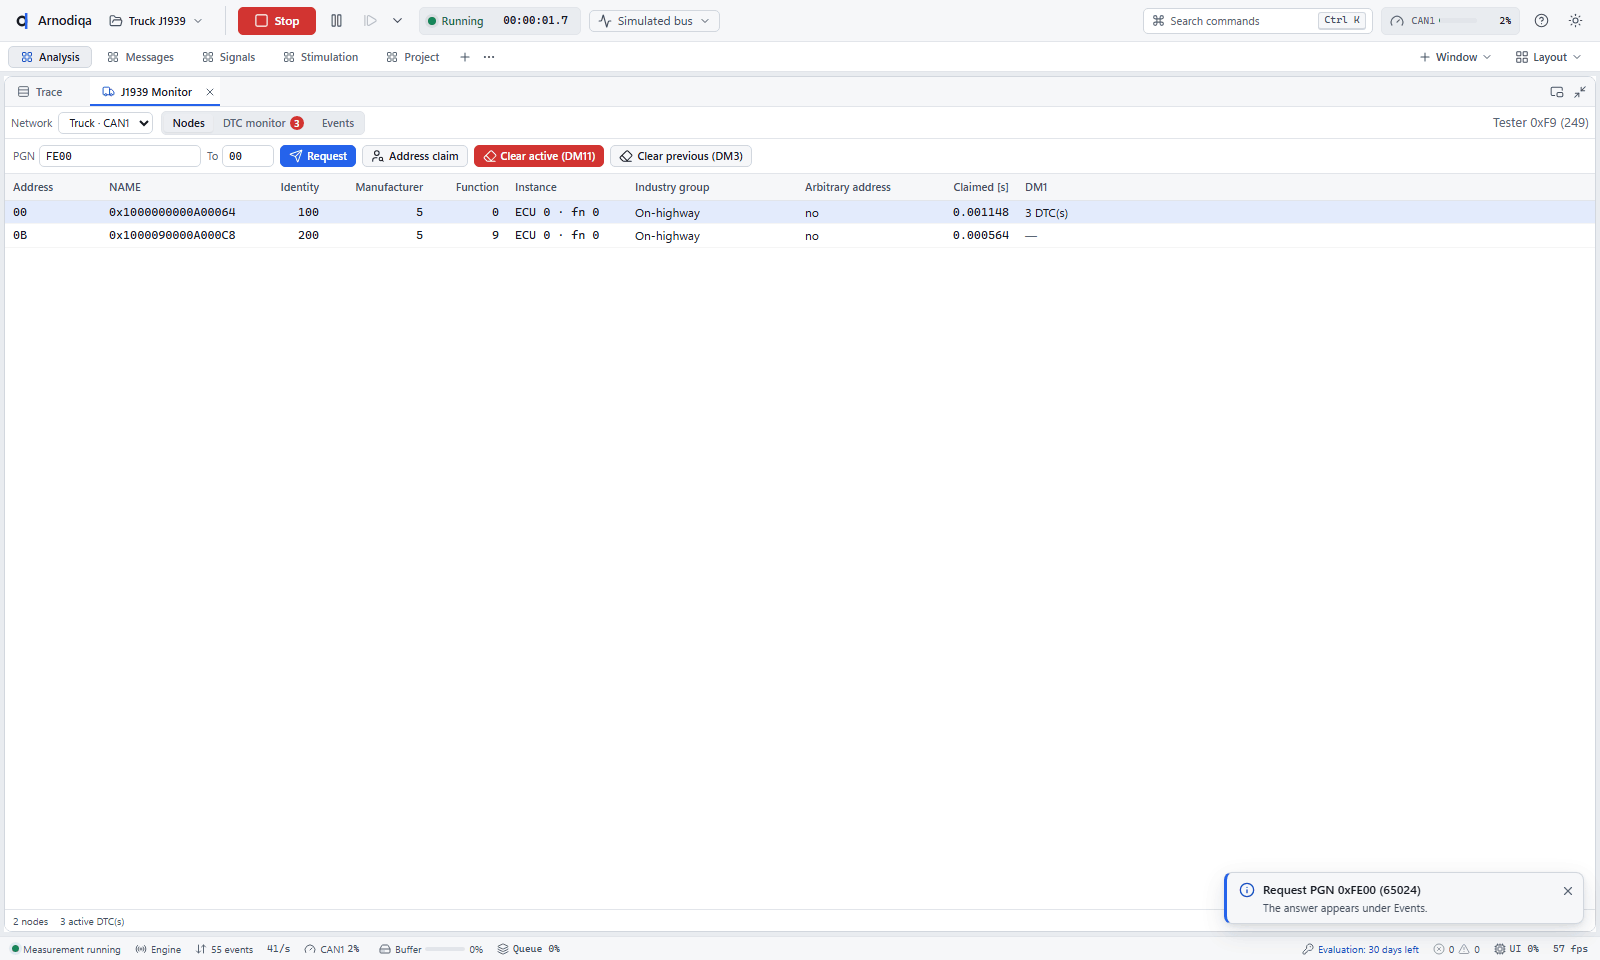
Nodes on the J1939 network with address, NAME and its fields, the time of the address claim and the DM1 state. At the top: request, address claim and DM11/DM3.
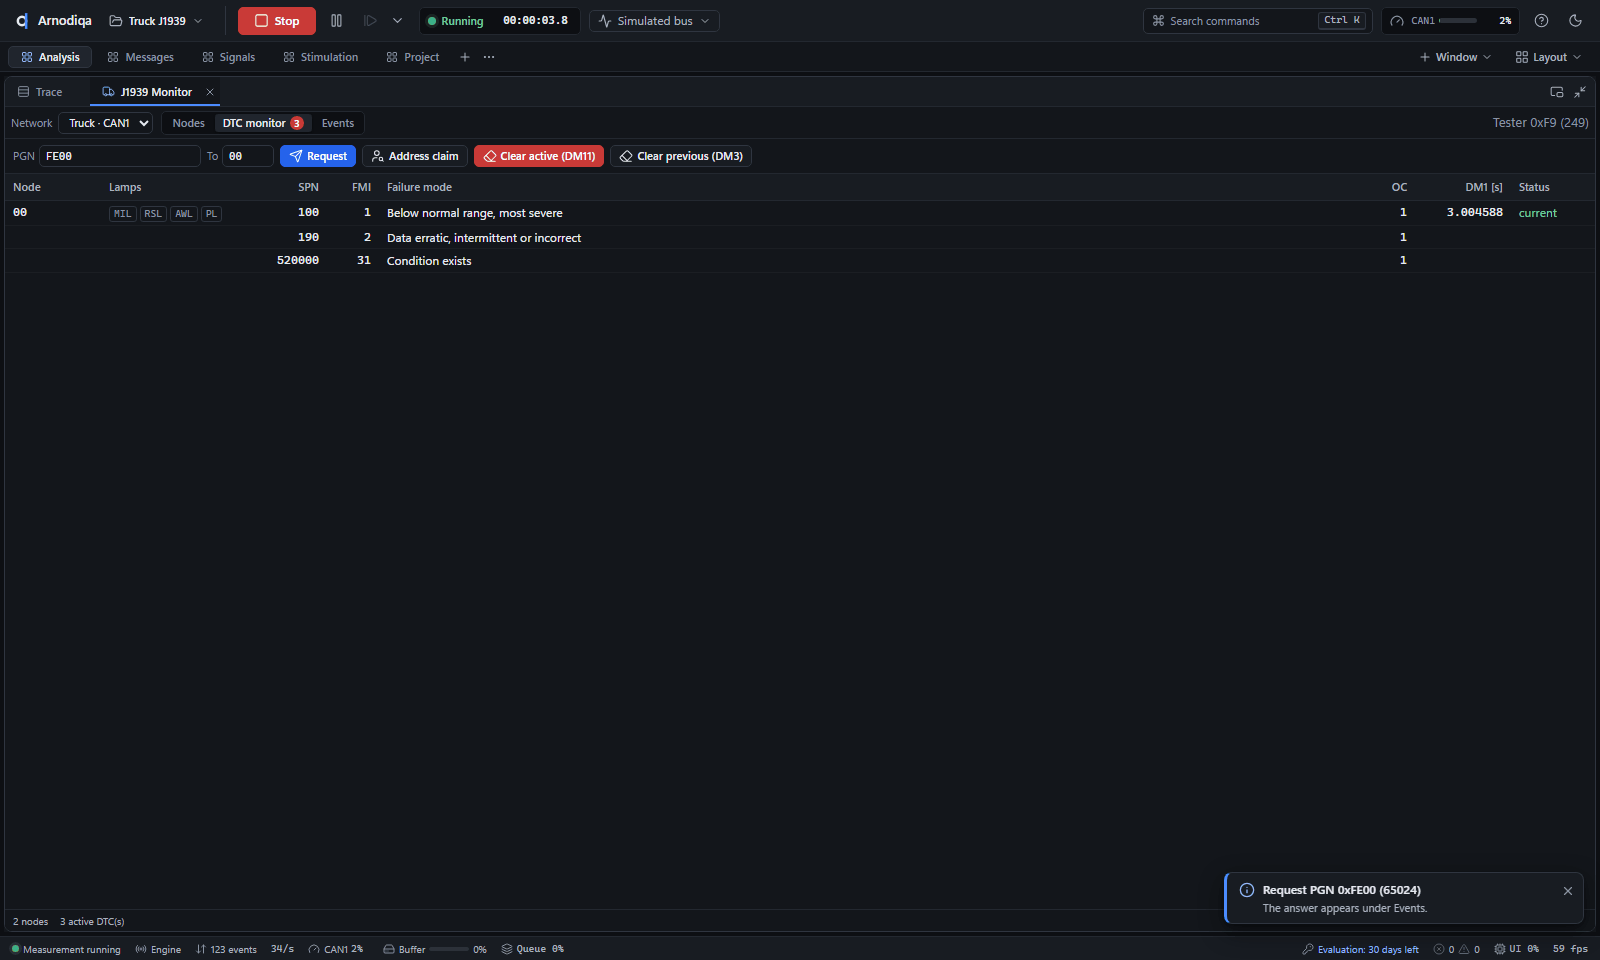
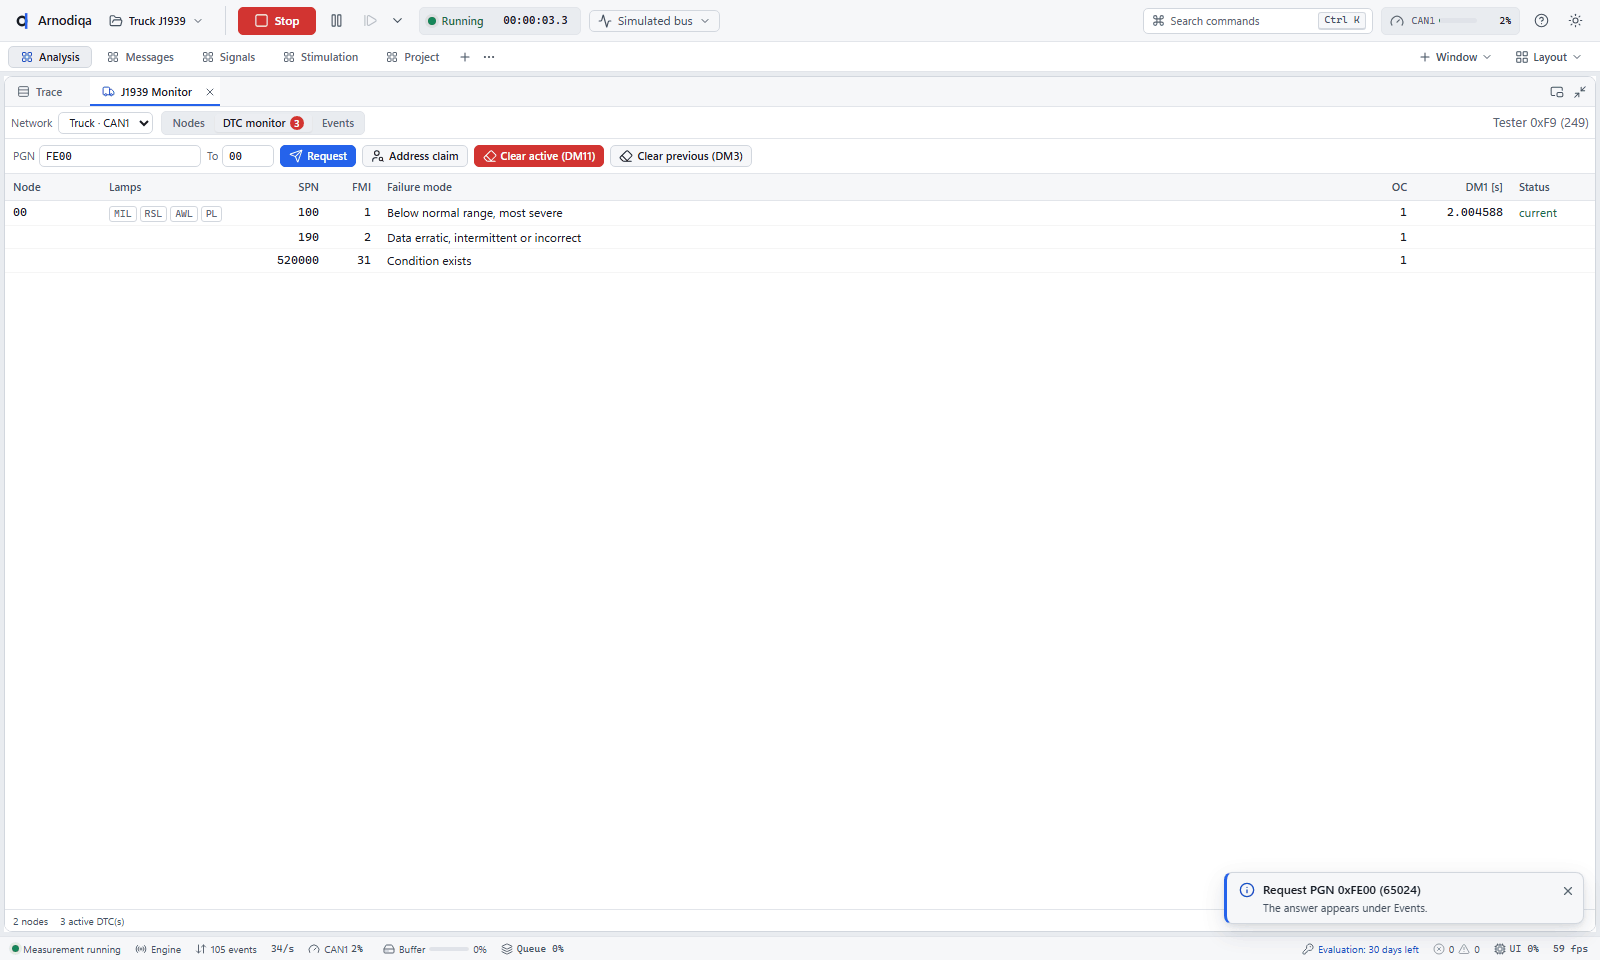
Active fault codes from DM1 with lamp status, SPN, FMI with description and occurrence count.
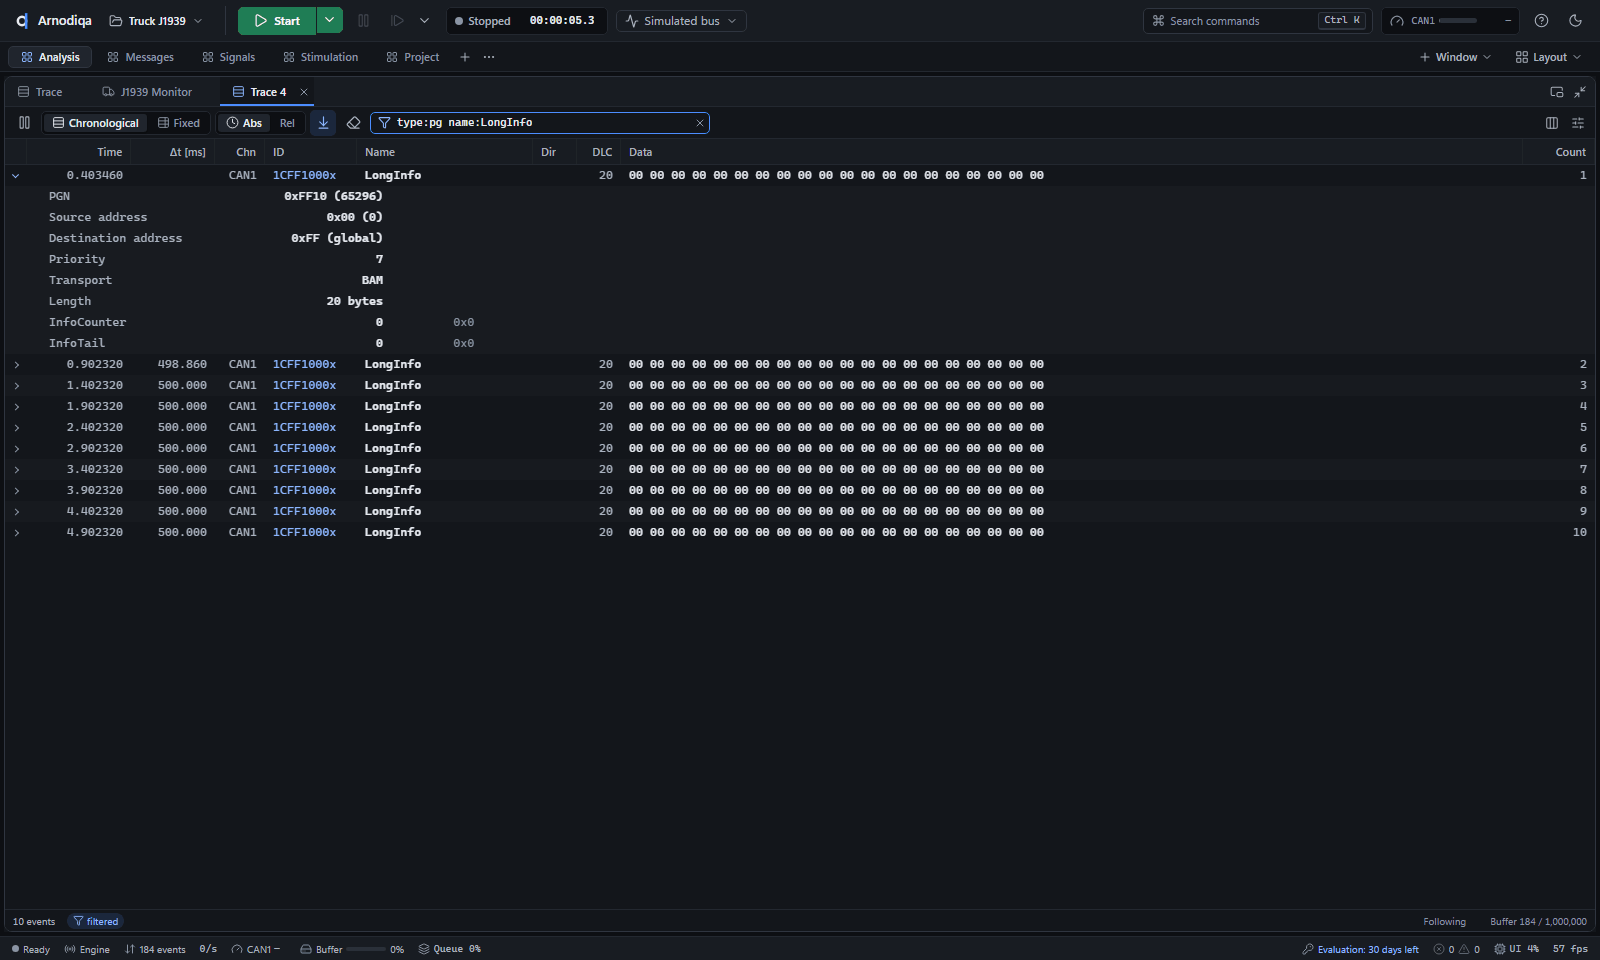
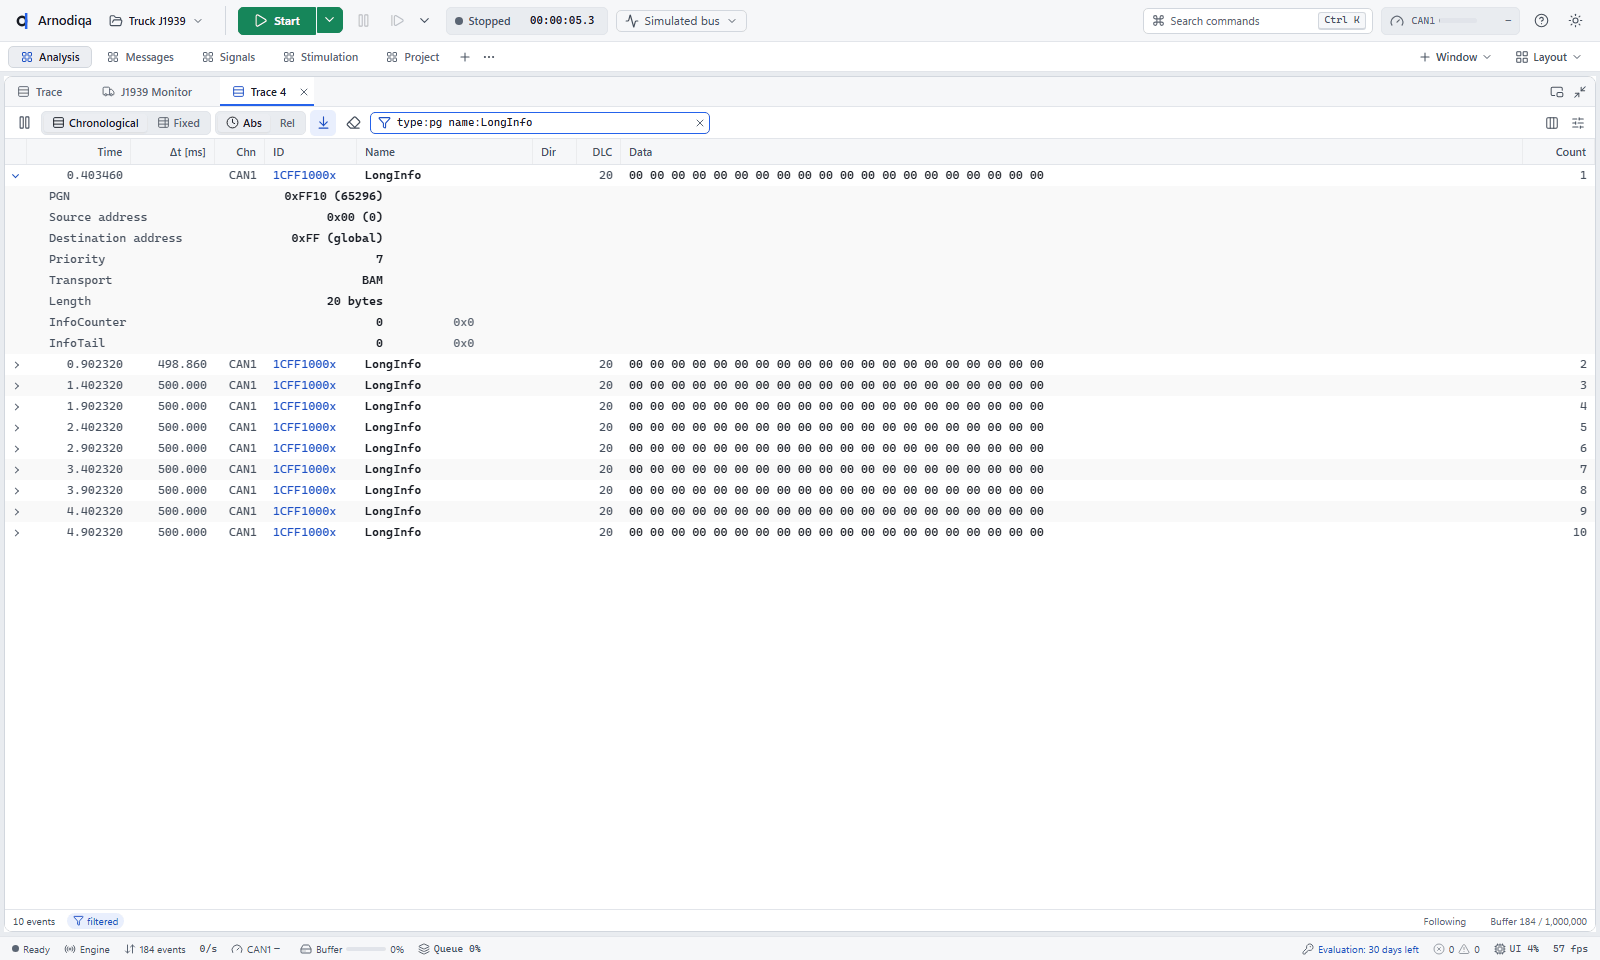
A 20-byte PG from a BAM transfer as a single line in the Trace, with PGN, source and destination address, priority and signals.
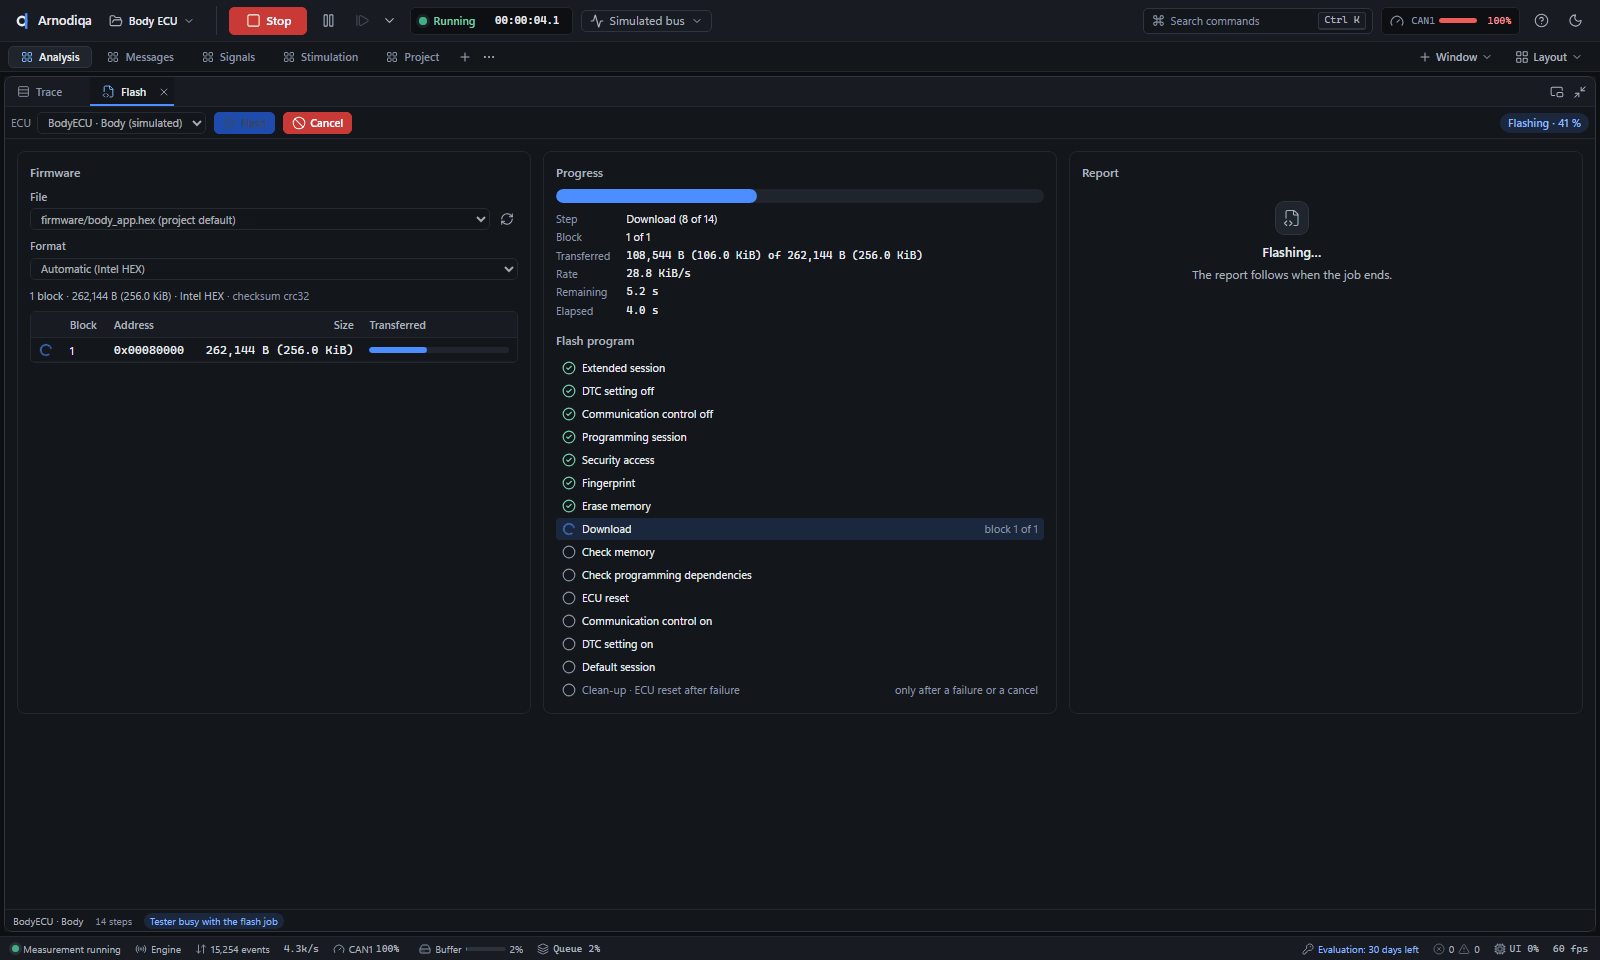
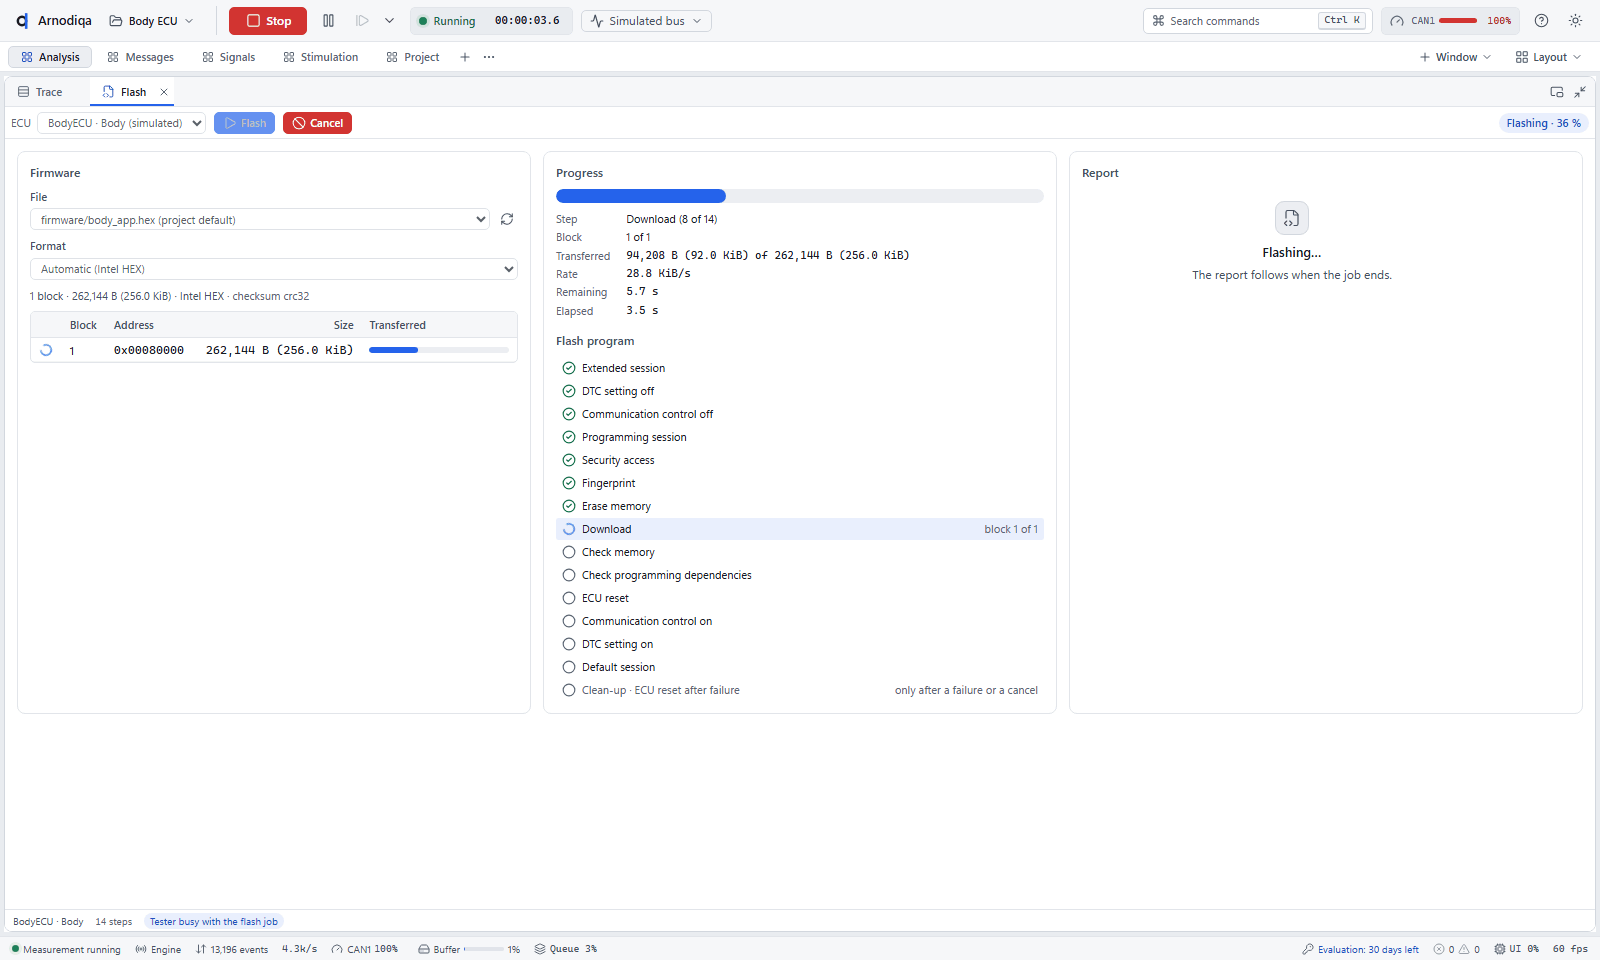
Flashing an ECU via UDS: firmware with blocks and checksum, progress per step and per block with transfer rate and remaining time.
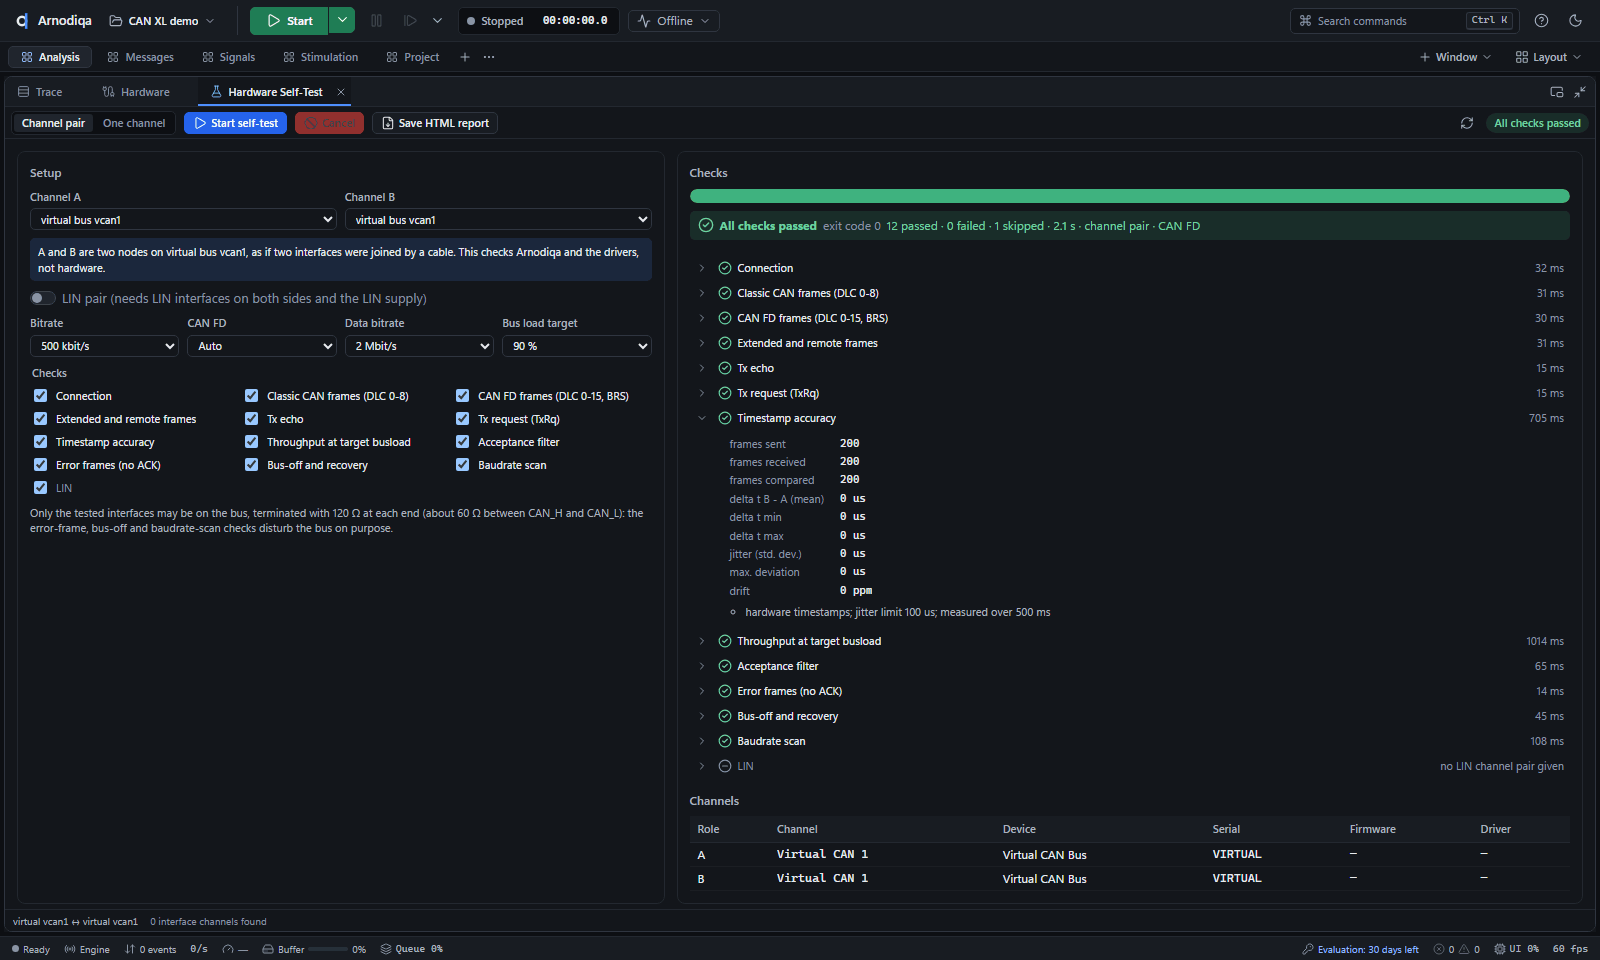
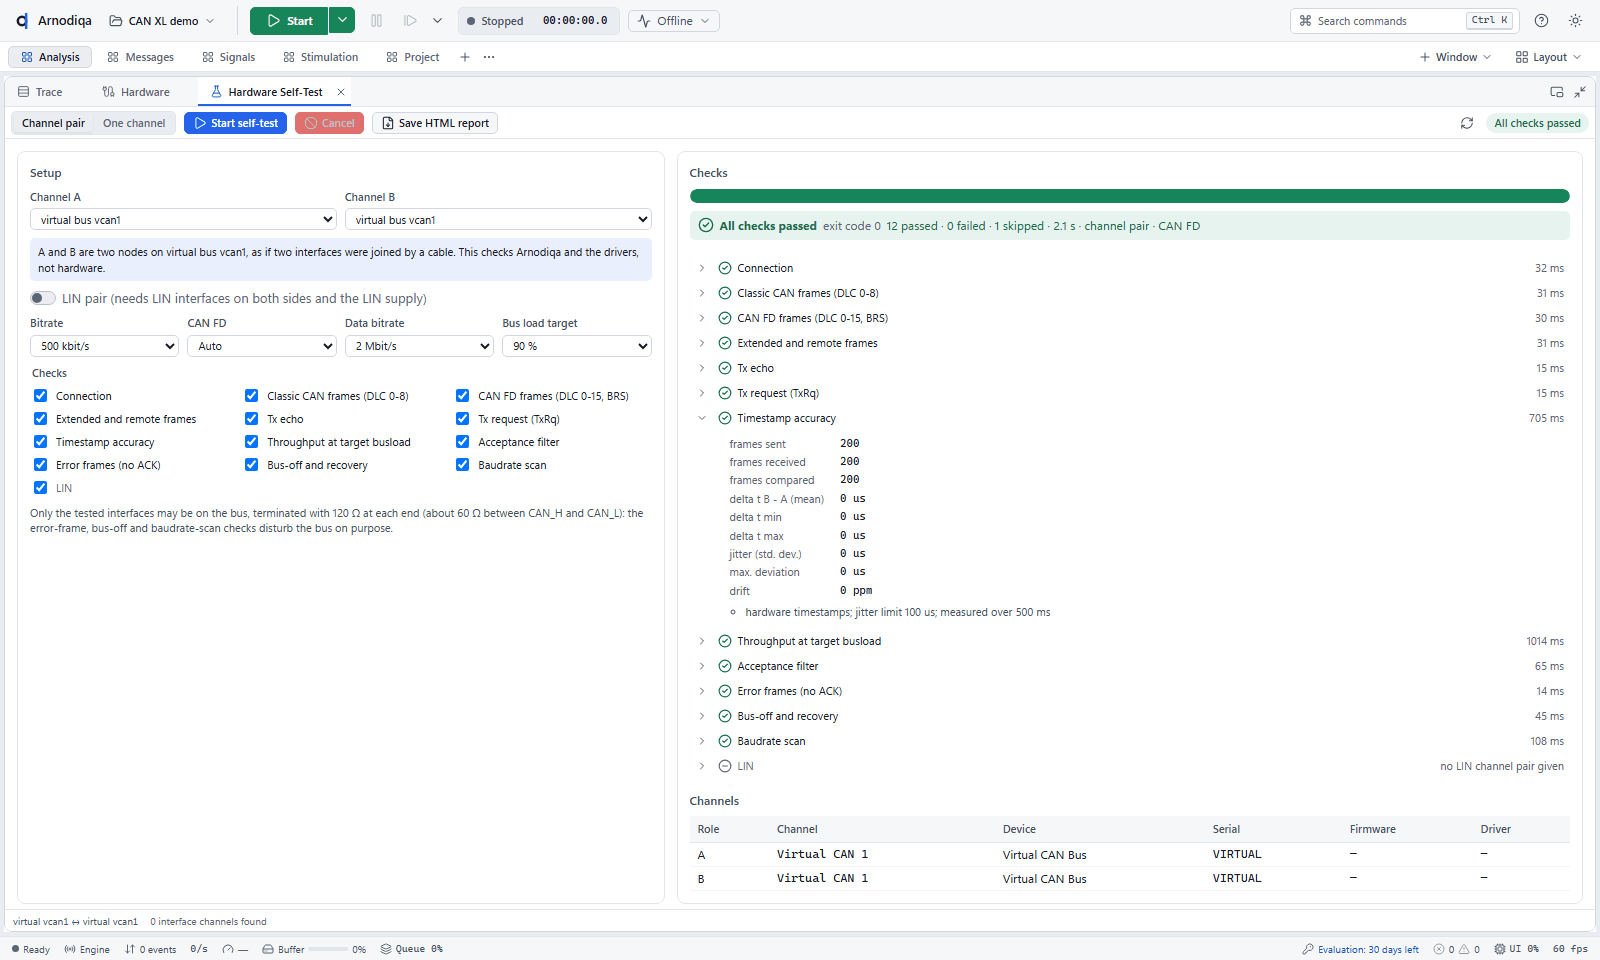
Self-test with a channel pair: settings and checks on the left; on the right, the result and duration of each check and the channels used. The report can be saved as HTML.
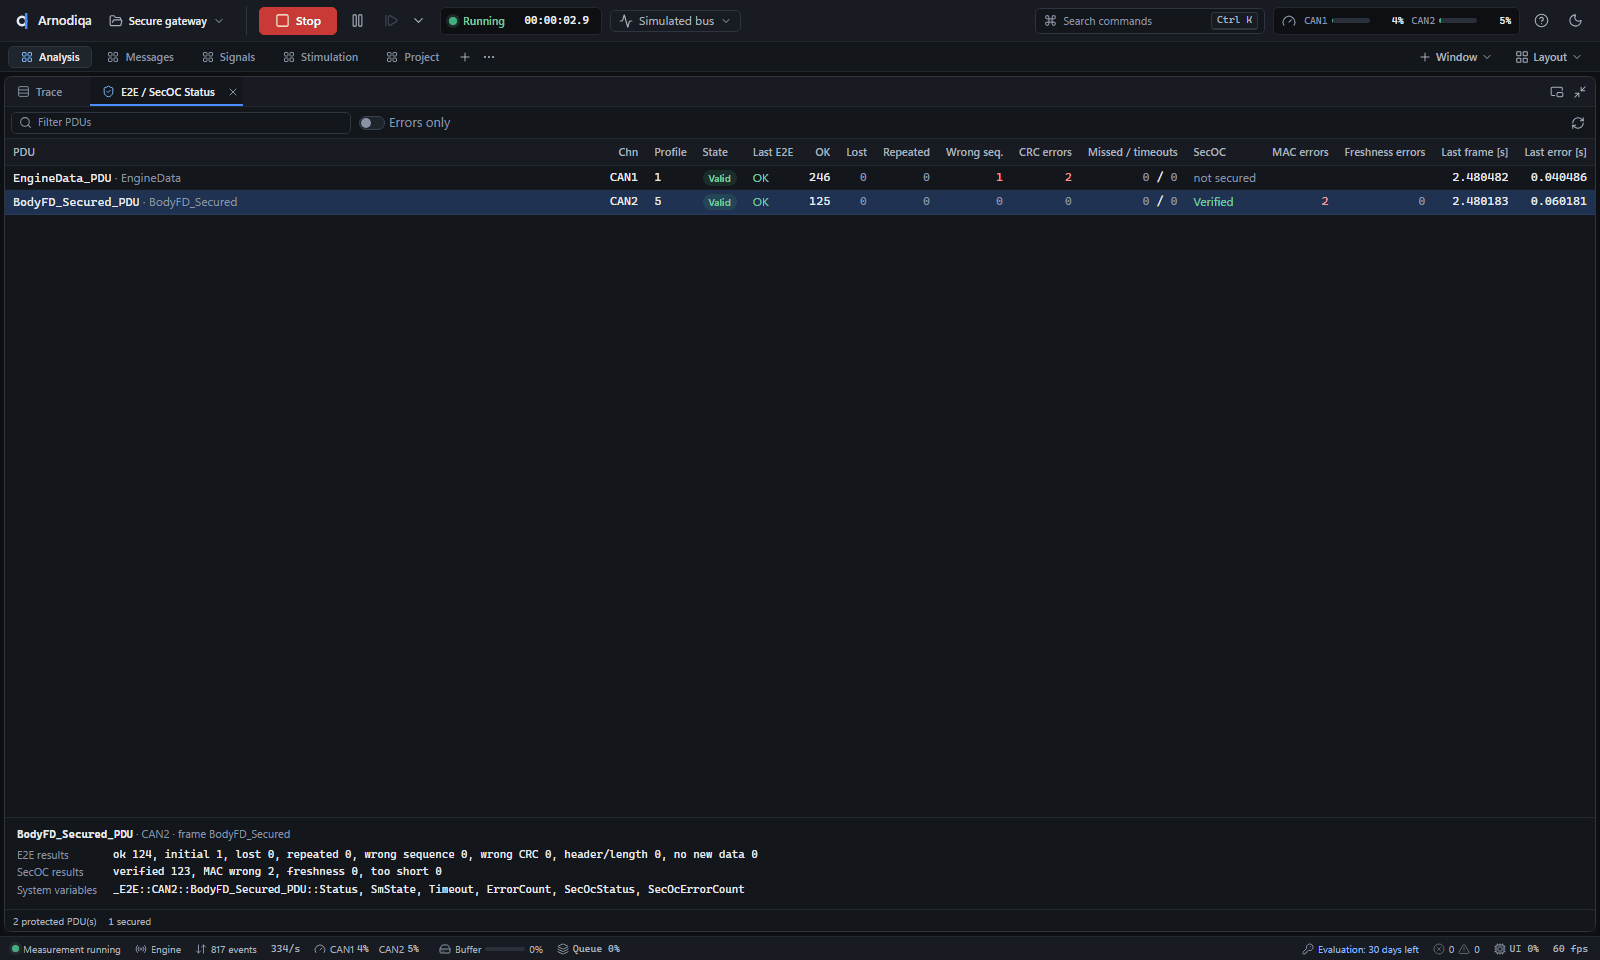
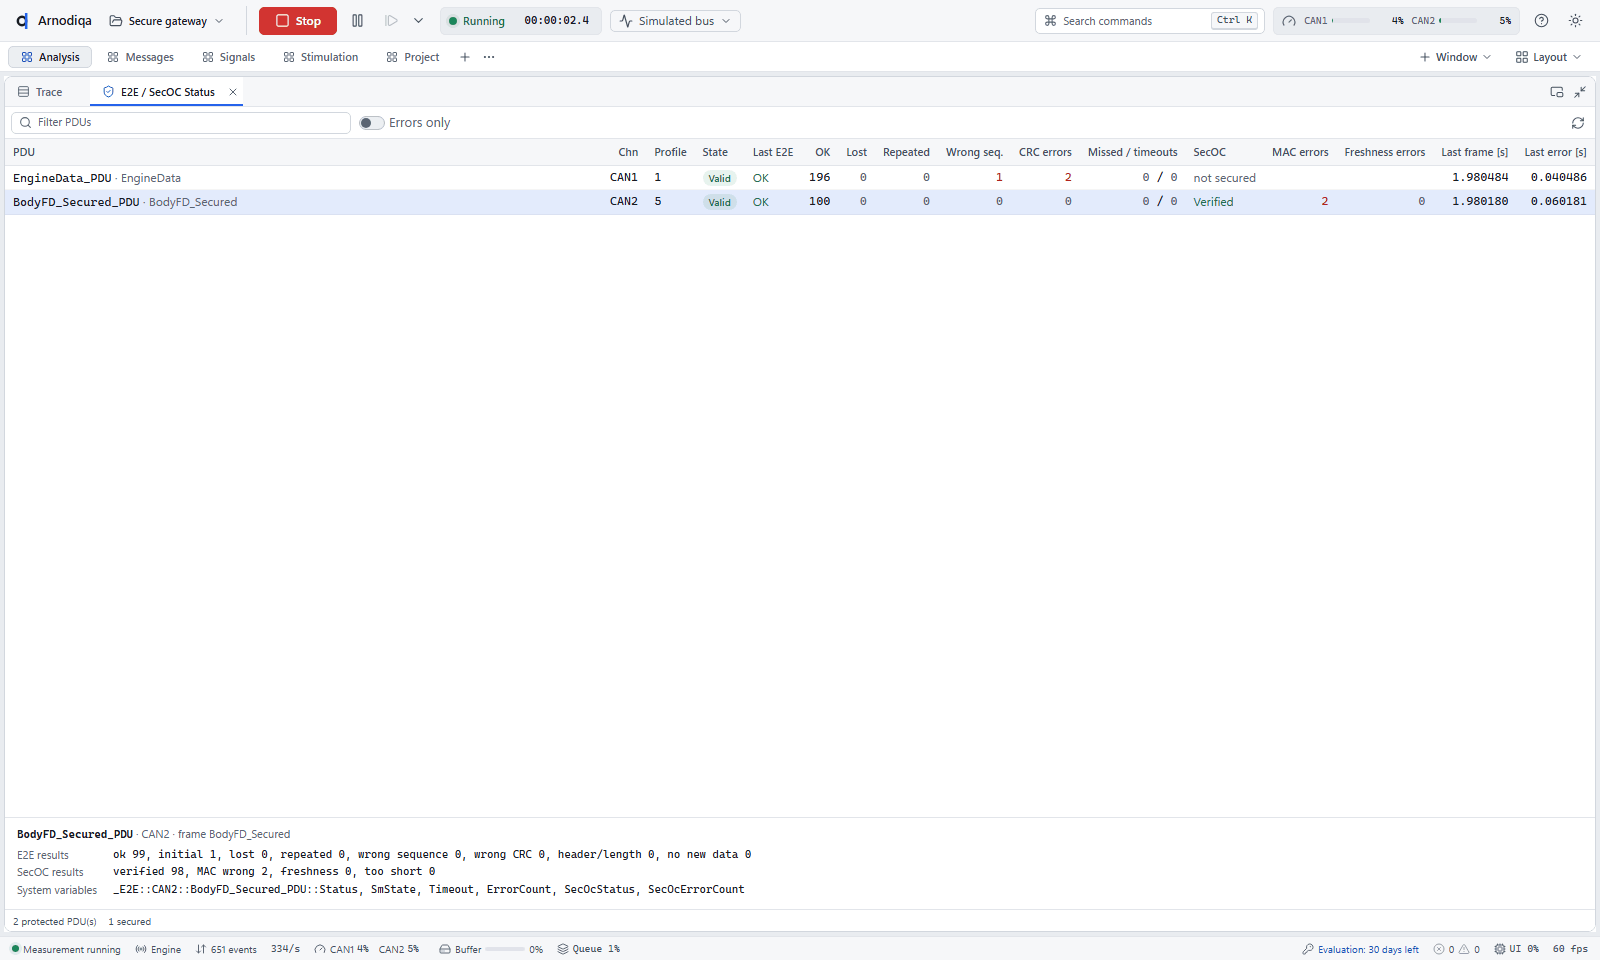
For each protected PDU: the E2E profile and state, counters for lost, repeated and faulty messages, and the SecOC verification.
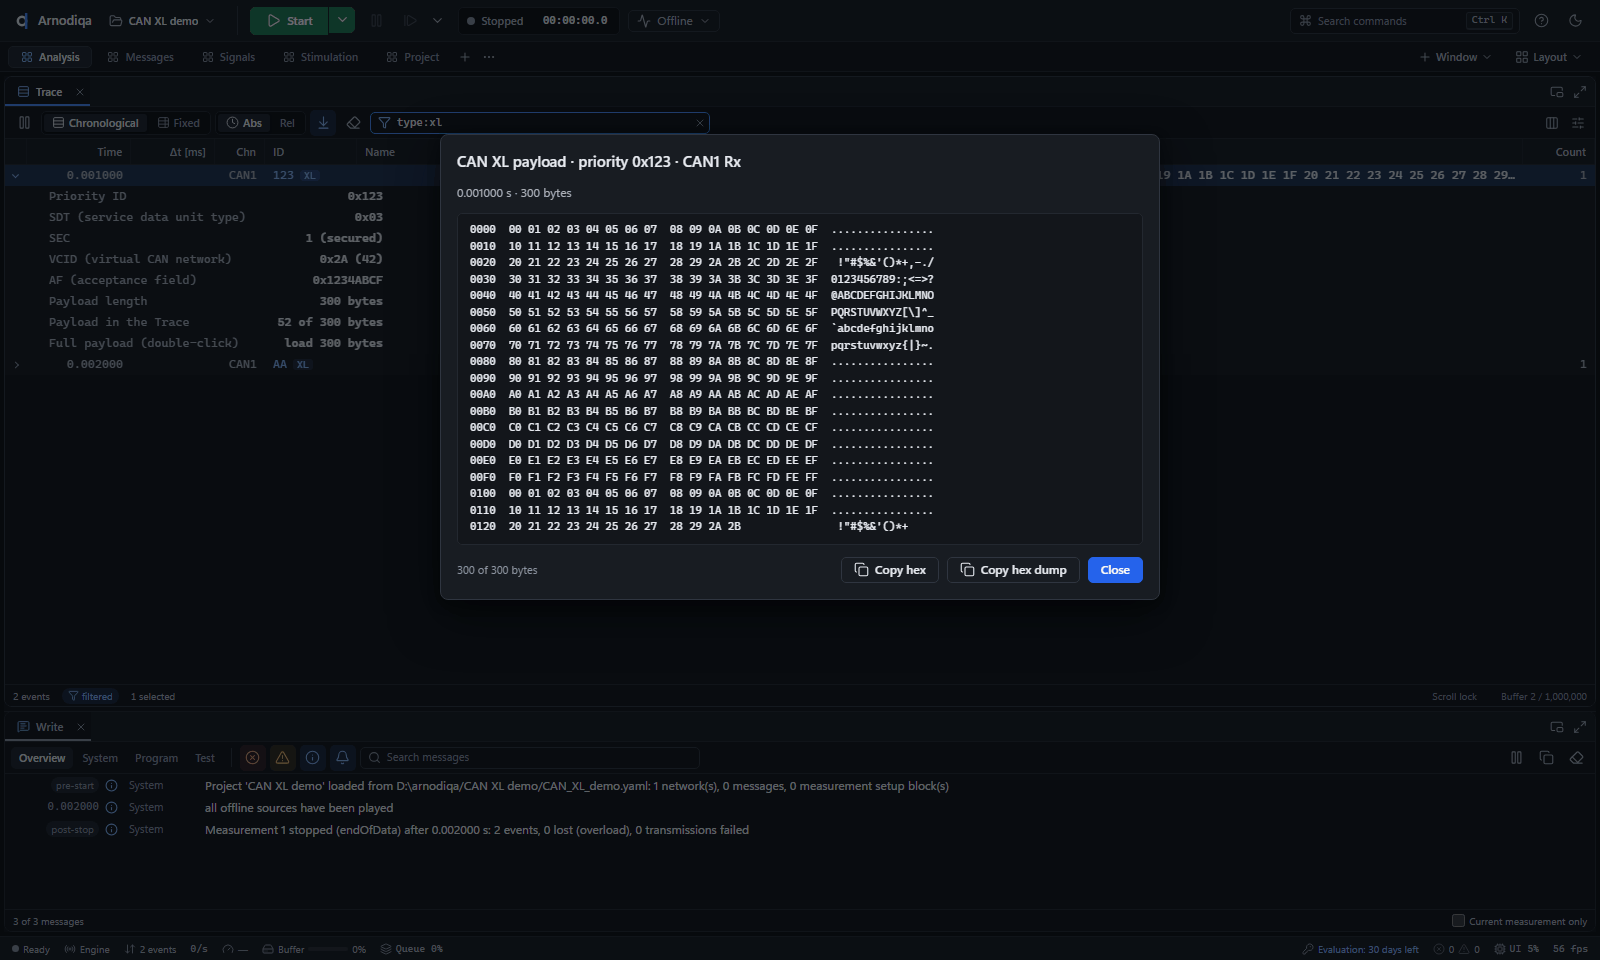
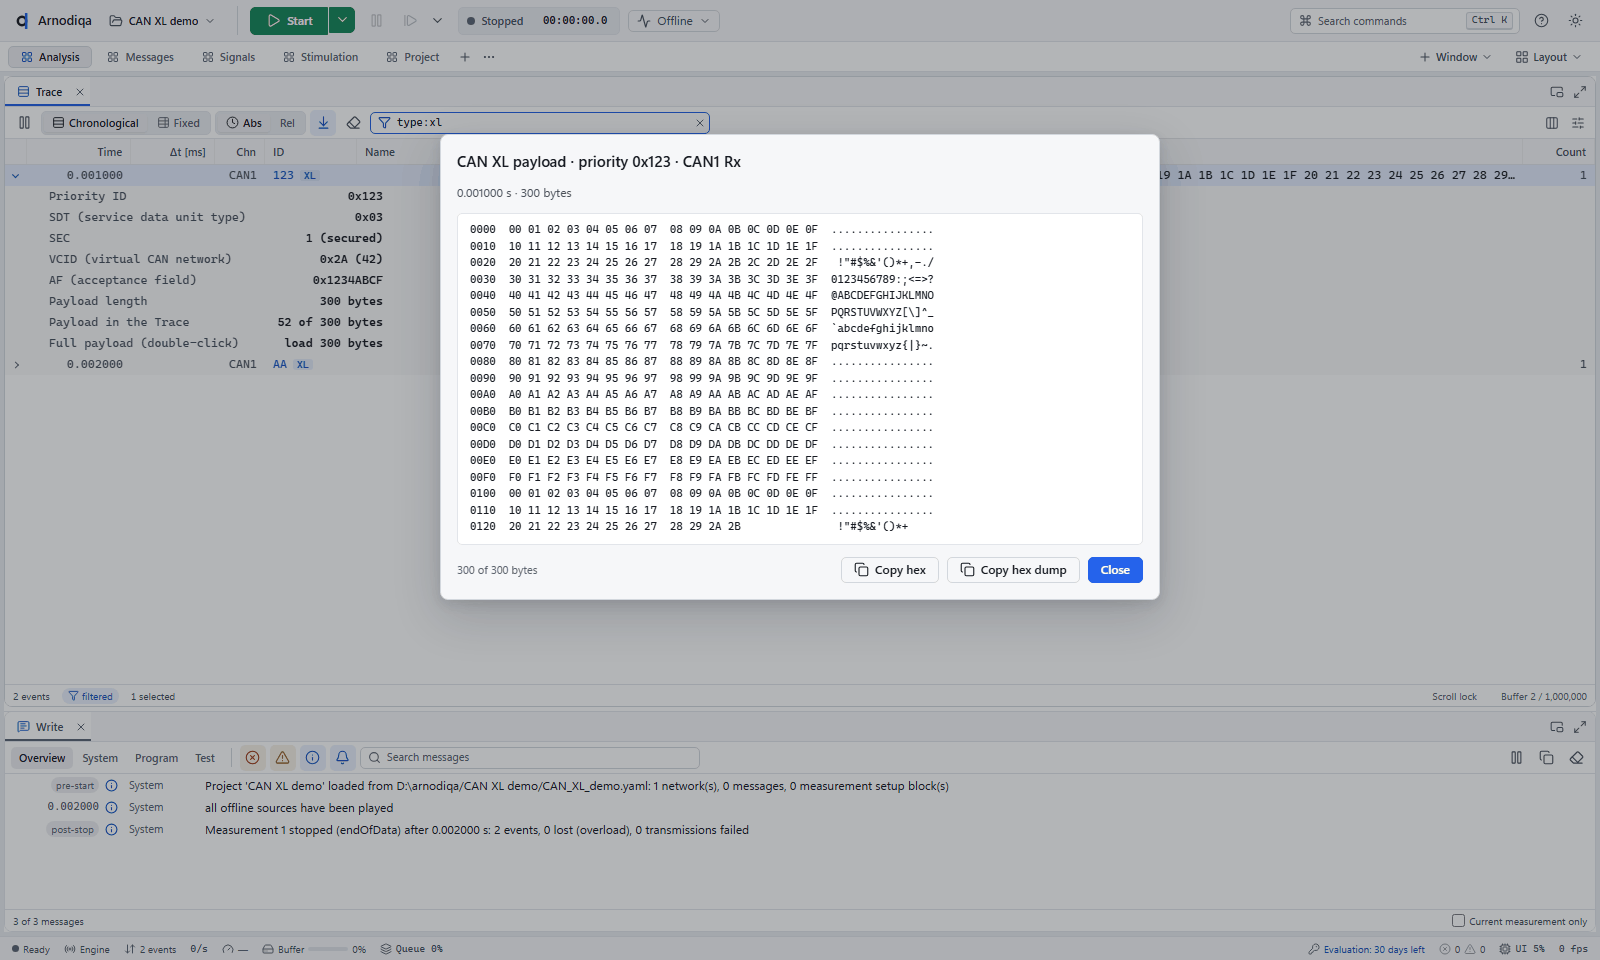
A CAN XL frame with priority ID, SDT, SEC, VCID and acceptance field; the full 300-byte payload in the hex view.
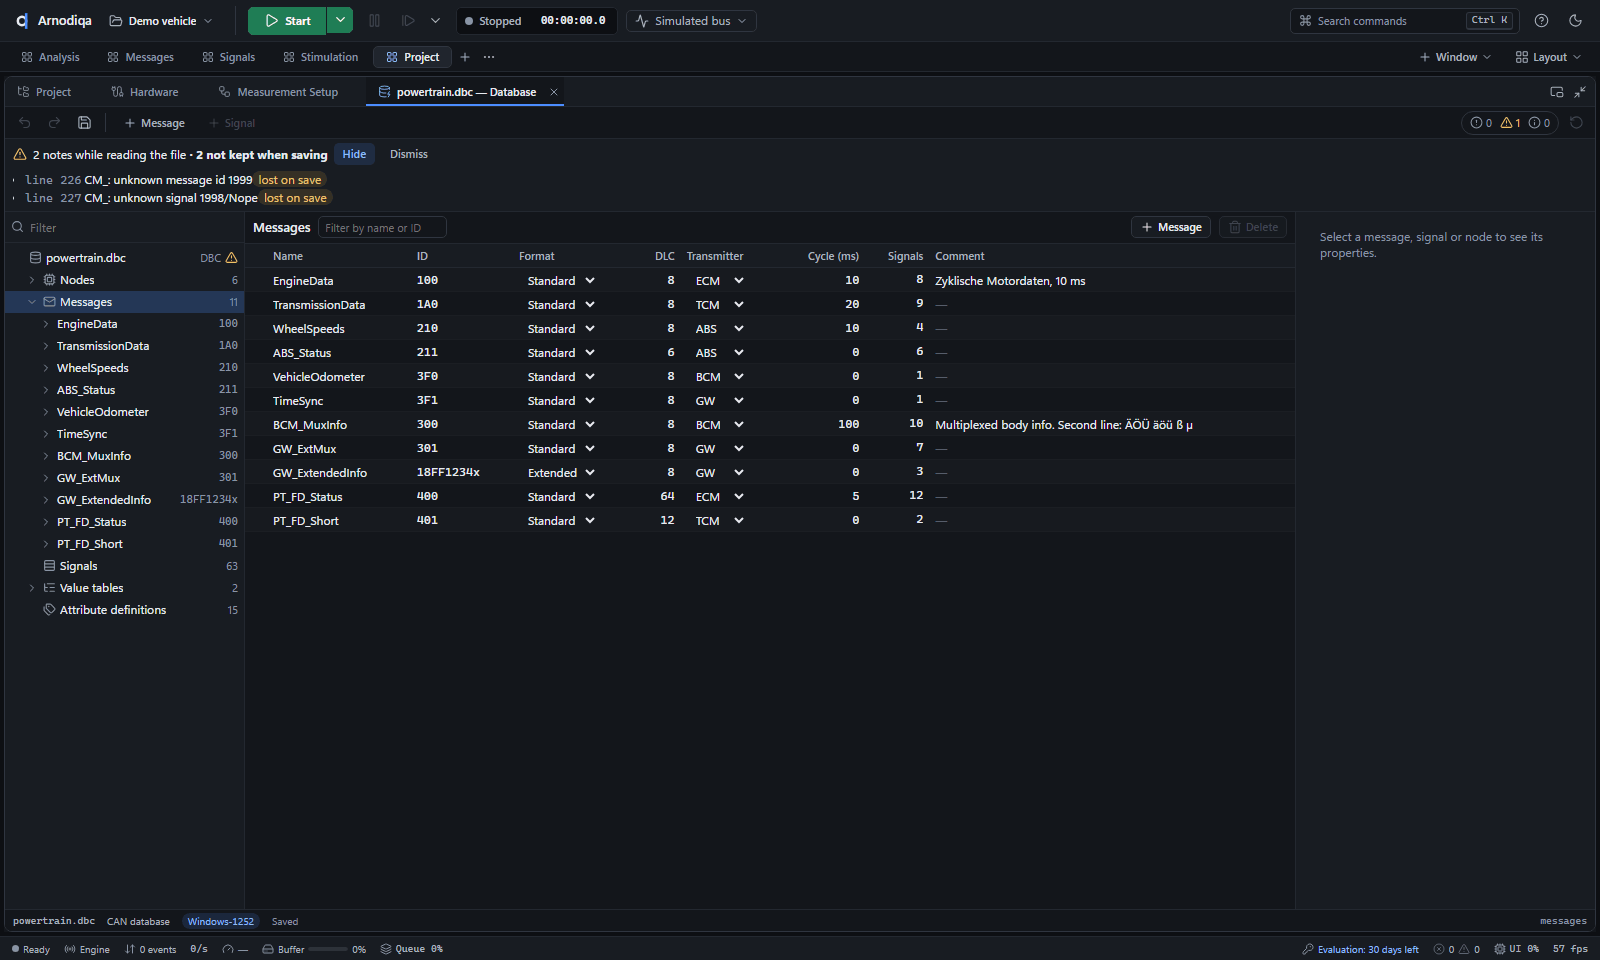
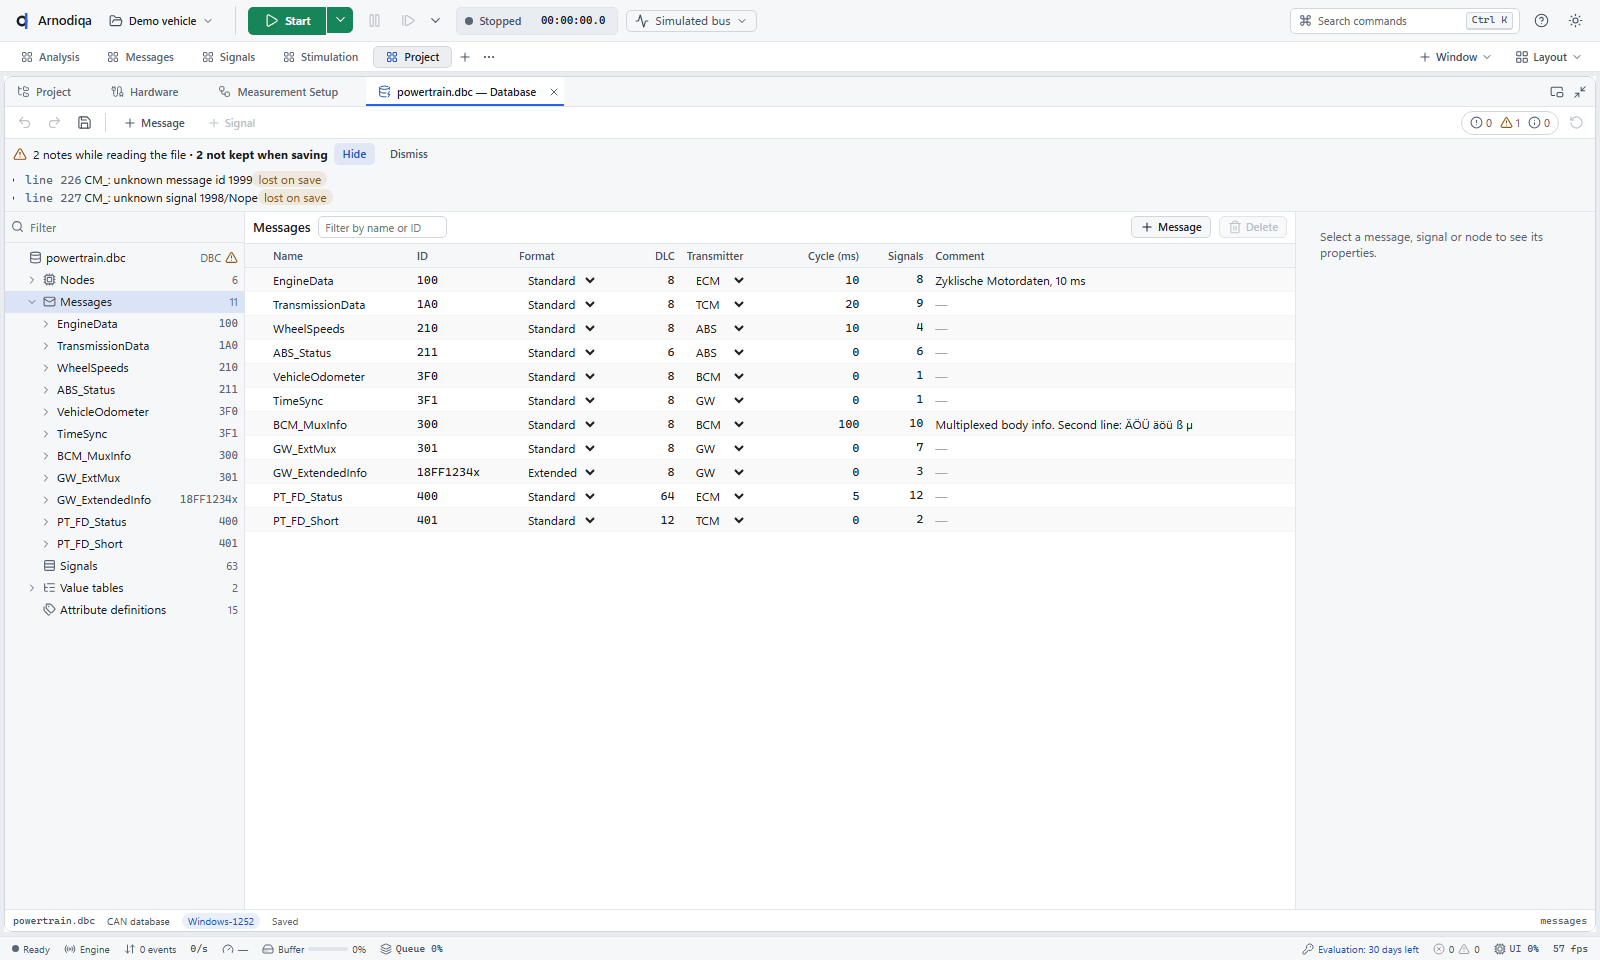
On opening, the editor reports which parts of a DBC it cannot keep, and asks for confirmation with the full list before saving.
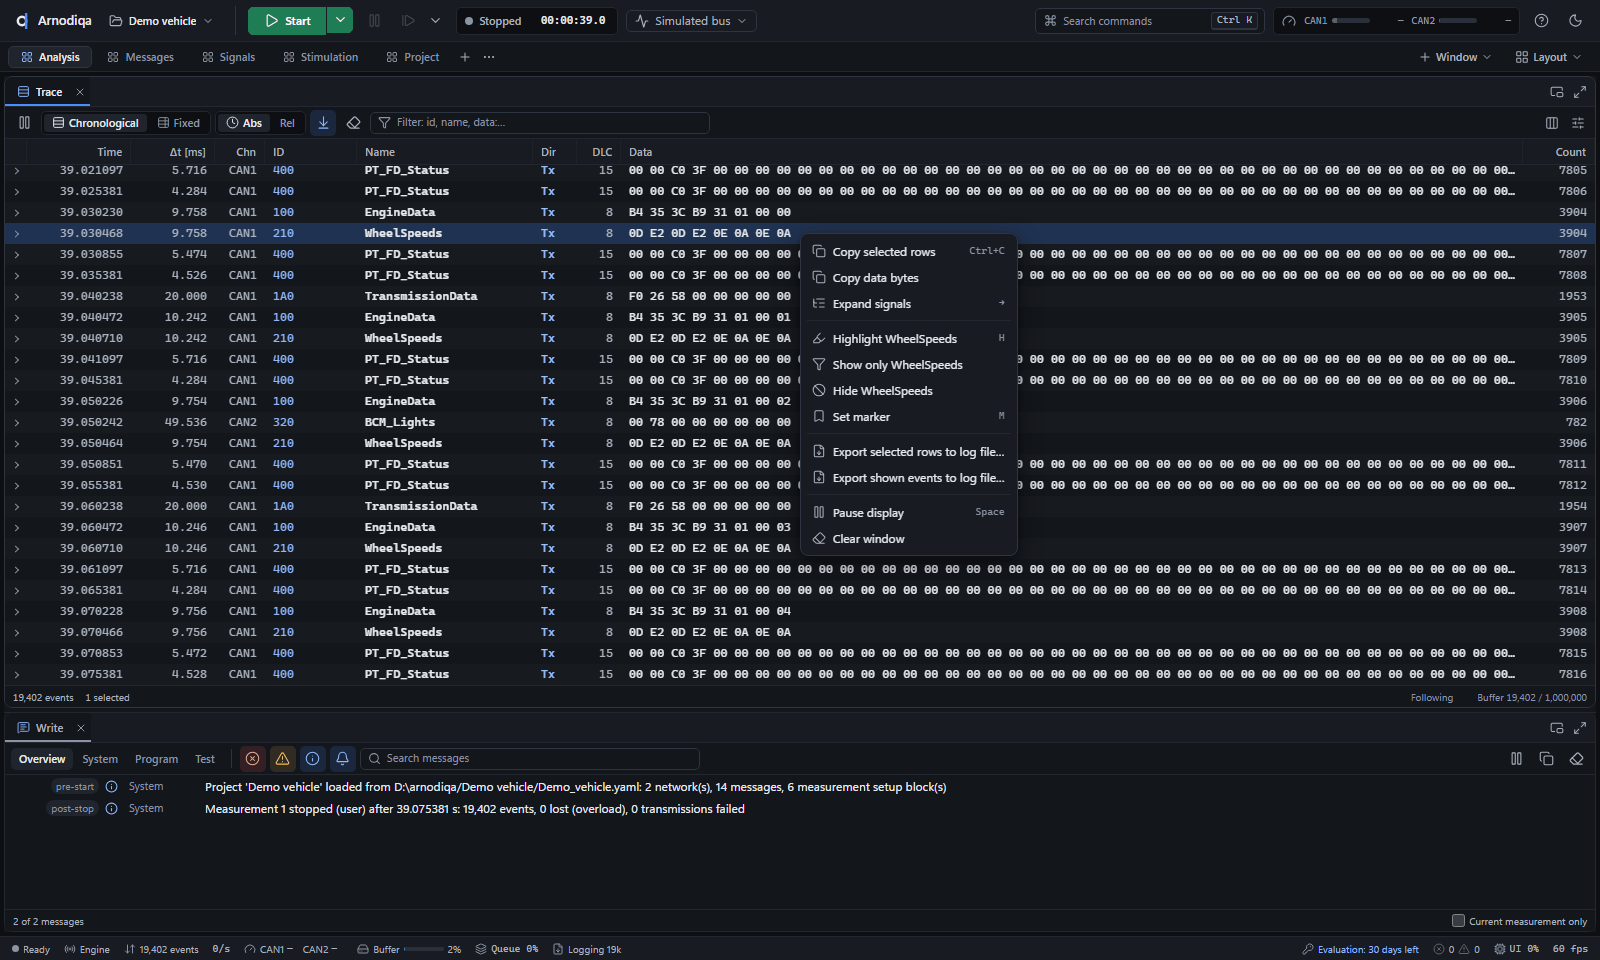
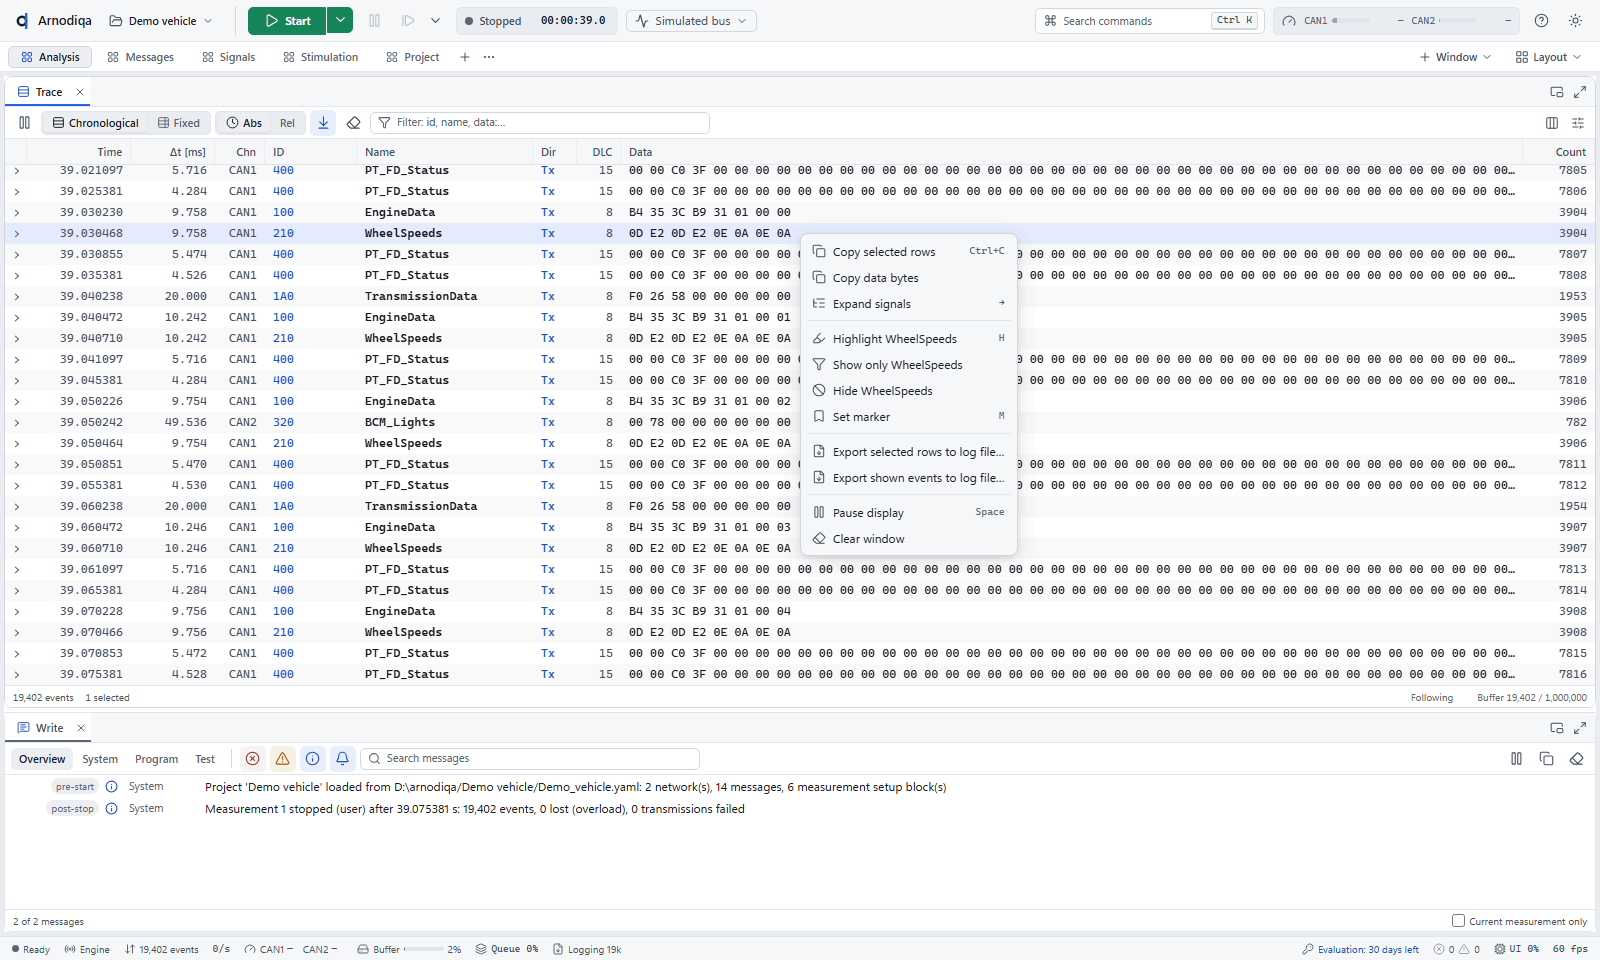
Trace context menu with copy, highlight, filter and export of the selected or shown rows to a log file (BLF, ASC, MF4, PCAPNG).
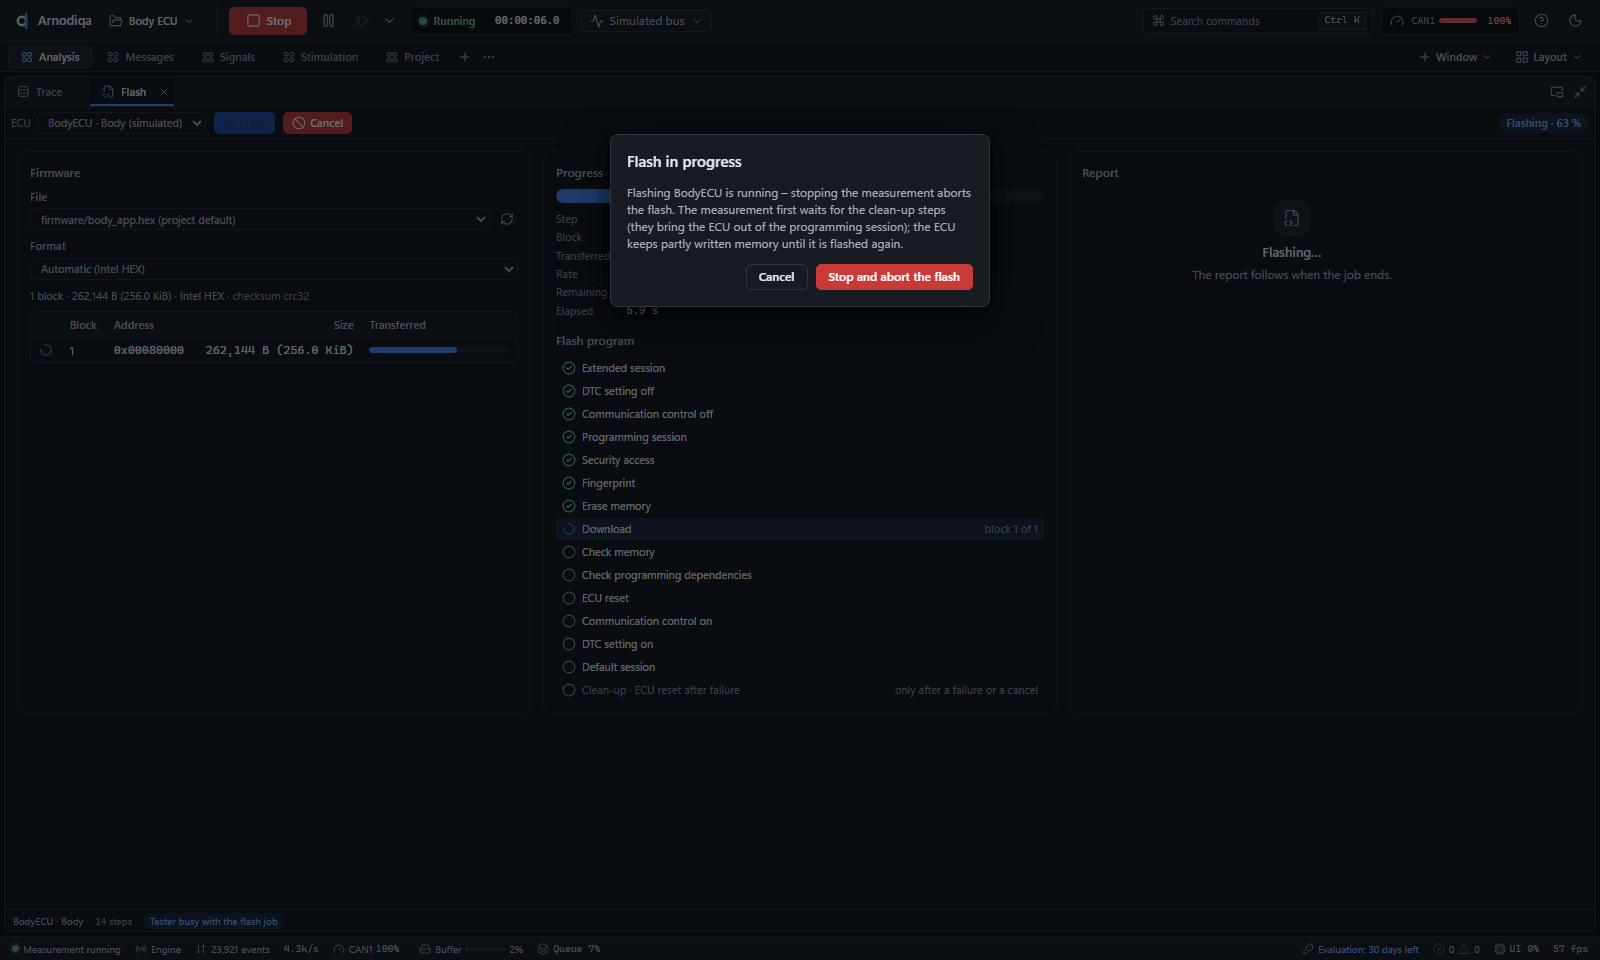
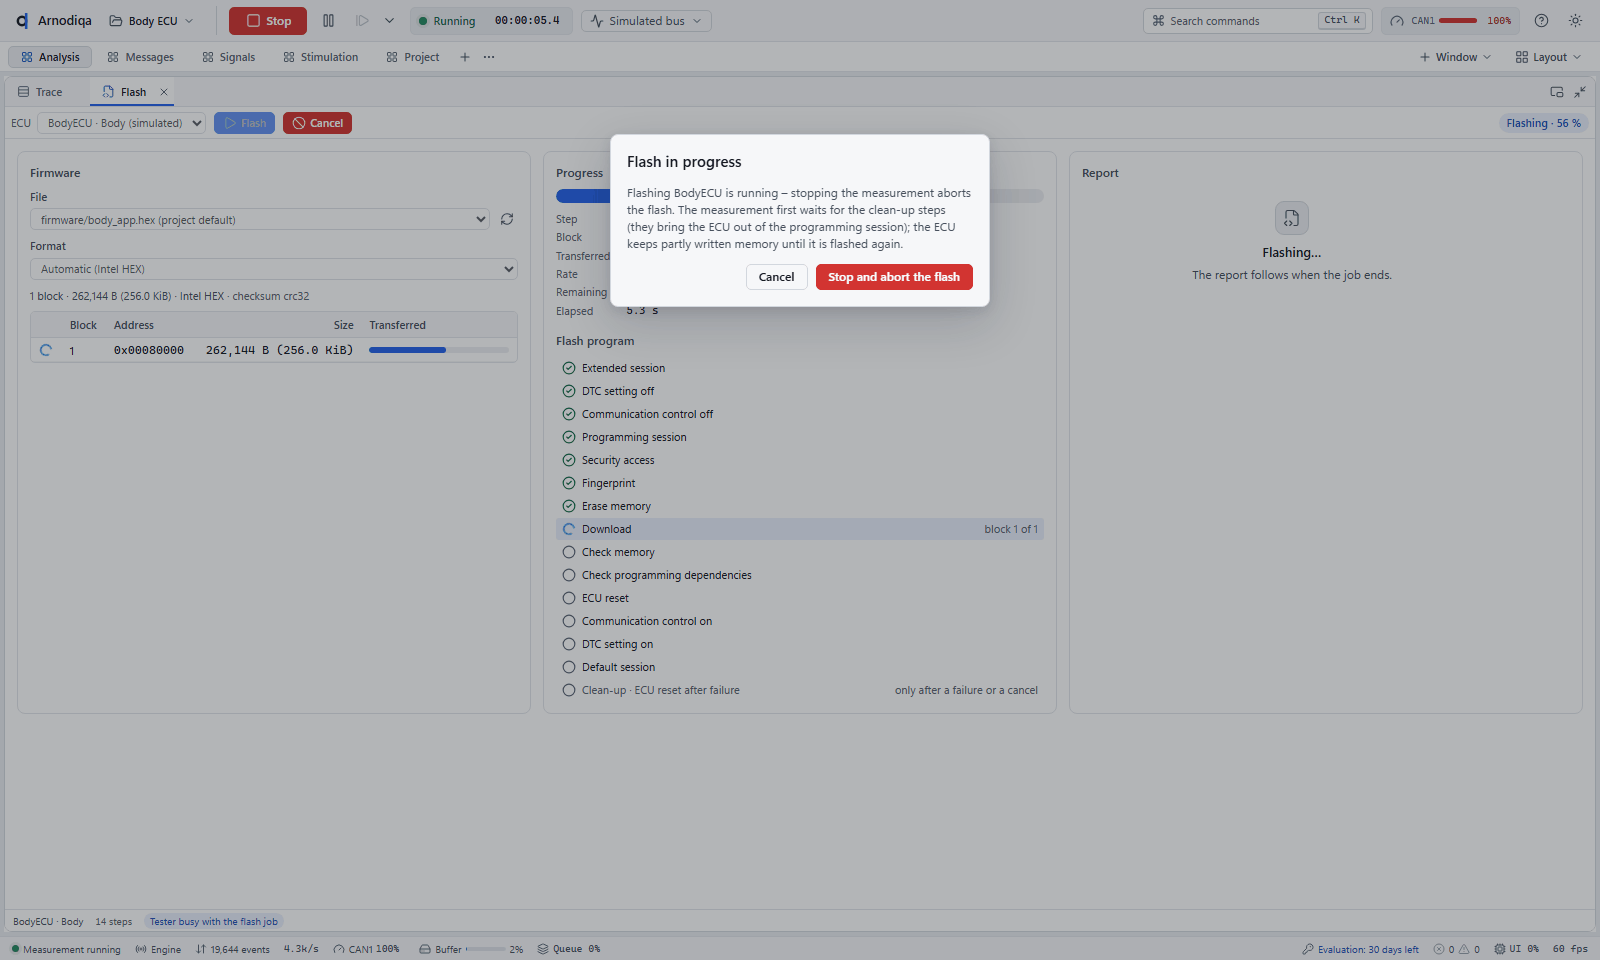
If you stop the measurement during flashing, the application first explains the consequences for the ECU and only then lets you choose.
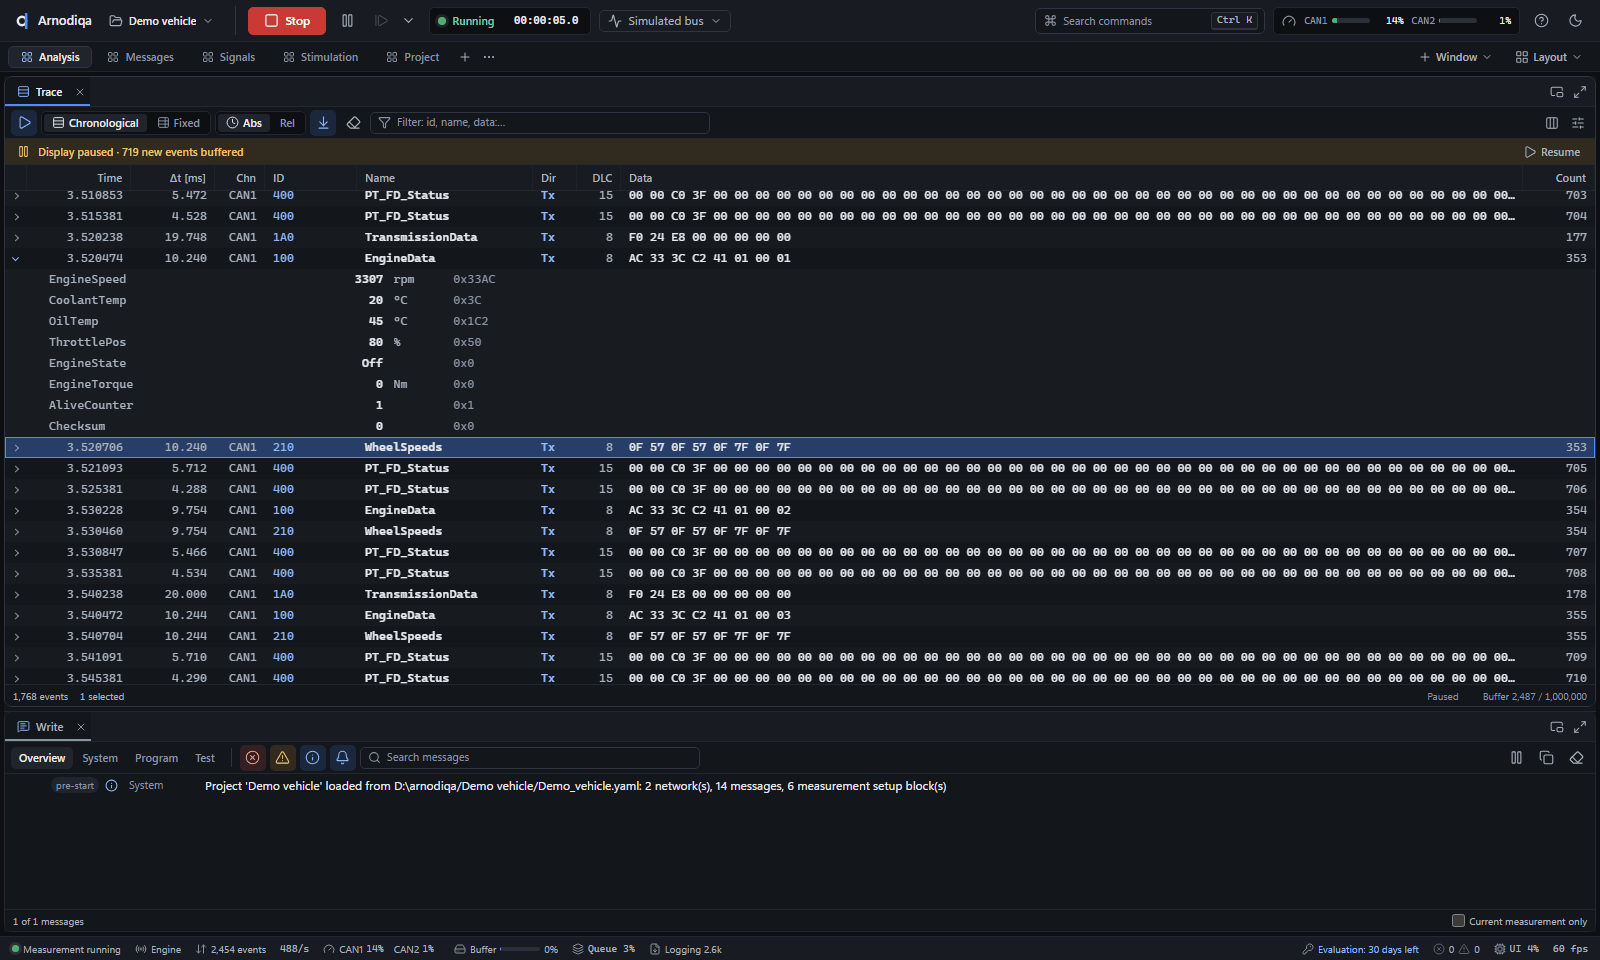
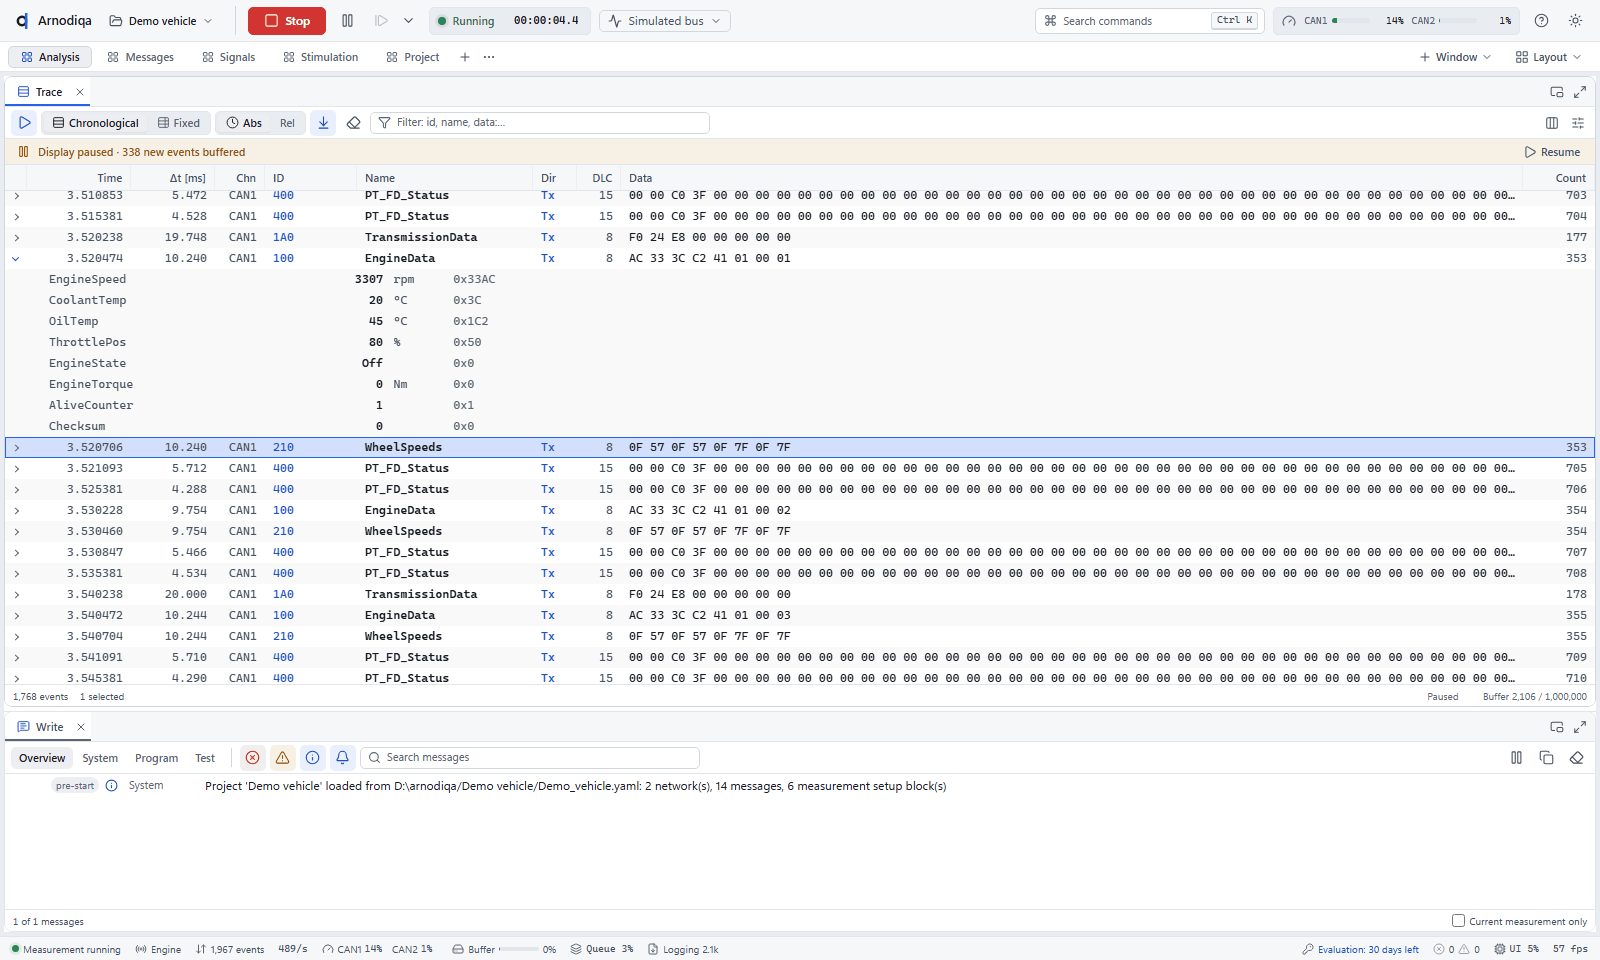
Chronological Trace with expanded signal values, a highlighted message and a selection.
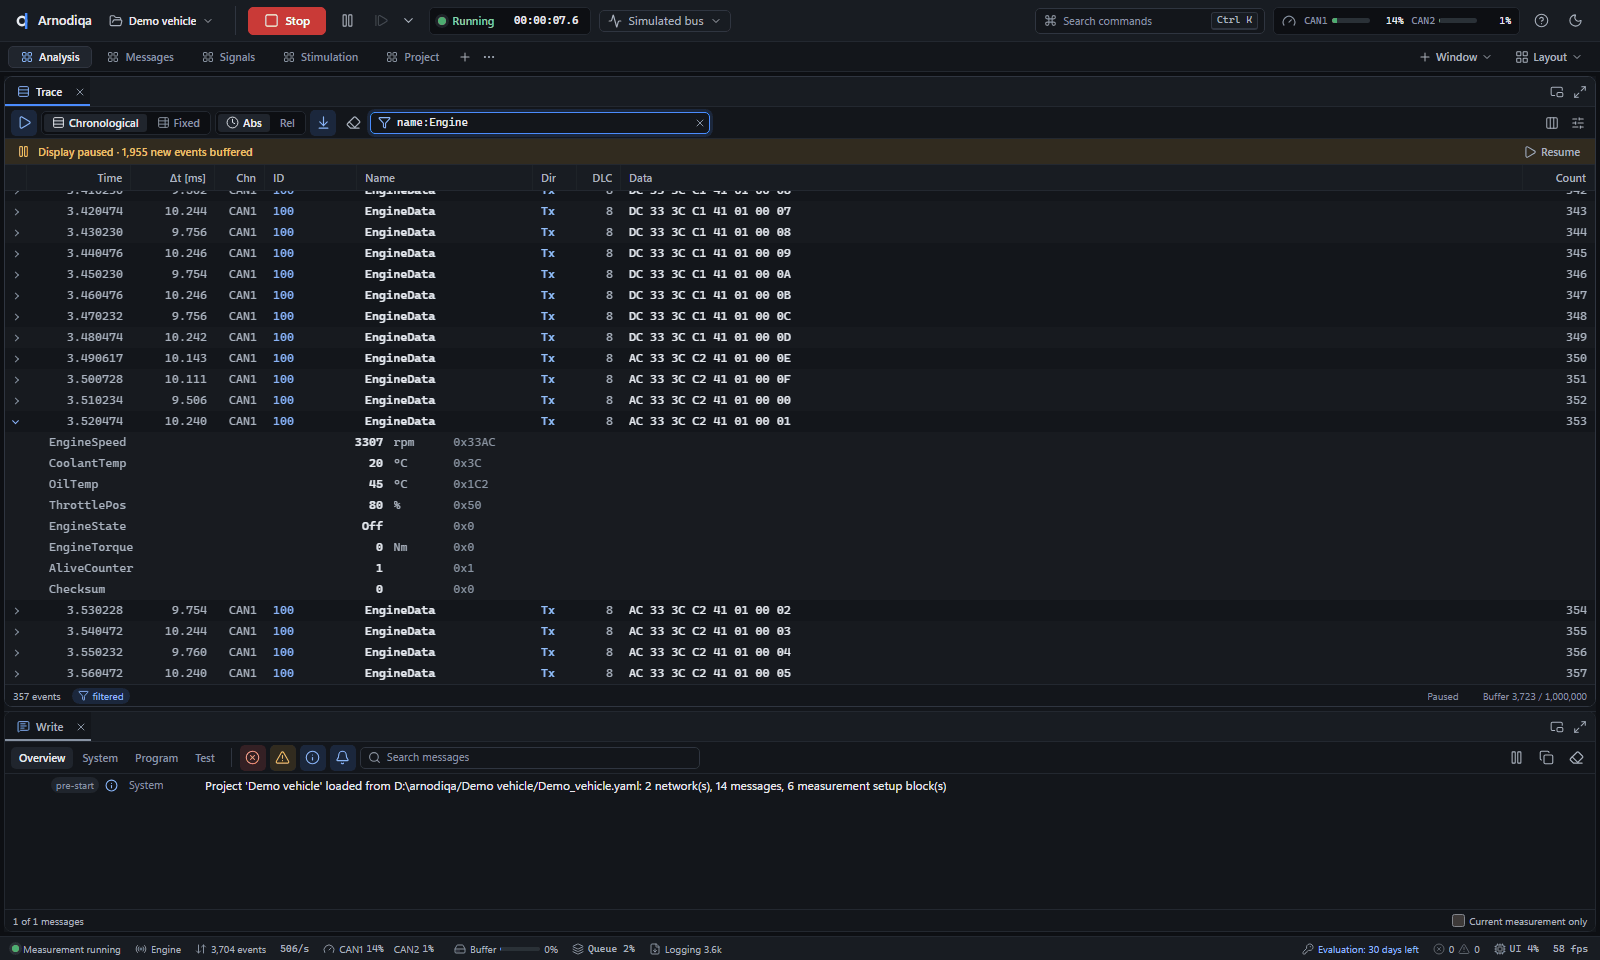
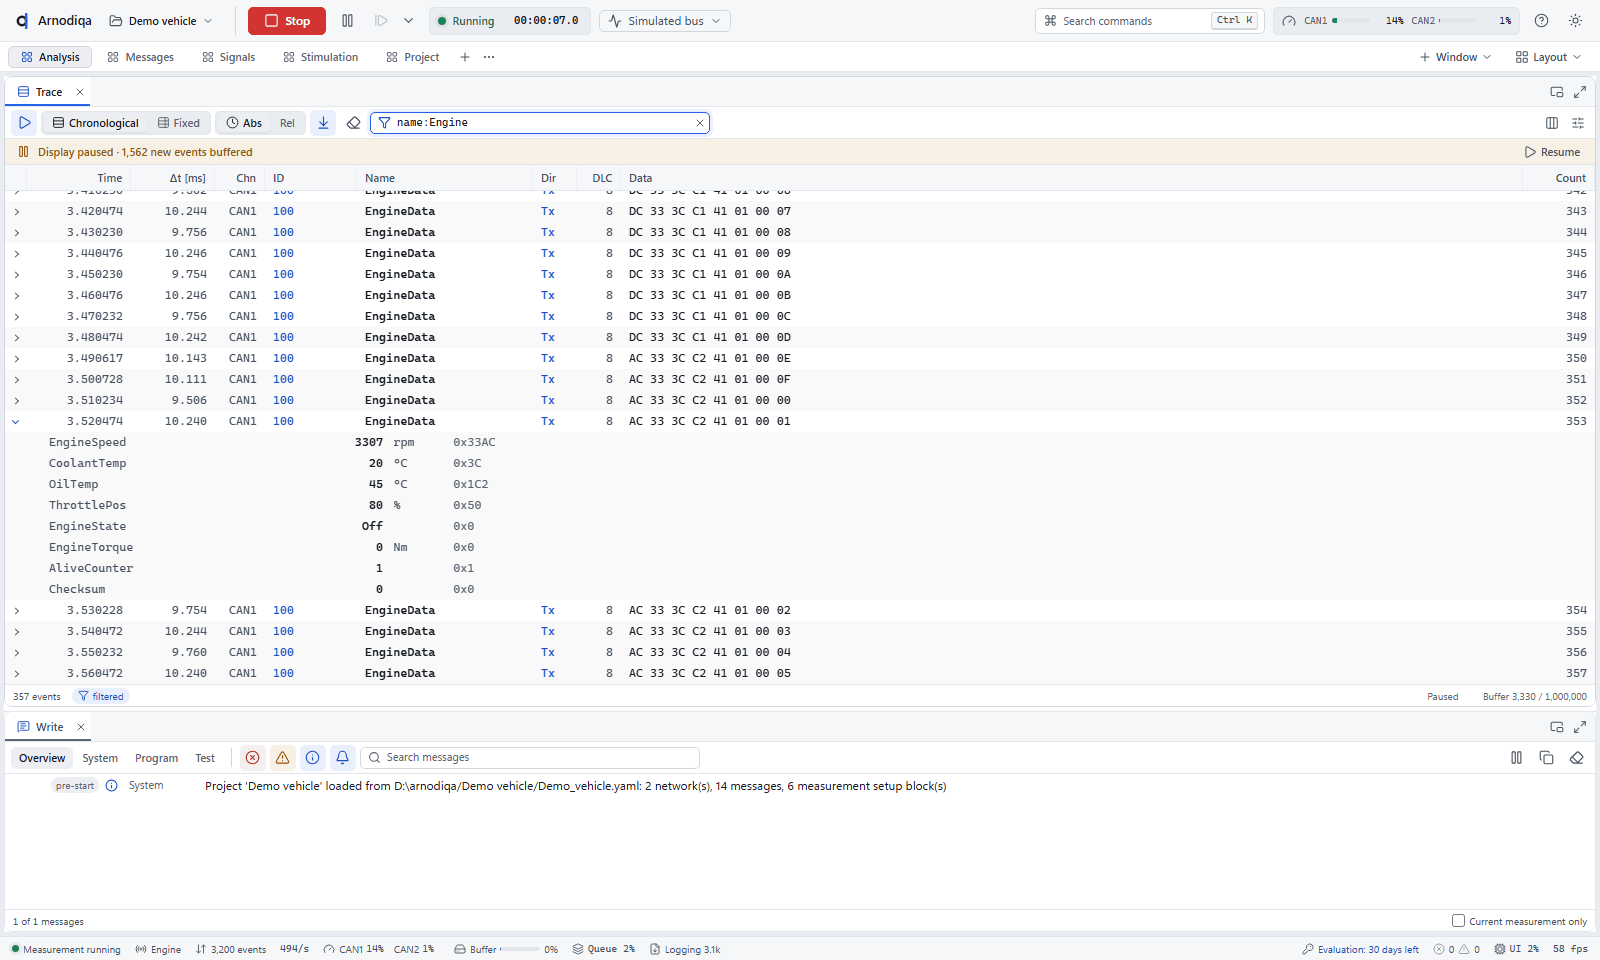
Quick filter
ch:1 name:Engine: only EngineData/EngineStatus, with decoded signals (rpm, Nm, °C, counter, CRC).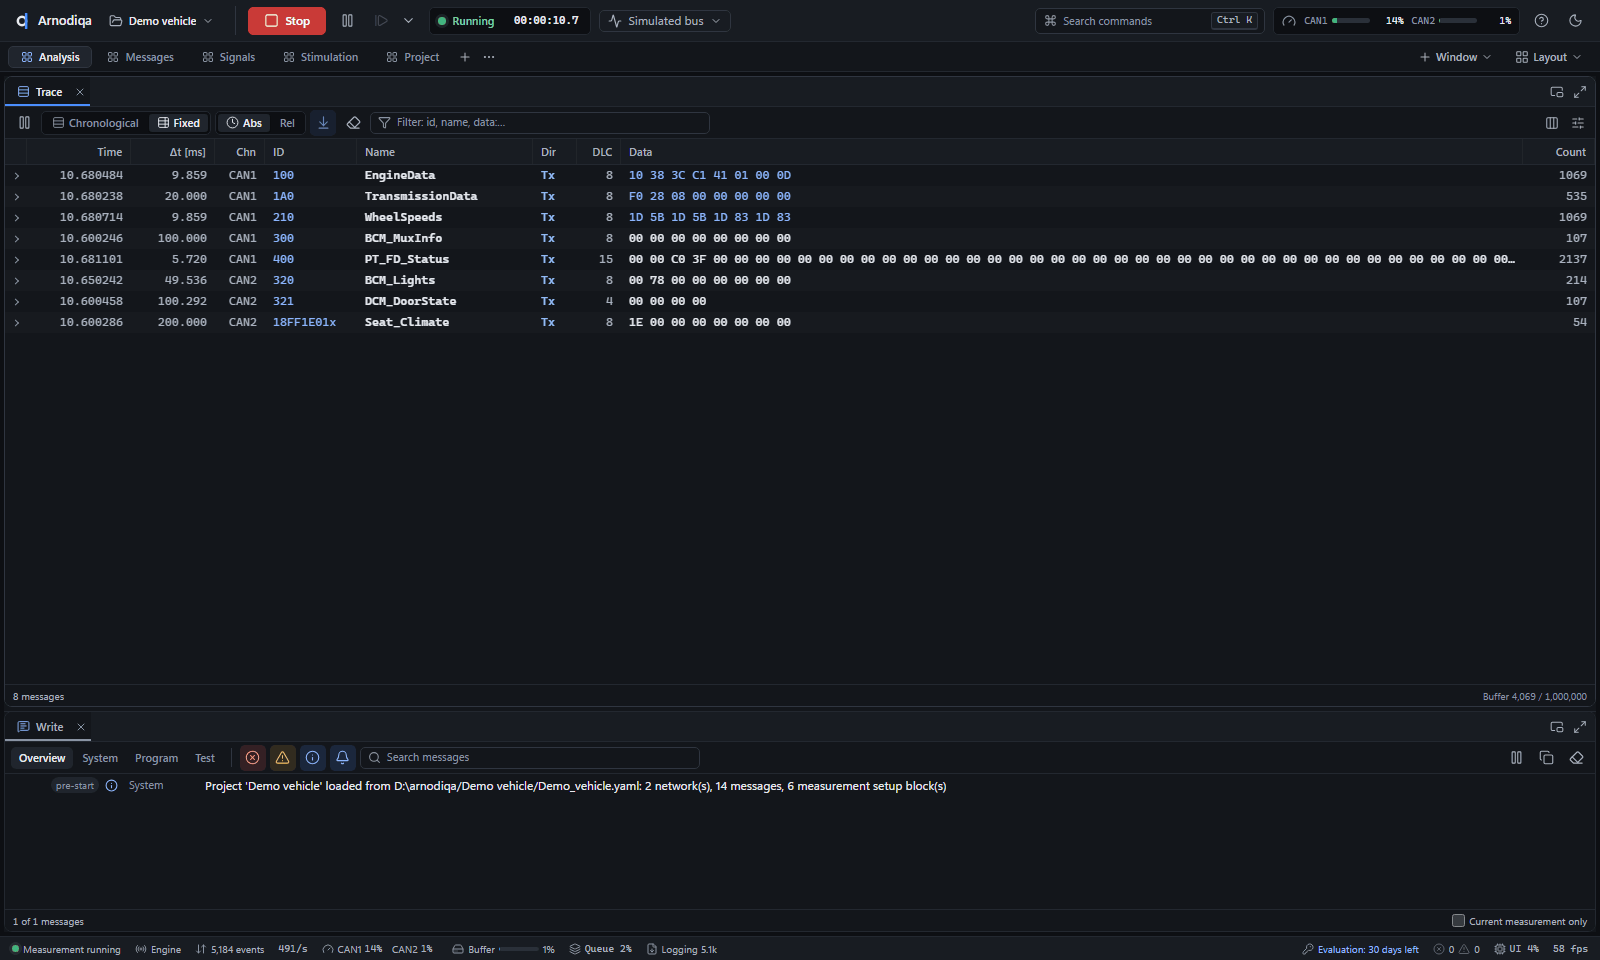
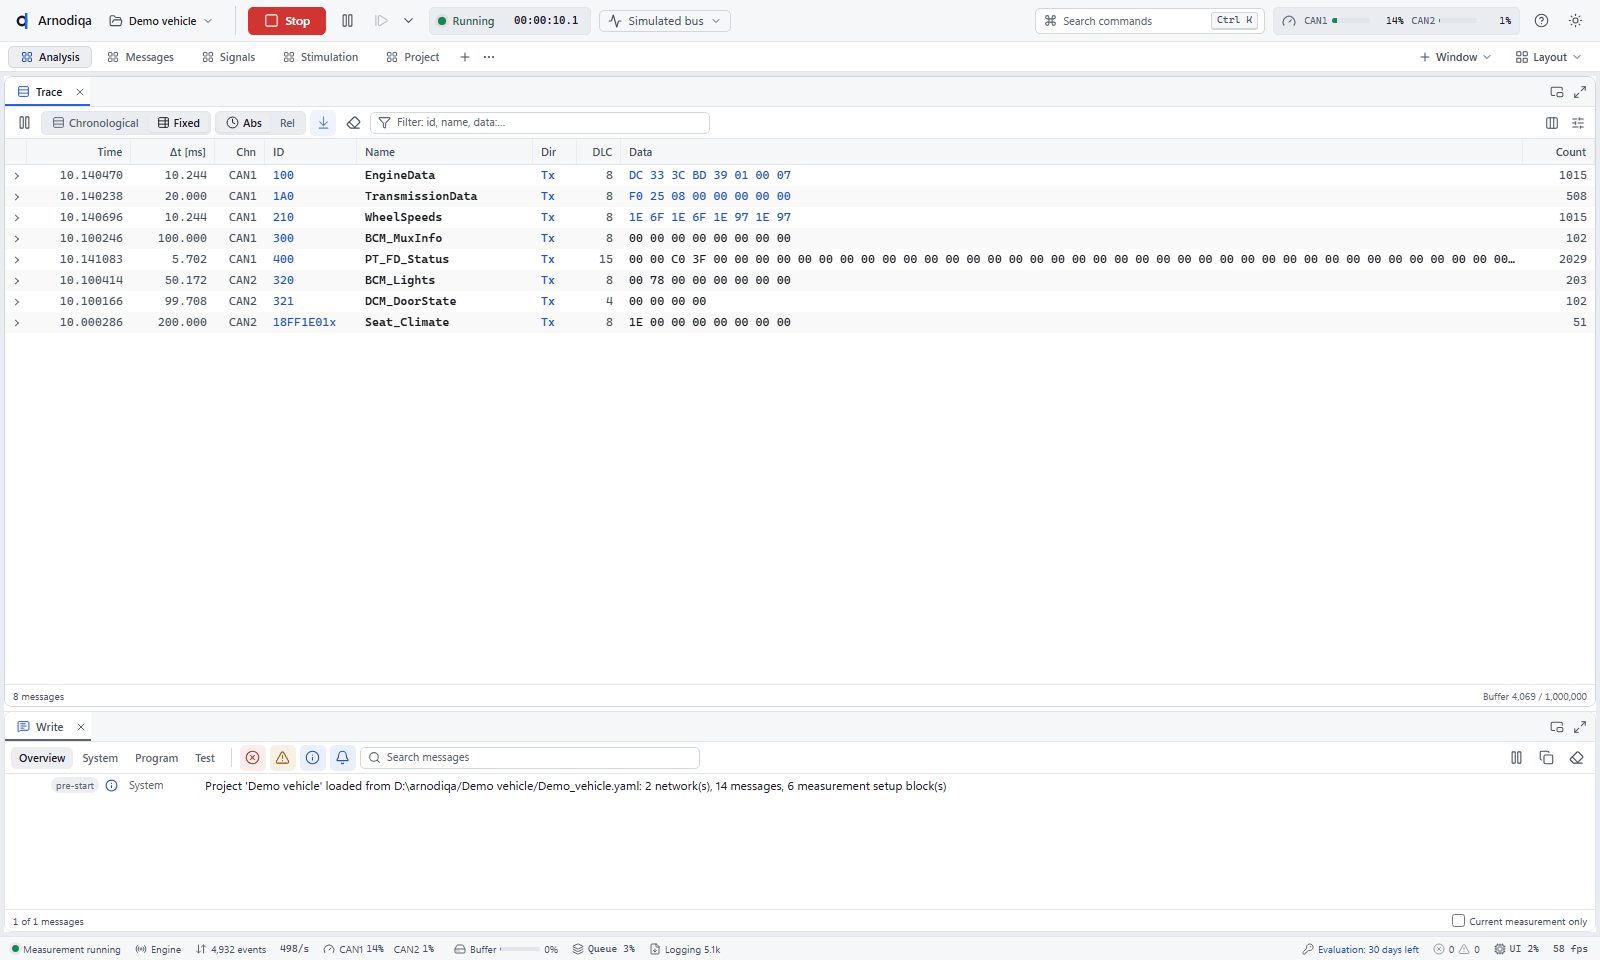
Trace in fixed-position mode (one row per ID) next to a second Trace.
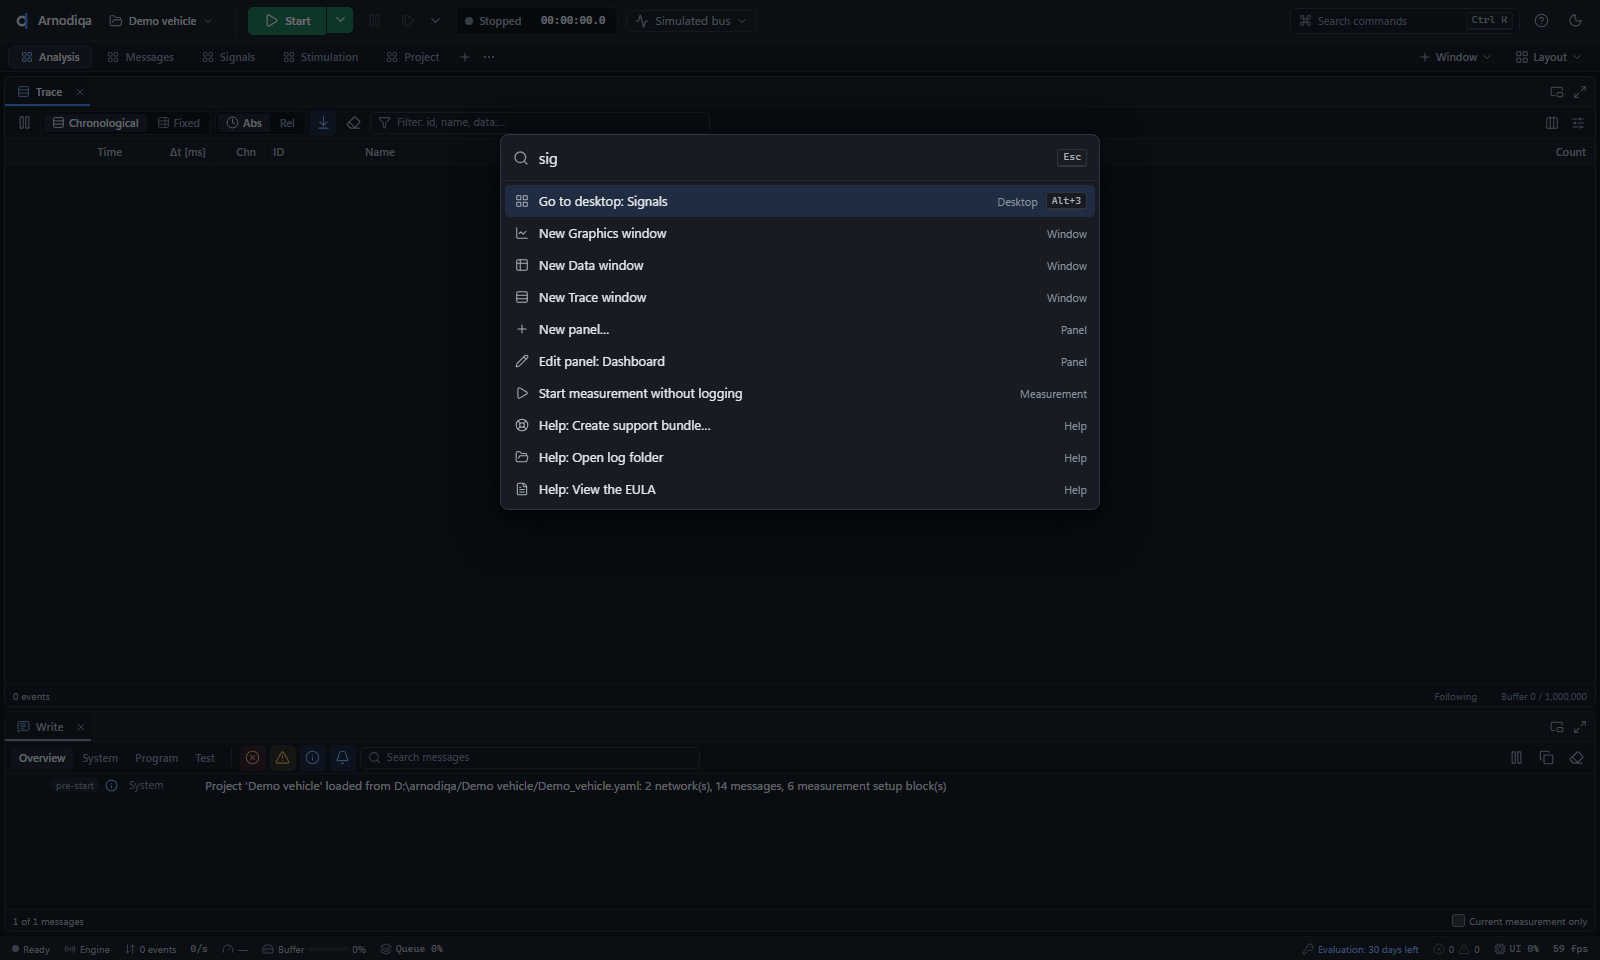
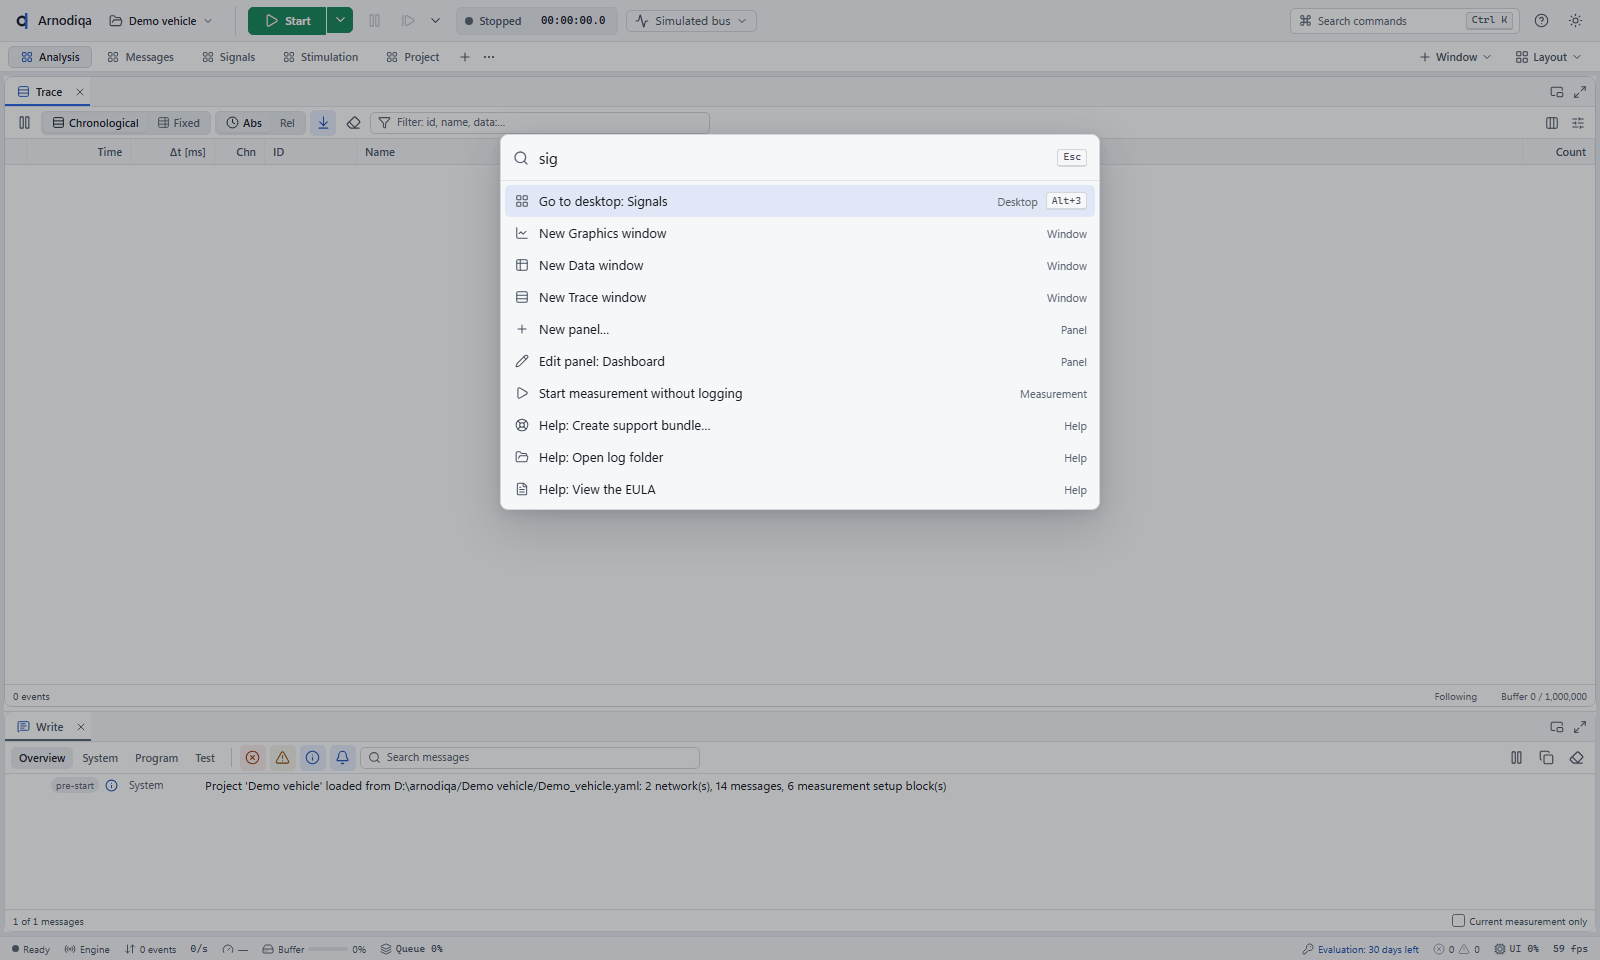
Command palette (Ctrl+K) with fuzzy search over all commands.
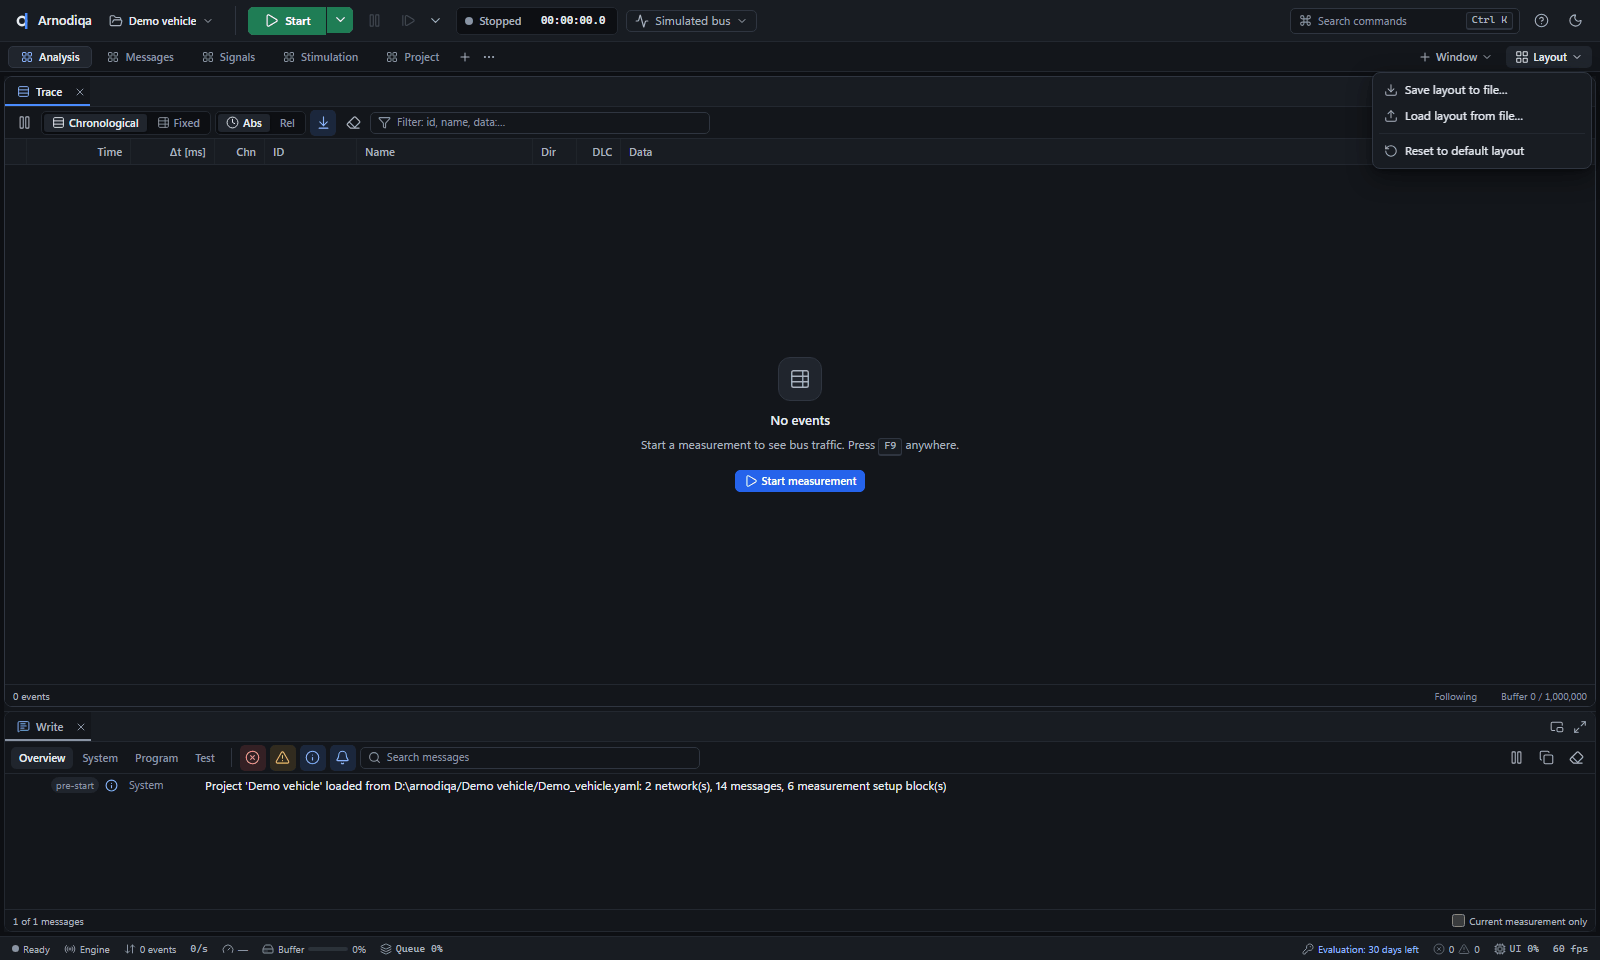
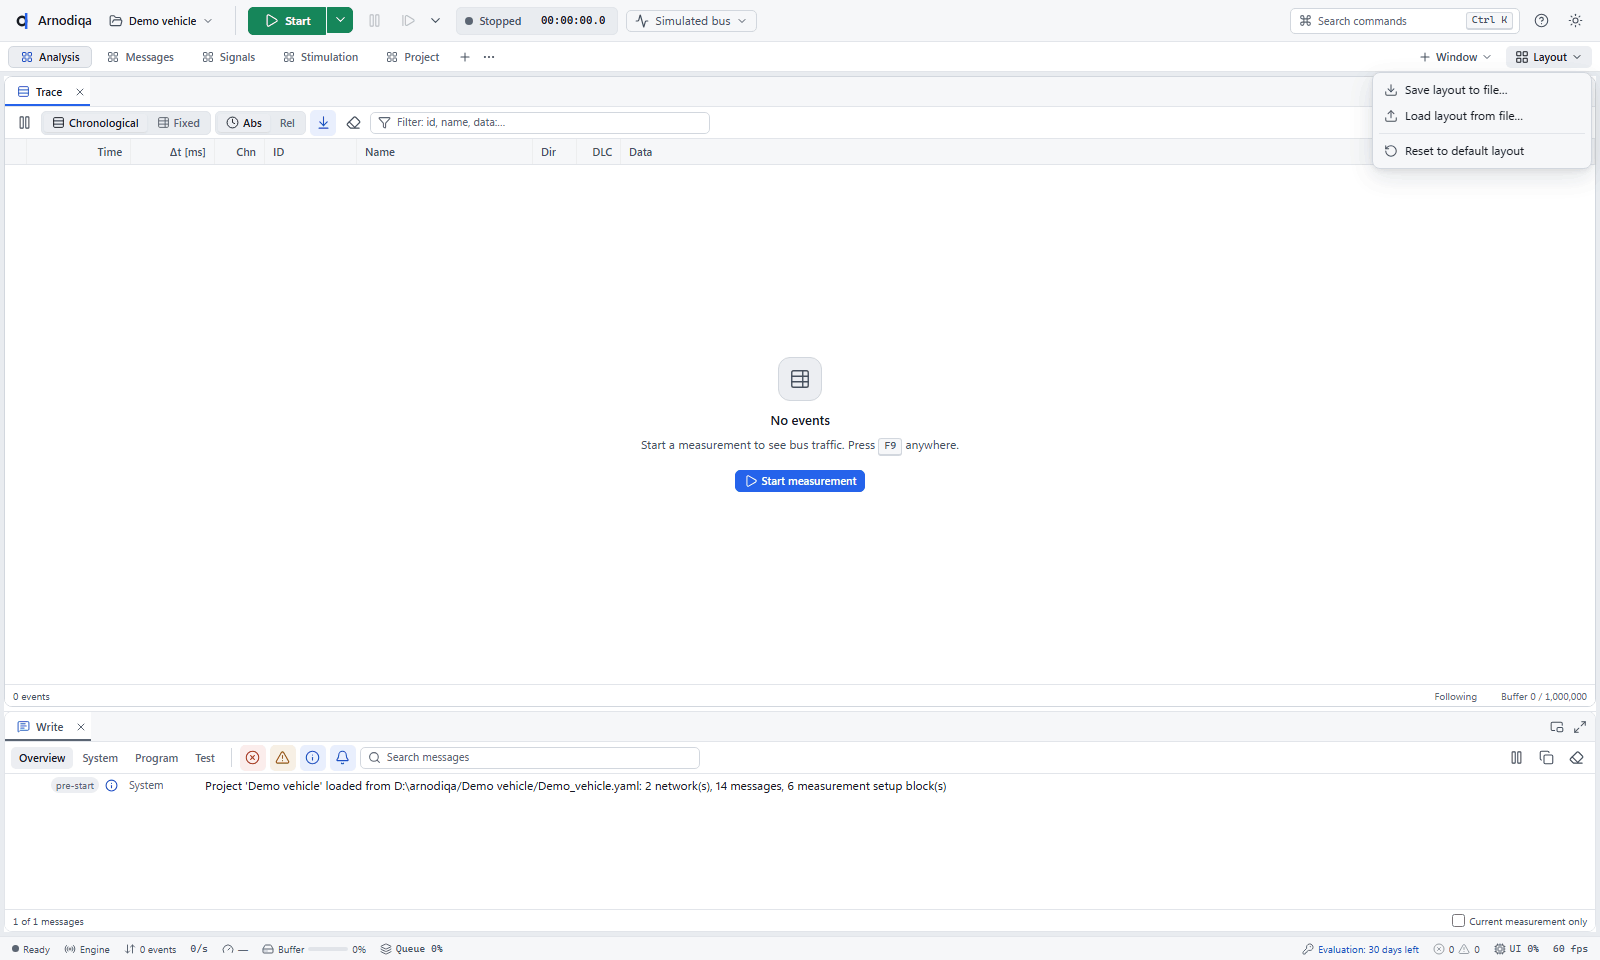
Save and load layouts as files, to share with colleagues or keep under version control.
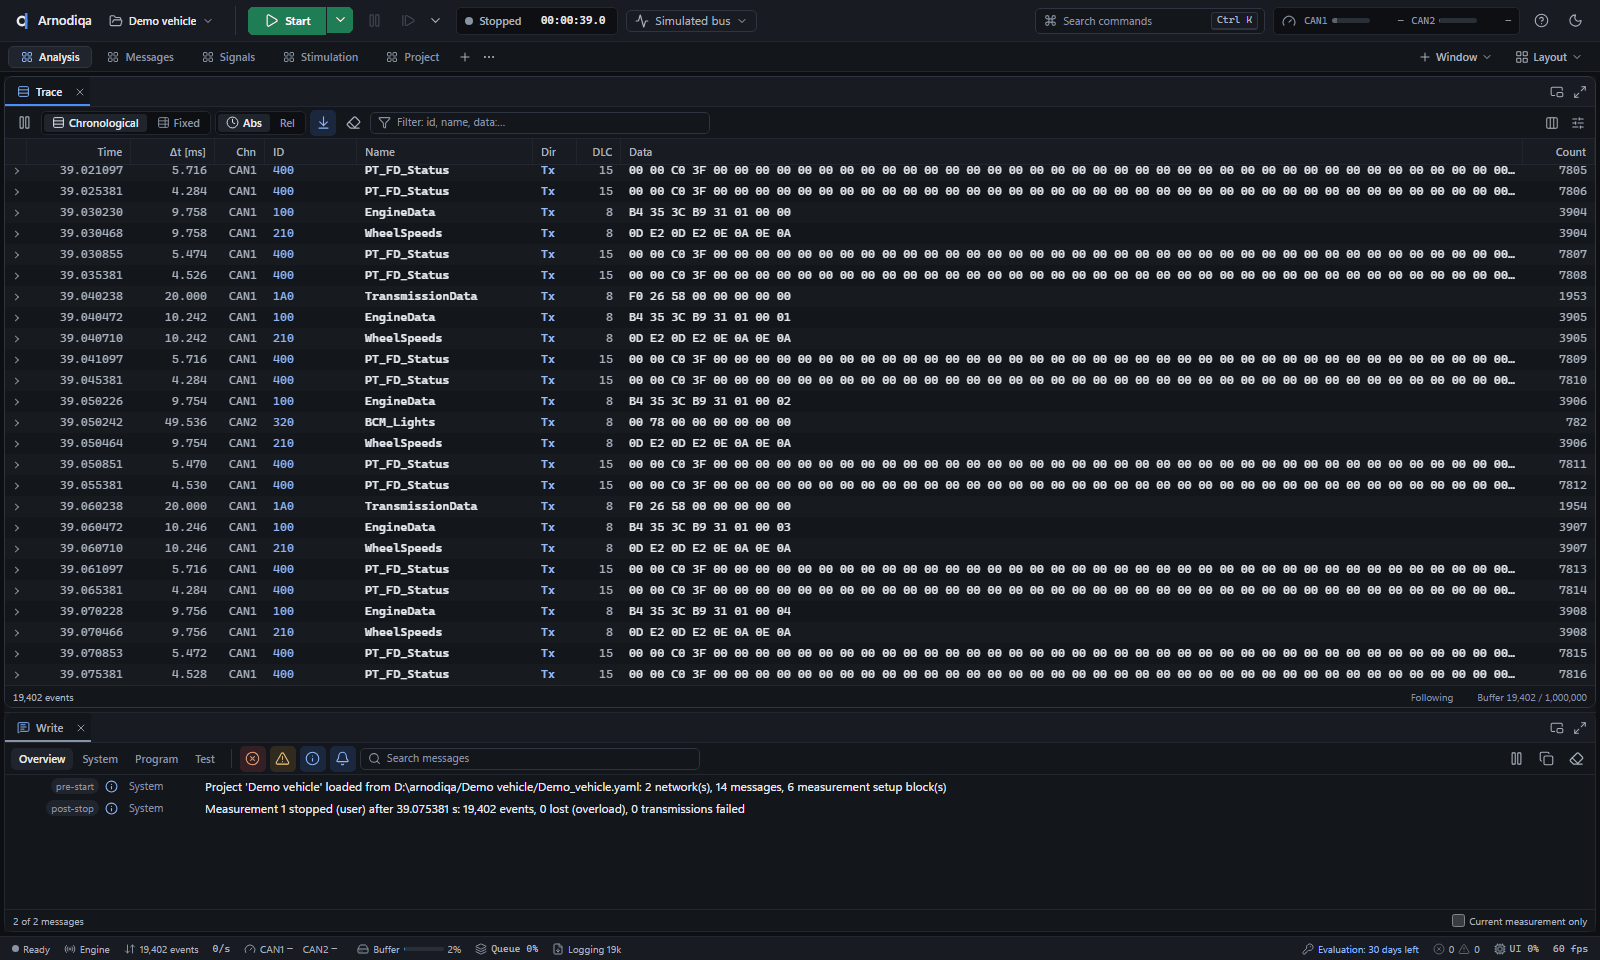
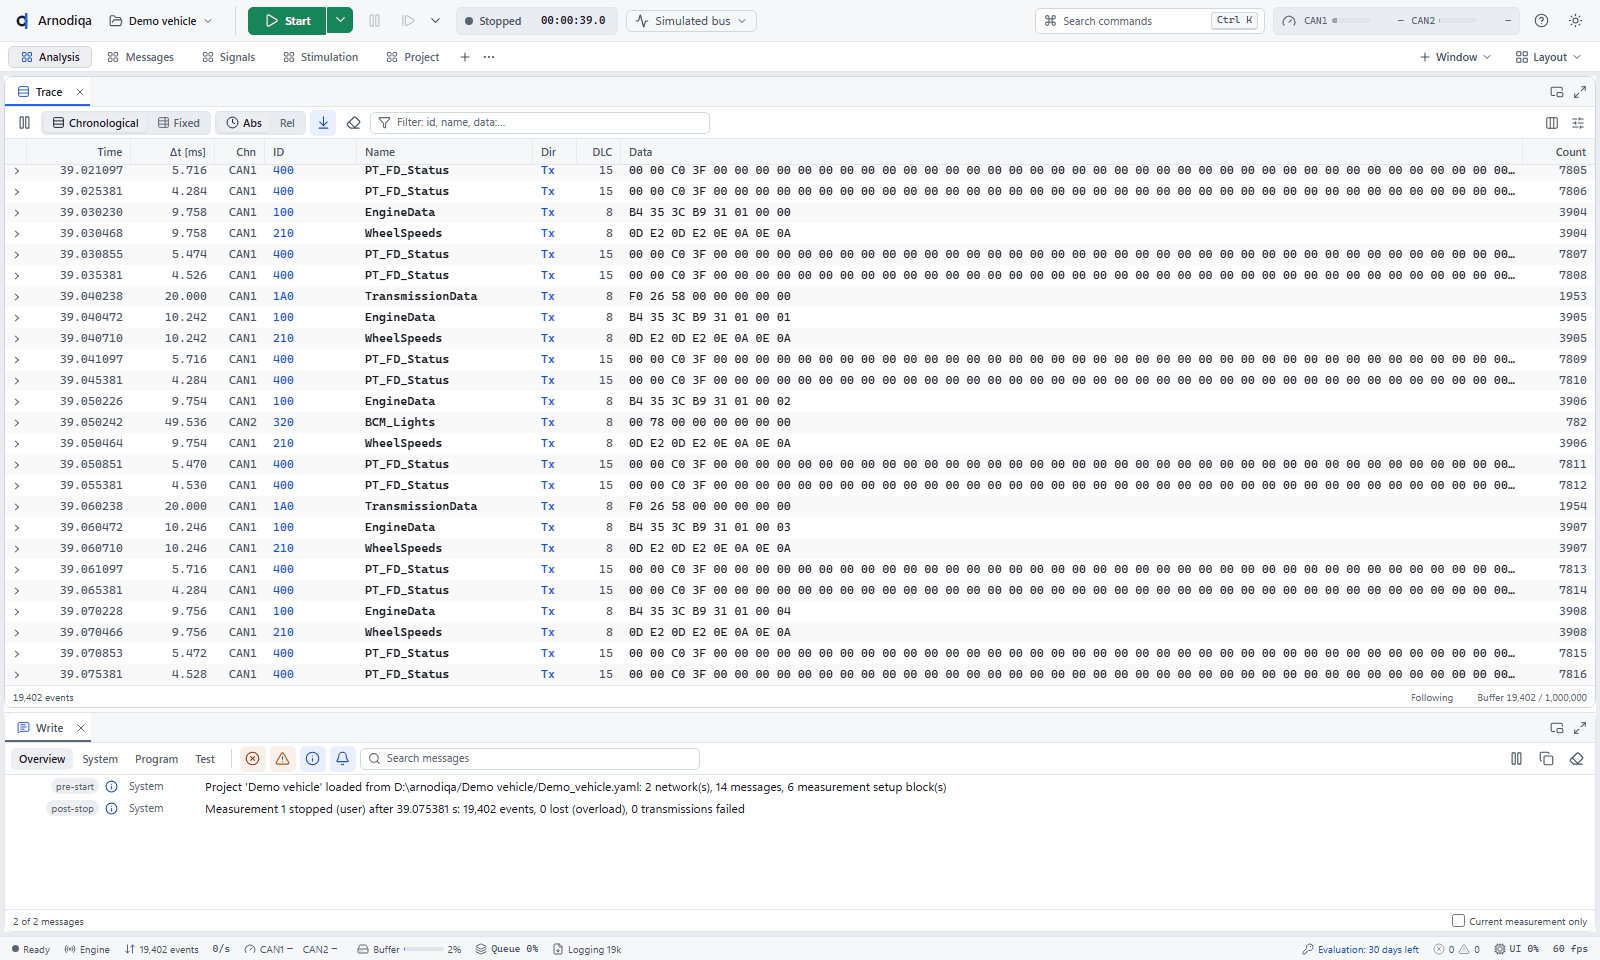
Measurement stopped: the Trace stays searchable and the Write window shows a summary.
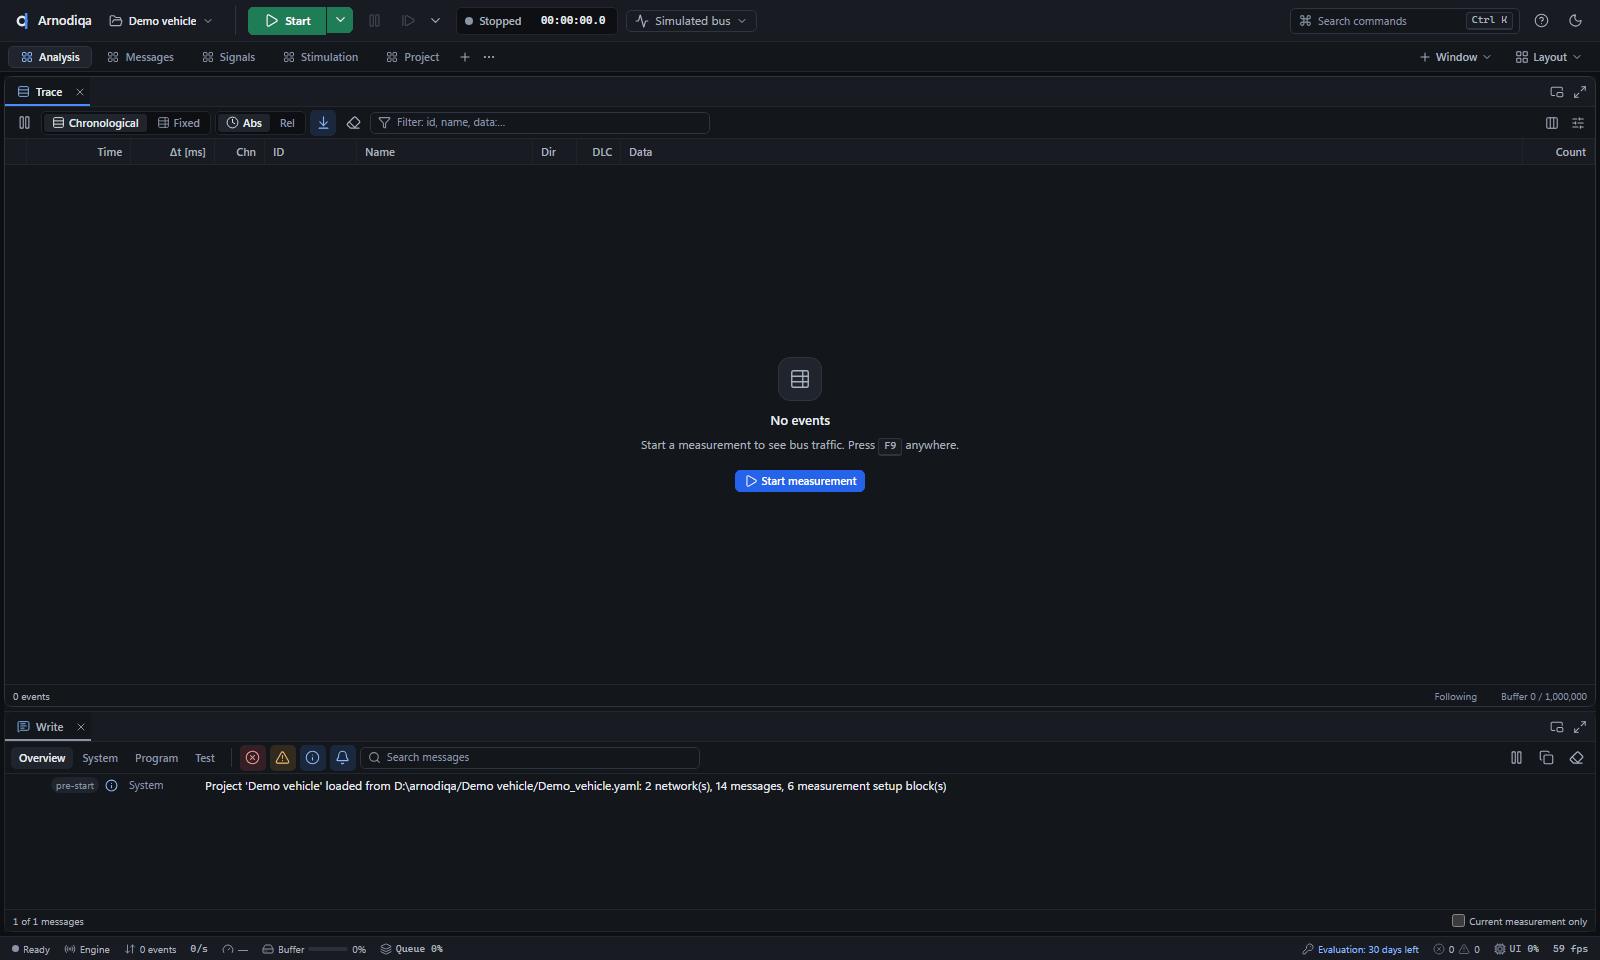
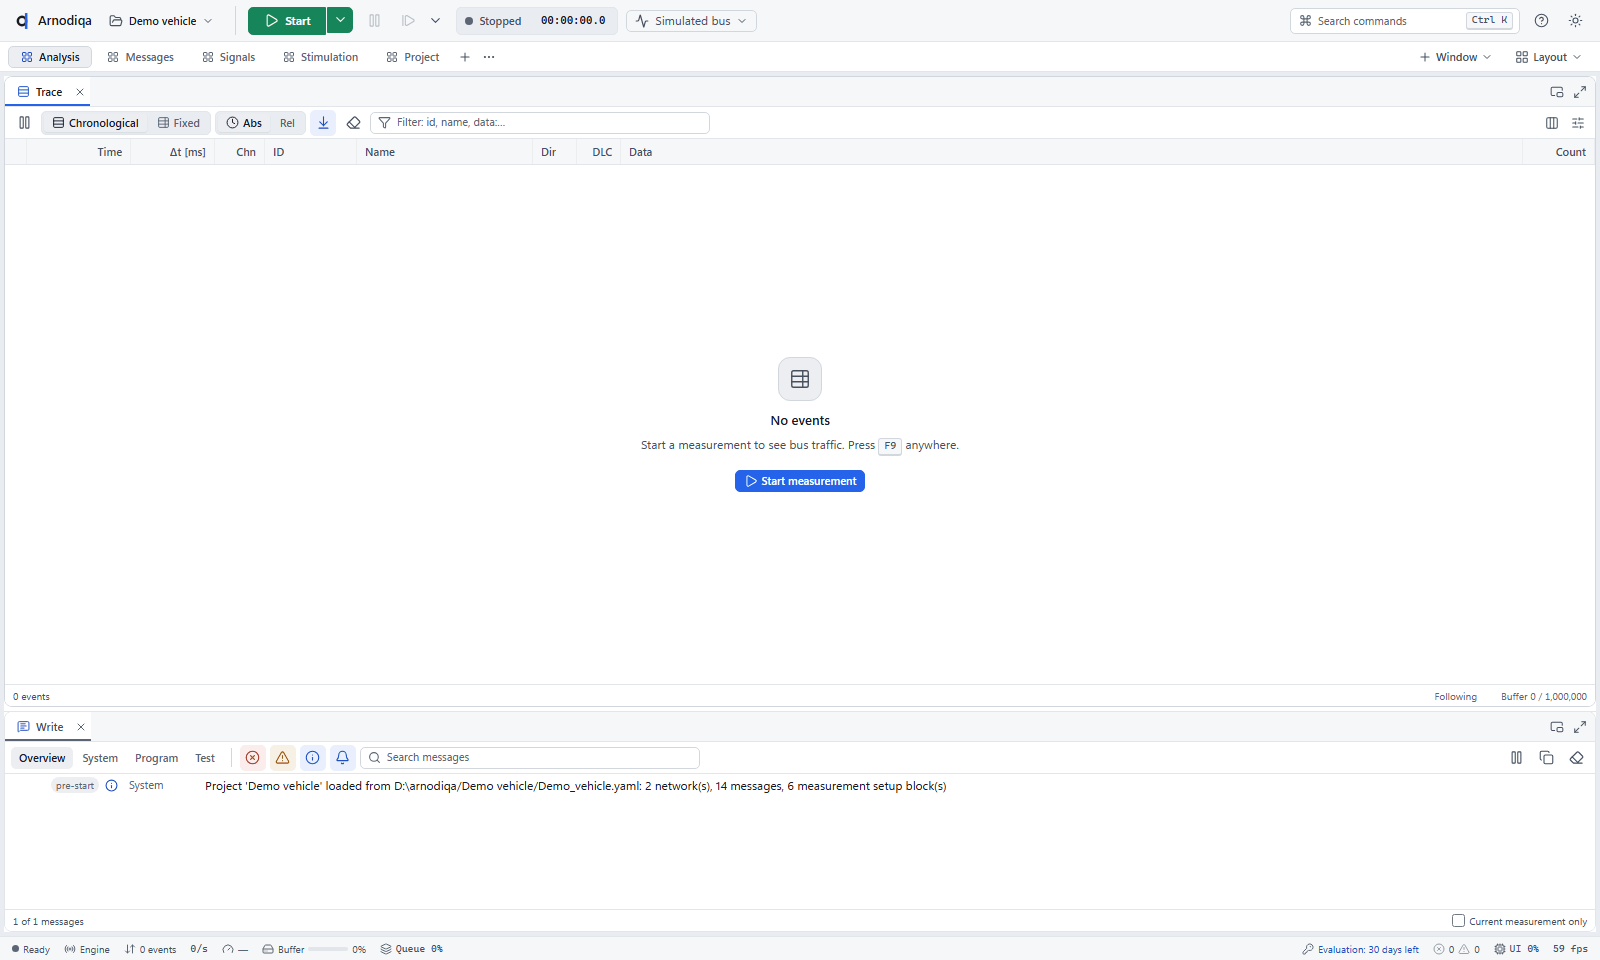
Empty workspace before the first measurement.
Click an image to enlarge it. The arrow keys browse through the images and Esc closes the view.