DocumentatieDocumentationDocumentation
Arnodiqa is een desktop-applicatie voor Windows. Deze documentatie legt per taak uit hoe je het in de app doet, met de stappen, schermafbeeldingen en een korte opname. Voor testbanken zonder scherm en voor pipelines is er de command line, beschreven onder Automatisering en CI.Arnodiqa is a desktop application for Windows. This documentation explains, task by task, how to work in the app, with the steps, screenshots and a short recording. For test benches without a screen and for pipelines there is the command line, described under Automation and CI.Arnodiqa est une application de bureau pour Windows. Cette documentation décrit chaque tâche dans l'application, avec les étapes, des captures d'écran et un court enregistrement. Pour les bancs de test sans écran et pour les pipelines, la ligne de commande est décrite sous Automatisation et CI.
Een project maken, de meting starten, de Trace met een filter, een frame met signalen en een signaal in Graphics.Creating a project, starting a measurement, the Trace with a filter, a frame with signals and a signal in Graphics.Créer un projet, démarrer la mesure, la Trace avec un filtre, une trame avec ses signaux et un signal dans Graphics.
Het hoofdvensterThe main windowLa fenêtre principale
| ToolbarBarre d'outilsToolbar | Project menu, Start and Stop (F9, Esc), state and measurement time, the working mode (simulated bus, real bus or offline), the command search (Ctrl+K), bus load per channel, Help and theme.Menu du projet, Start et Stop (F9, Échap), état et durée de la mesure, mode de travail (bus simulé, bus réel ou hors ligne), recherche de commandes (Ctrl+K), charge de bus par canal, aide et thème.Projectmenu, Start en Stop (F9, Esc), de toestand en meettijd, de werkmodus (gesimuleerde bus, echte bus of offline), het zoekveld voor commando's (Ctrl+K), de busload per kanaal, Help en het thema. |
|---|---|
| Desktops | Analysis (Trace and Write), Messages, Signals (Graphics, Data, Statistics), Stimulation (Interactive Generator) and Project (project explorer and simulation setup).Analysis (Trace et Write), Messages, Signals (Graphics, Data, Statistics), Stimulation (Interactive Generator) et Project (explorateur de projet et Simulation Setup).Analysis (Trace en Write), Messages, Signals (Graphics, Data, Statistics), Stimulation (Interactive Generator) en Project (projectverkenner en Simulation Setup). |
| WindowsFenêtresVensters | Window adds windows. Windows can be dragged and docked; Layout saves the arrangement.Window ajoute des fenêtres. Vous pouvez déplacer et ancrer les fenêtres ; Layout enregistre la disposition.Met Window voeg je vensters toe. Vensters zijn te verslepen en te docken; Layout bewaart de indeling. |
| Write windowFenêtre WriteWrite-venster | Messages from the system, from scripts (Program tab) and from tests (Test tab).Messages du système, des scripts (onglet Program) et des tests (onglet Test).Meldingen van het systeem, van scripts (tabblad Program) en van tests (tabblad Test). |
| Status barBarre d'étatStatusbalk | State, connection to the engine, number of events, events per second, buffer and logging.État, connexion au moteur (engine), nombre d'événements, événements par seconde, tampon et journalisation.Toestand, verbinding met de engine, aantal events, events per seconde, buffer en logging. |
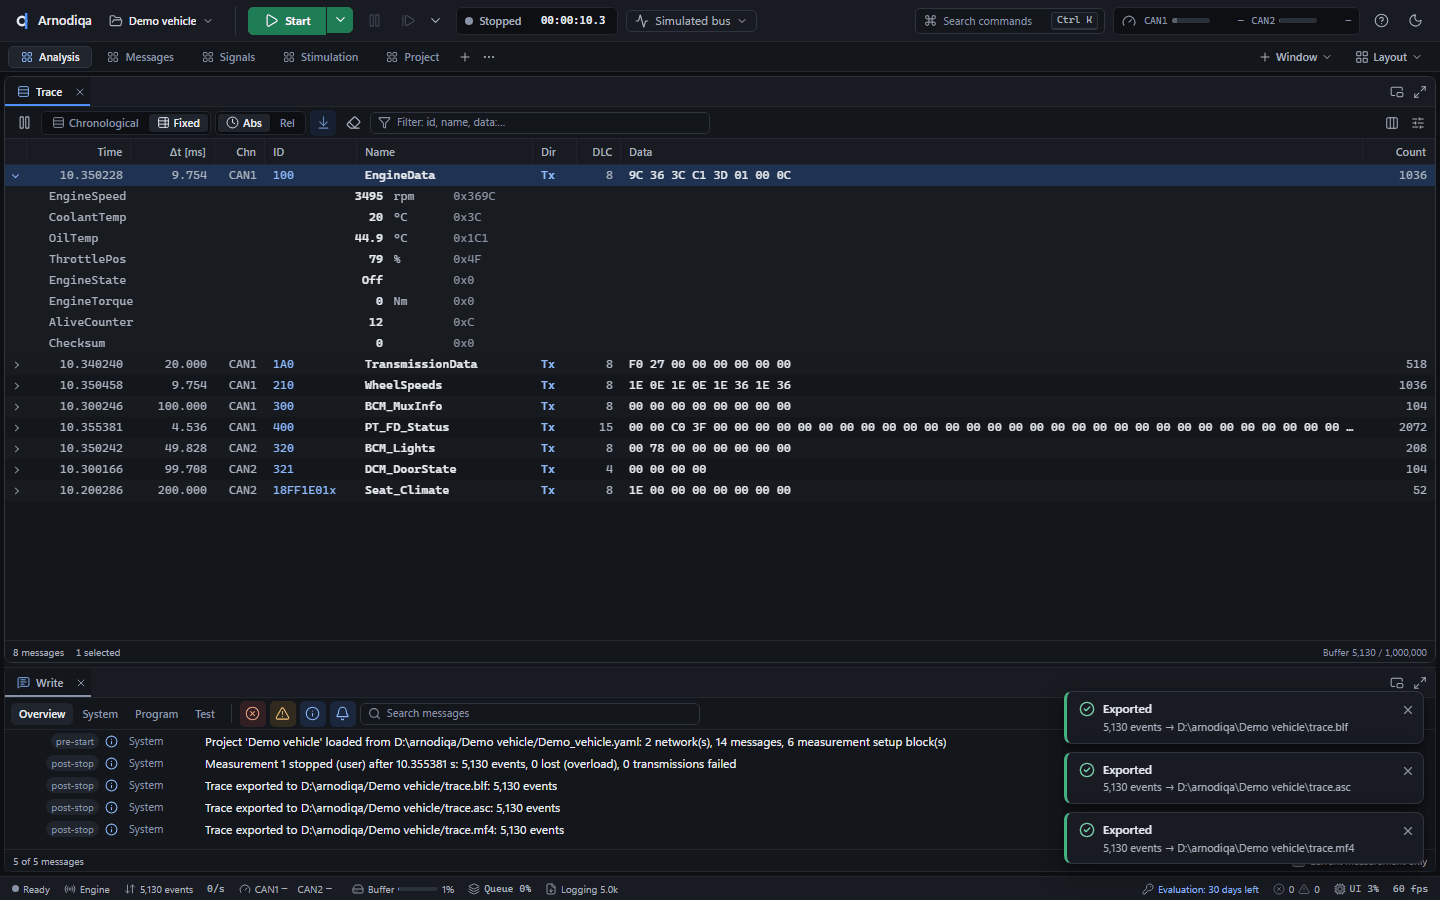
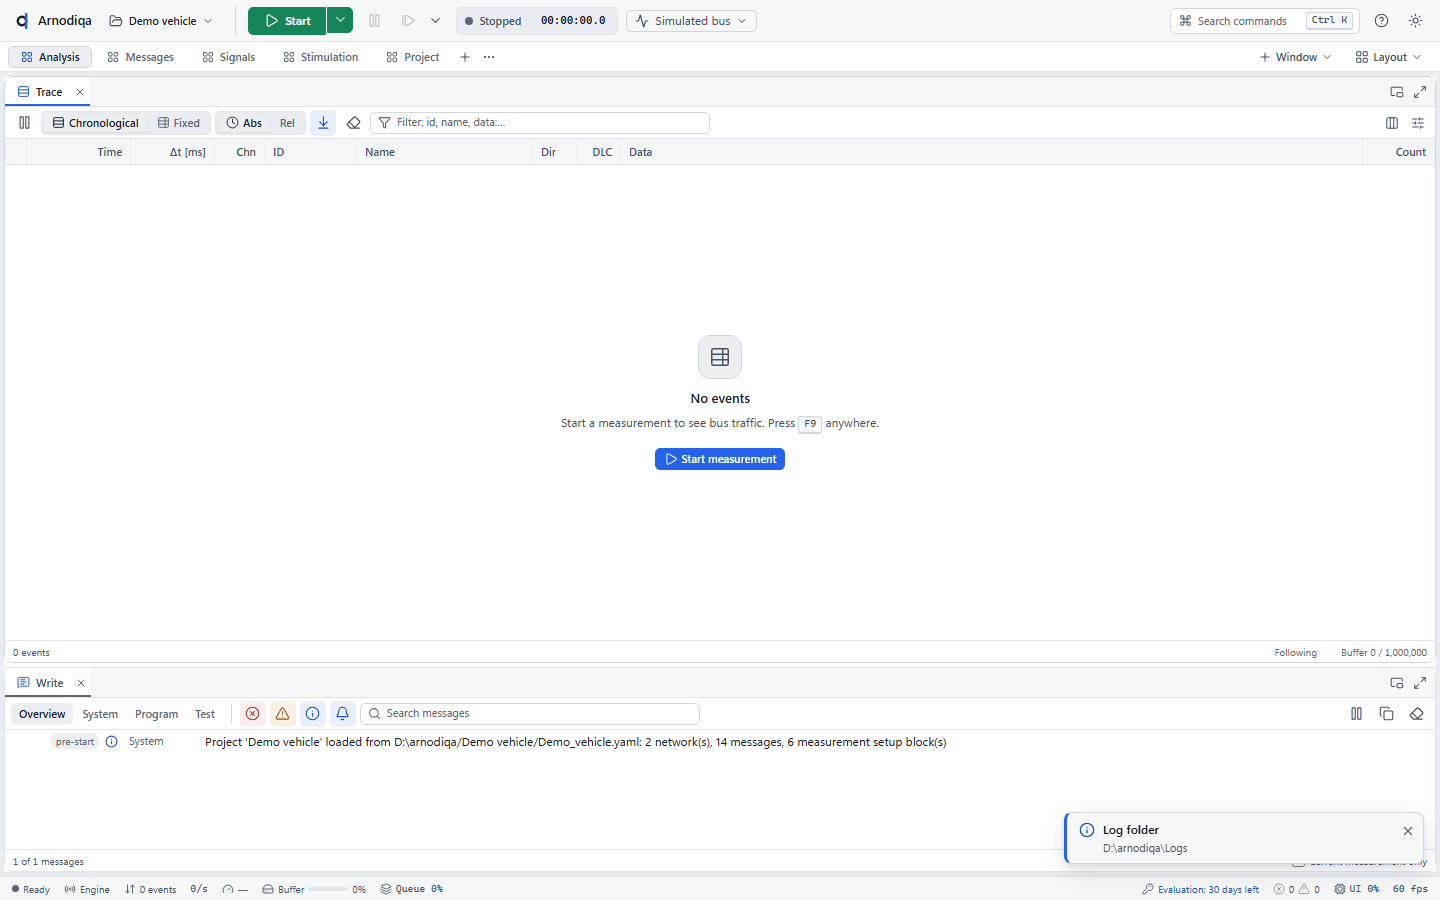
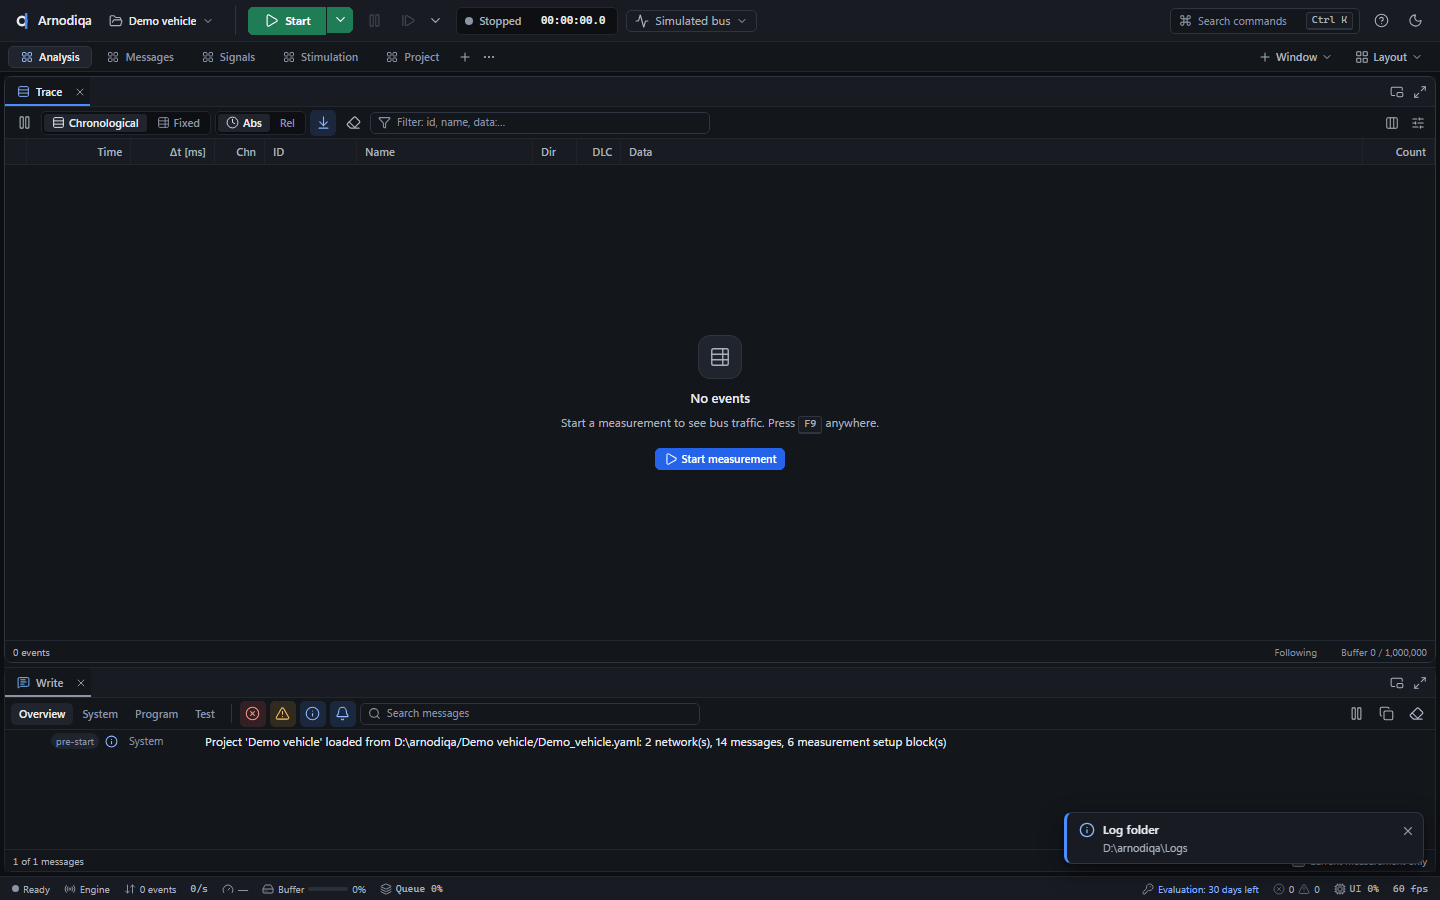
De schermafbeeldingen en opnamen volgen het thema van deze site. Klik op een afbeelding om haar te vergroten.Screenshots and recordings follow the theme of this site. Click an image to enlarge it.Les captures d'écran et les enregistrements suivent le thème de ce site. Cliquez sur une image pour l'agrandir.
Project openen, nieuw project maken en een database toevoegenOpen a project, create a new one and add a databaseOuvrir un projet, créer un projet et ajouter une base de données
Een project bundelt de netwerken, databases, Measurement Setup, panels en simulatienodes in één YAML-bestand.A project bundles the networks, databases, measurement setup, panels and simulation nodes in one YAML file.Un projet regroupe dans un seul fichier YAML les réseaux, les bases de données, le Measurement Setup, les panneaux (panels) et les nœuds de simulation.
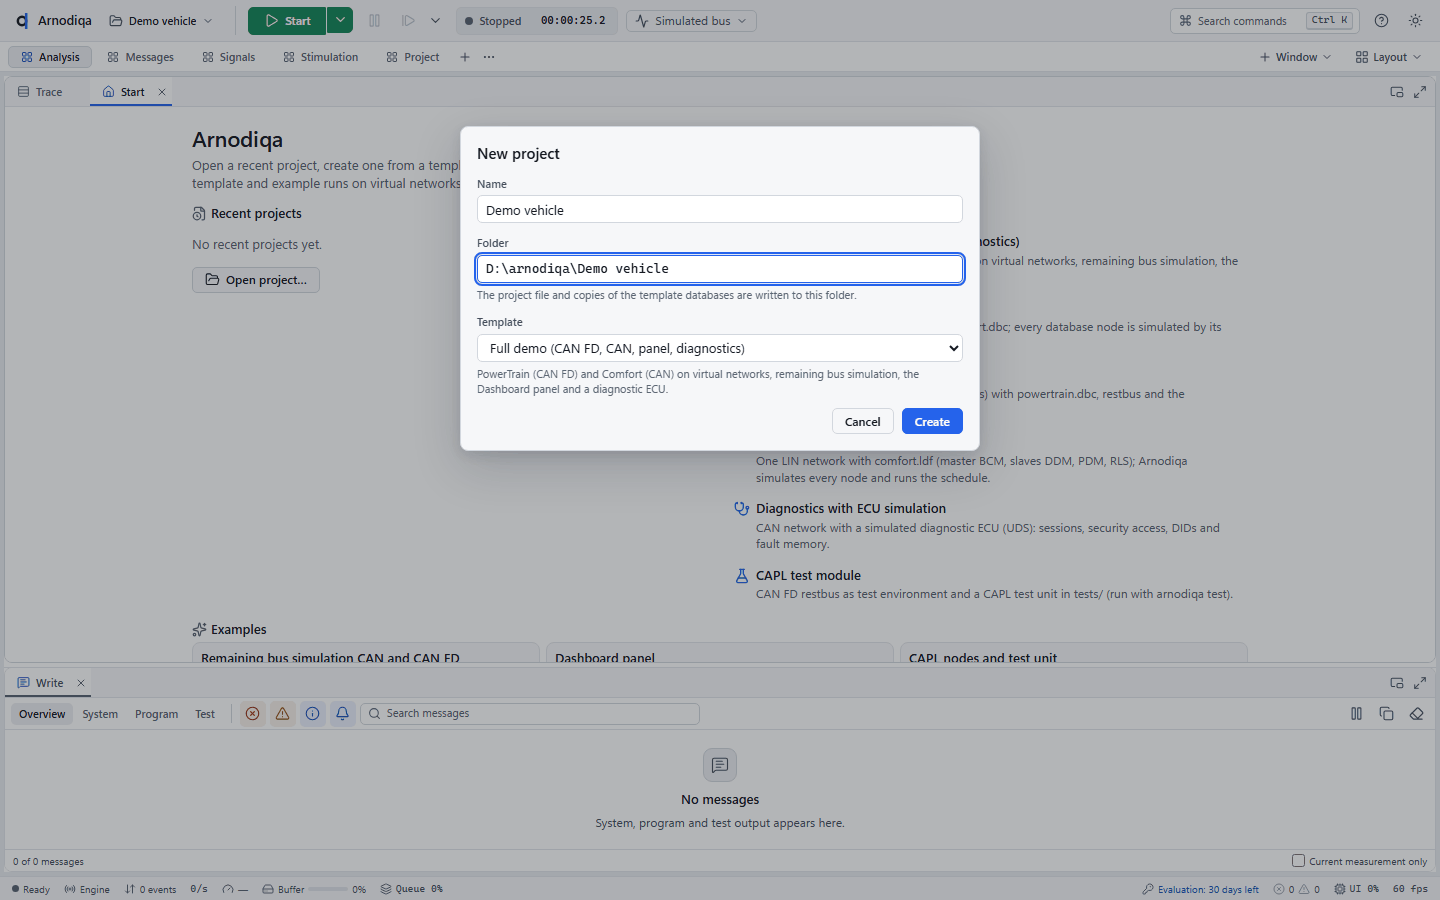
Zonder geladen project opent Arnodiqa de startpagina (Start). Onder New project staan de sjablonen, onder Examples de voorbeelden en onder Recent projects de laatst gebruikte projecten.Without a loaded project, Arnodiqa opens the start page (Start). New project lists the templates, Examples the examples and Recent projects the projects used last.Sans projet chargé, Arnodiqa ouvre la page d'accueil (Start). New project présente les modèles, Examples les exemples et Recent projects les derniers projets utilisés.
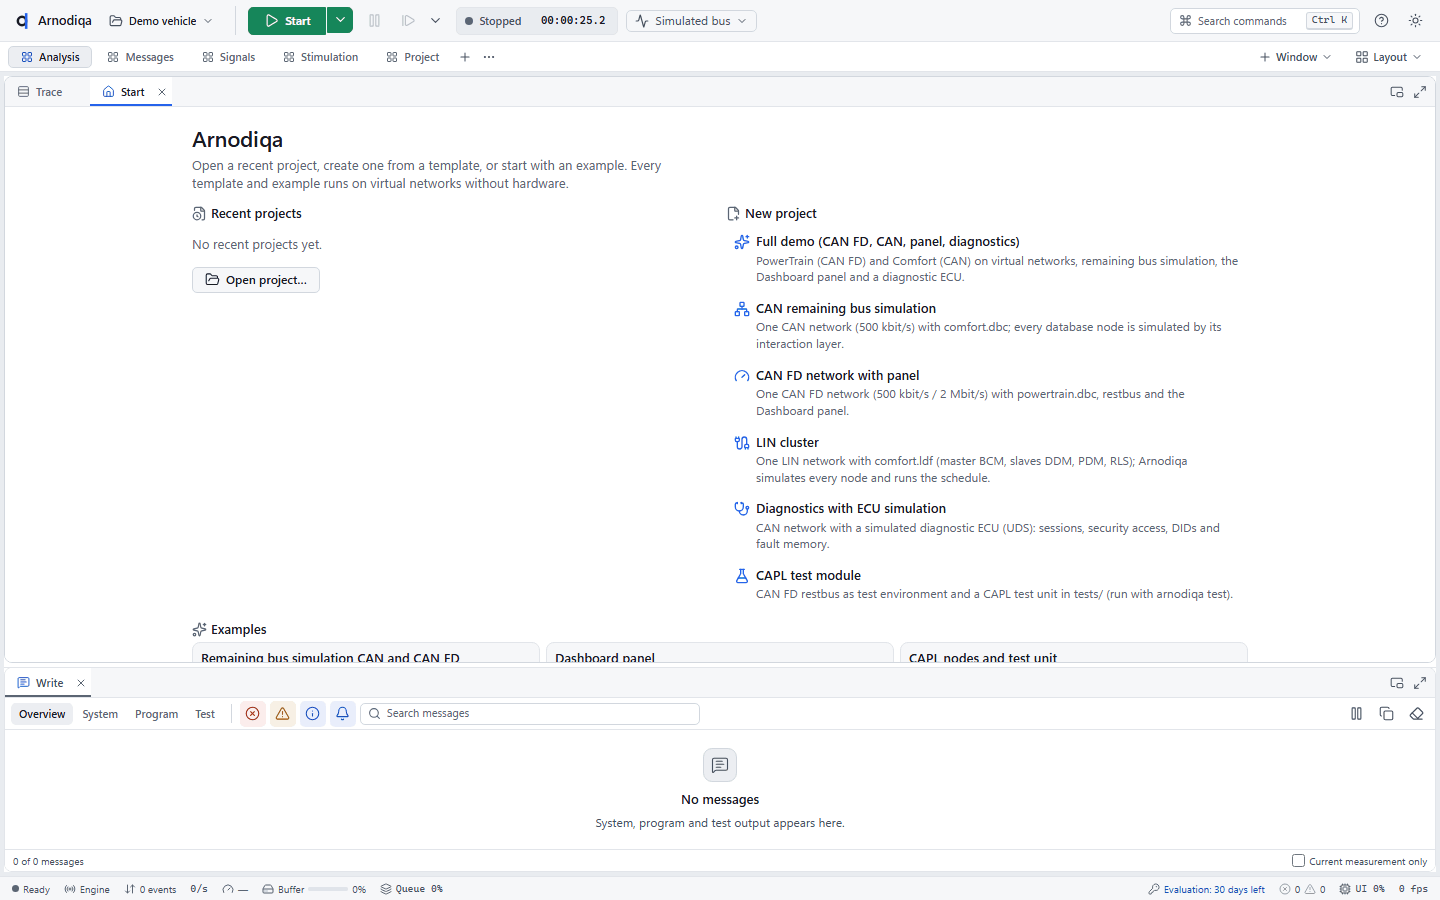
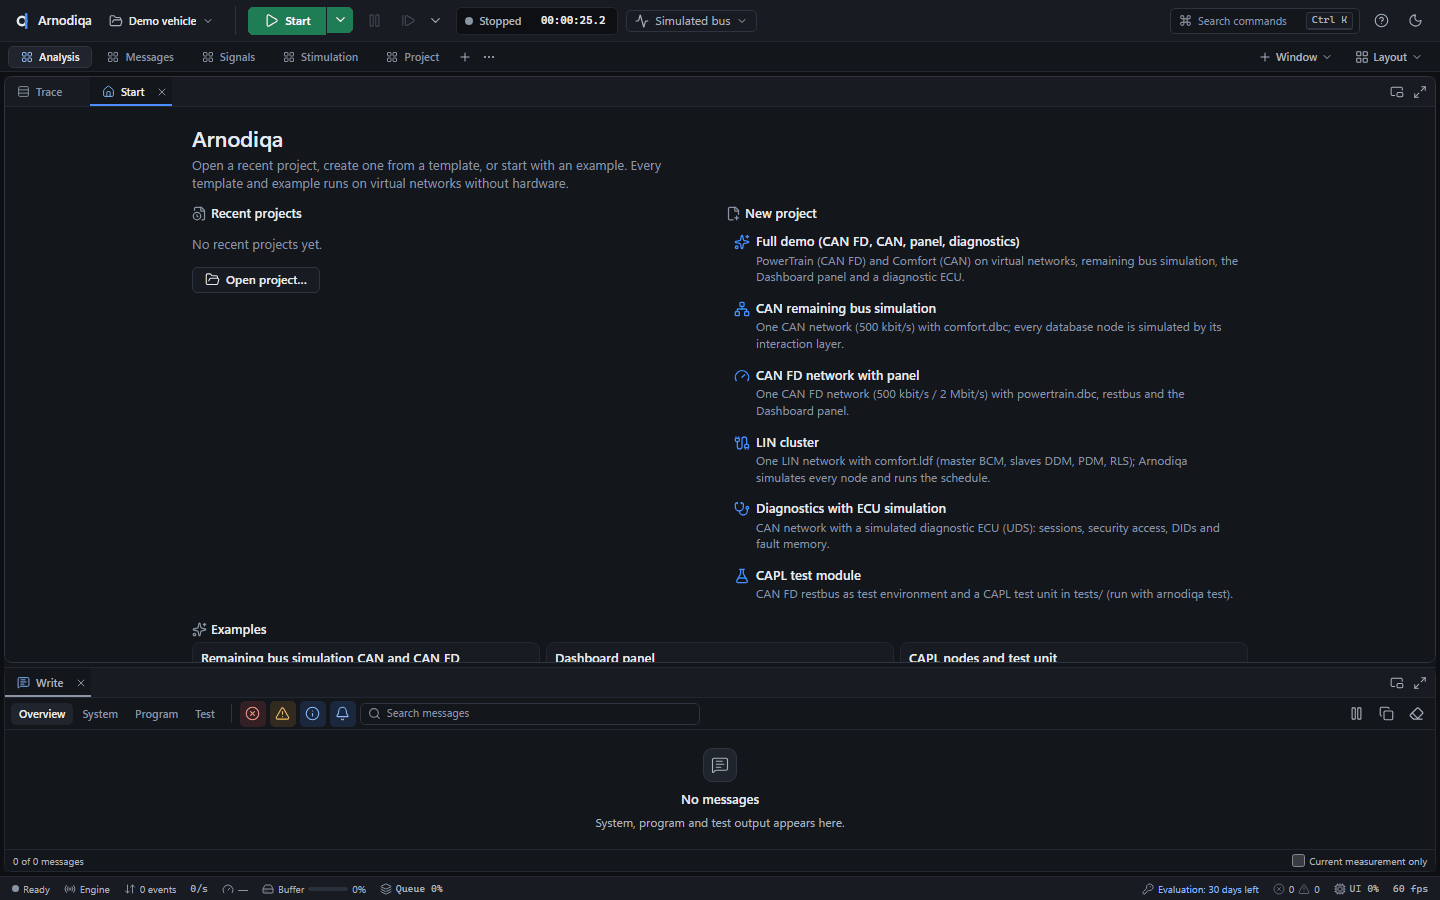
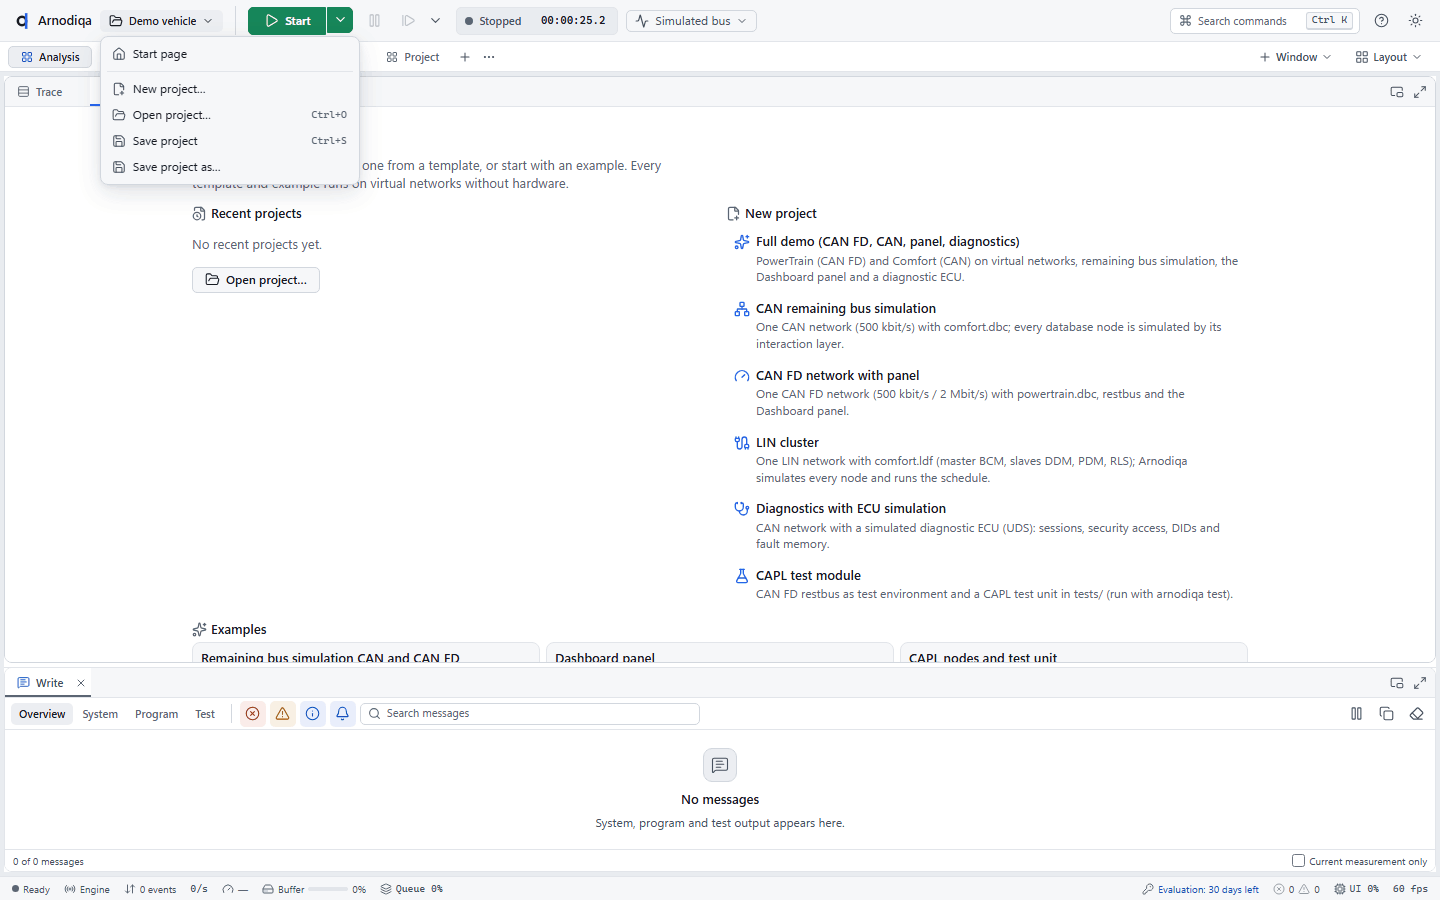
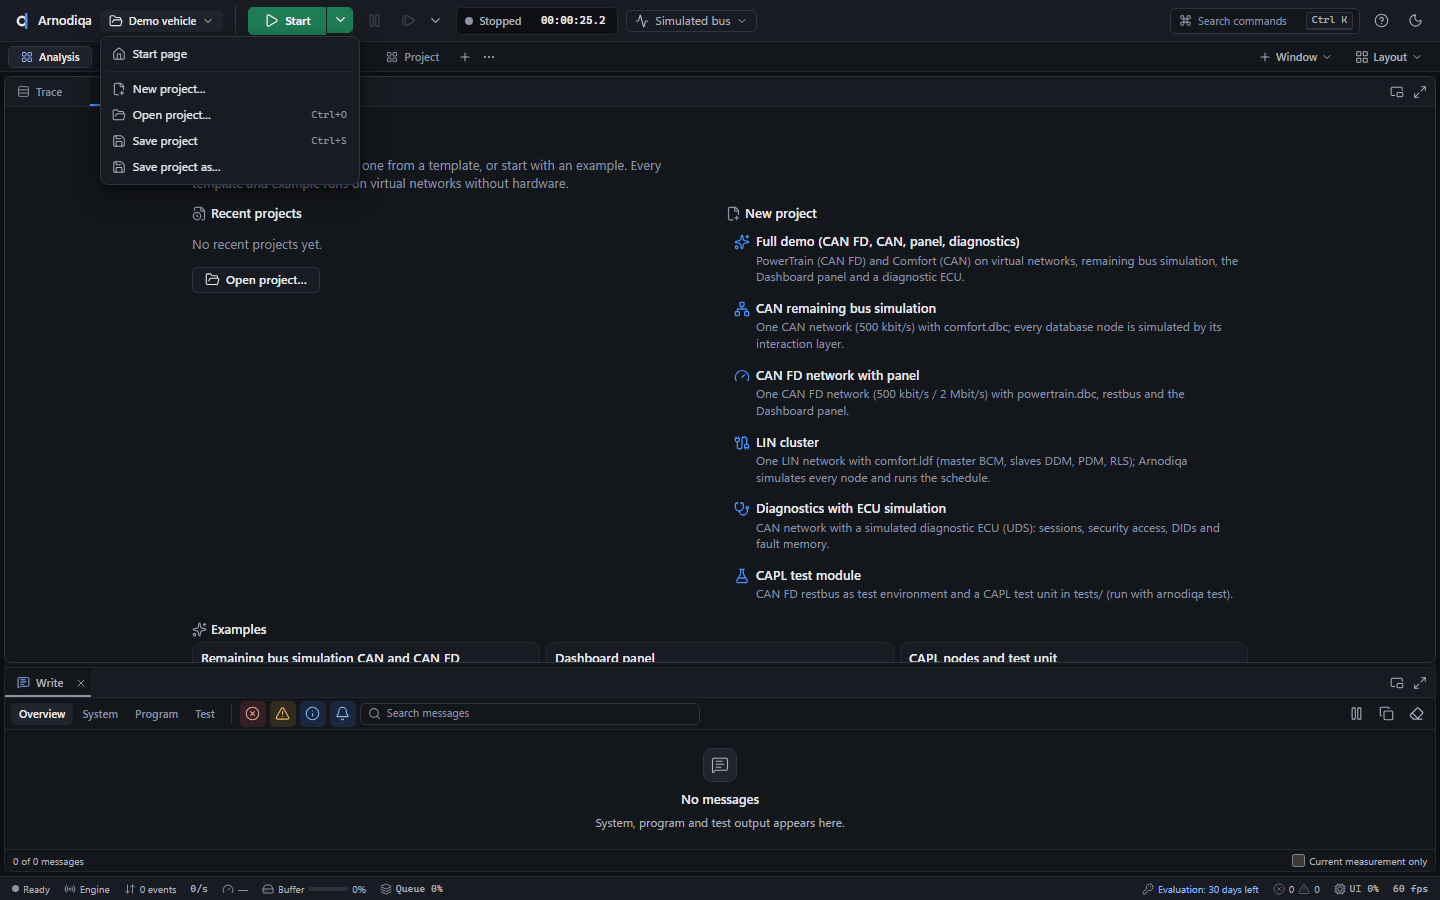
Klik linksboven op het projectmenu (de knop met de projectnaam; zonder project staat er No project). Kies New project… voor een nieuw project of Open project… (Ctrl+O) om een bestaand projectbestand (.yaml) te openen.Click the project menu at the top left (the button with the project name; without a project it reads No project). Choose New project… for a new project or Open project… (Ctrl+O) to open an existing project file (.yaml).Cliquez en haut à gauche sur le menu du projet (le bouton portant le nom du projet ; sans projet, il affiche No project). Choisissez New project… pour créer un projet ou Open project… (Ctrl+O) pour ouvrir un fichier de projet existant (.yaml).
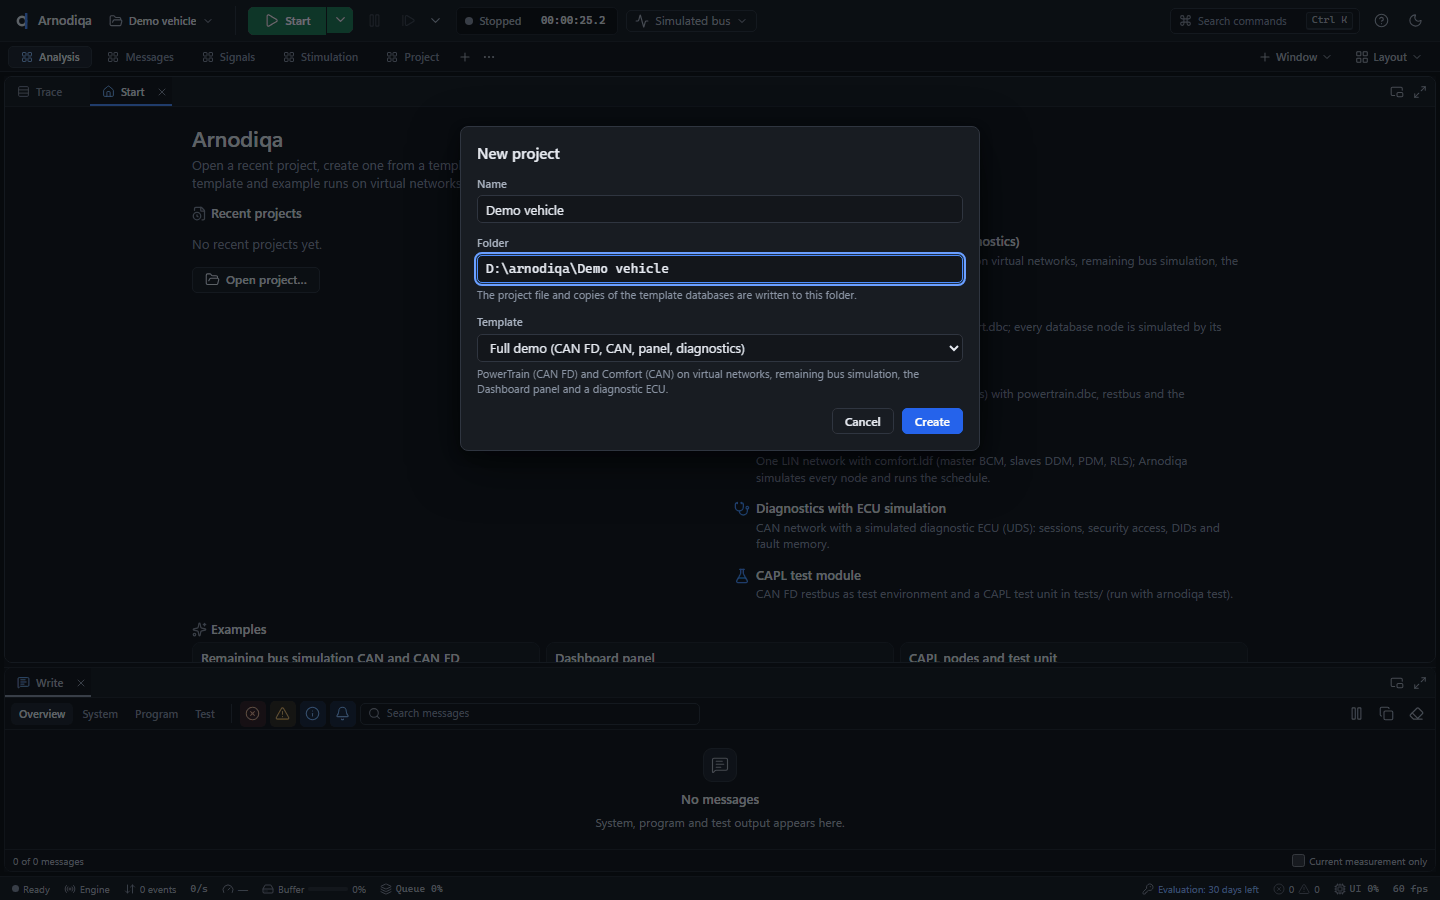
In het venster New project vul je bij Name de projectnaam in, kies je bij Folder de projectmap (met Browse…) en bij Template een sjabloon, bijvoorbeeld Full demo (CAN FD, CAN, panel, diagnostics). Klik op Create.In the New project dialog, enter the project name under Name, choose the project folder under Folder (with Browse…) and a template under Template, for example Full demo (CAN FD, CAN, panel, diagnostics). Click Create.Dans la boîte de dialogue New project, saisissez le nom du projet sous Name, choisissez le dossier du projet sous Folder (avec Browse…) et un modèle sous Template, par exemple Full demo (CAN FD, CAN, panel, diagnostics). Cliquez sur Create.
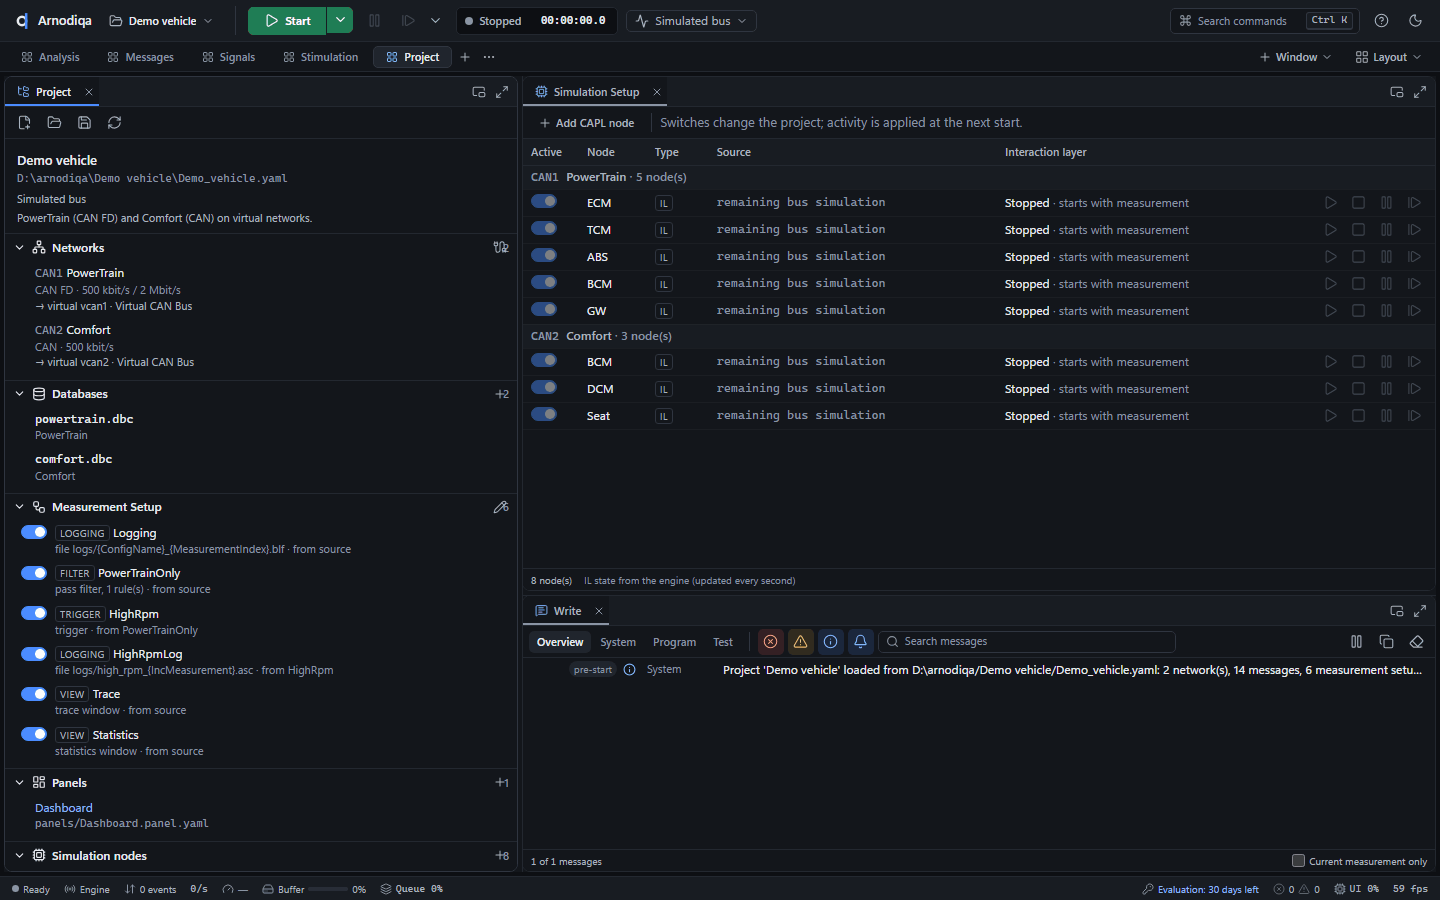
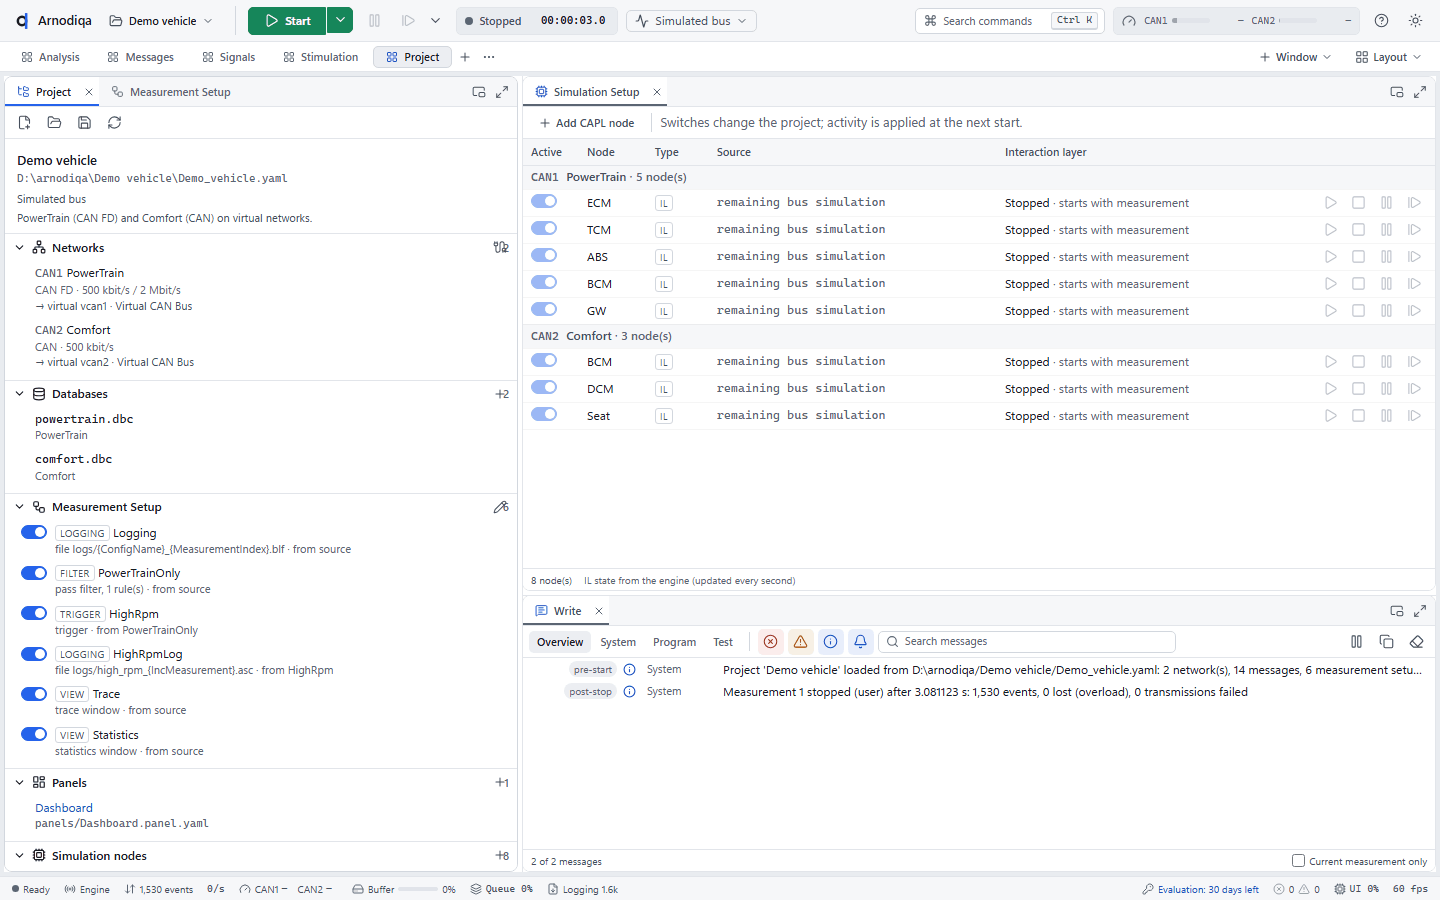
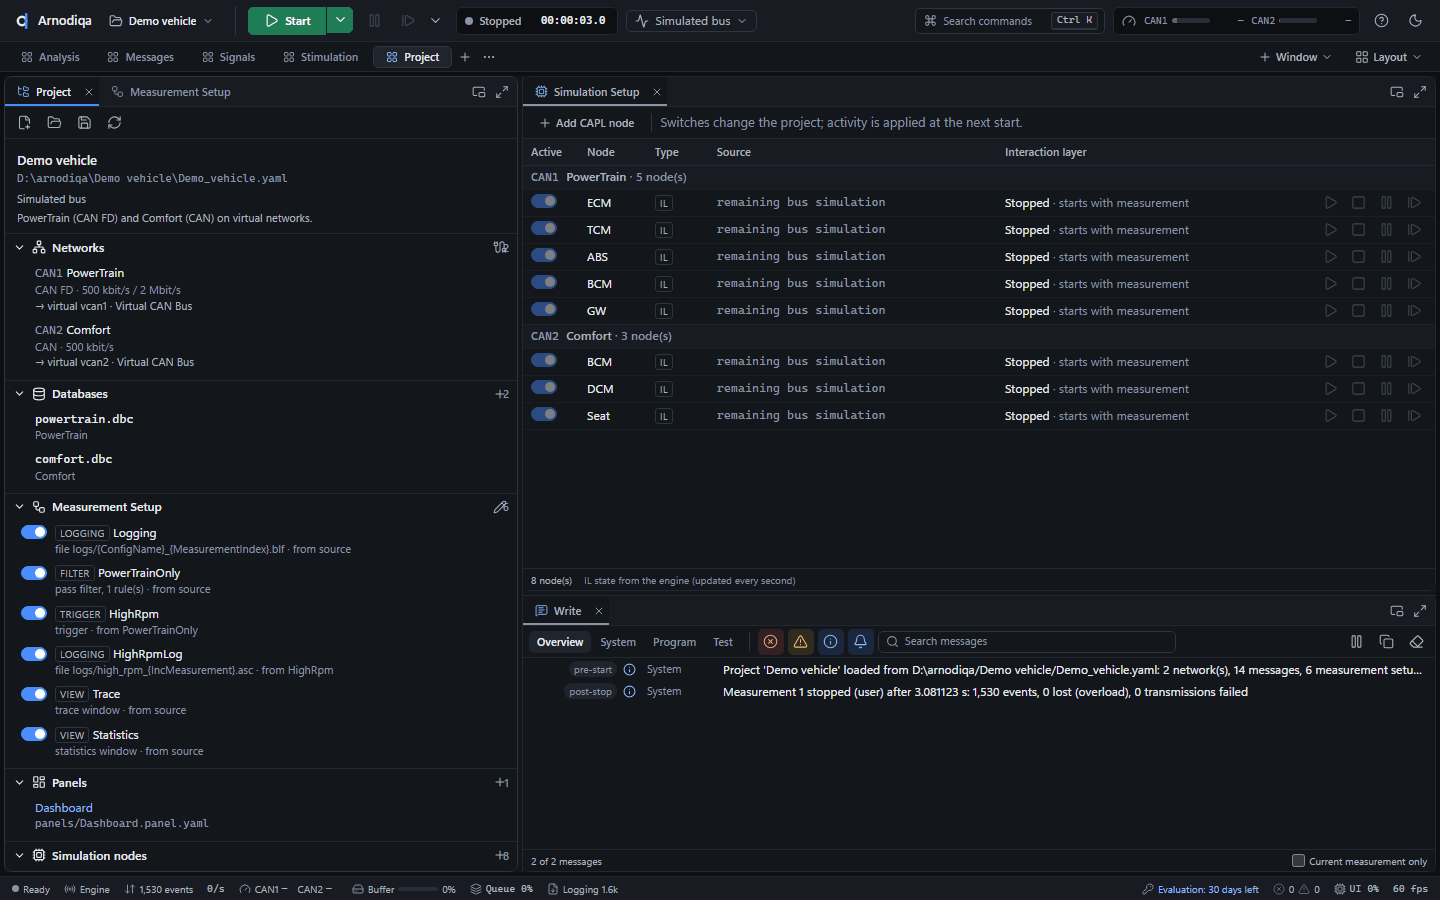
Het project is geladen en de projectnaam staat in de toolbar. Op de desktop Project toont de projectverkenner de netwerken, de databases, de Measurement Setup, de panels en de simulatienodes; rechts staat de Simulation Setup.The project is loaded and its name appears in the toolbar. On the Project desktop, the project explorer shows the networks, databases, measurement setup, panels and simulation nodes; the simulation setup is on the right.Le projet est chargé et son nom apparaît dans la barre d'outils. Sur le desktop Project, l'explorateur de projet affiche les réseaux, les bases de données, le Measurement Setup, les panneaux et les nœuds de simulation ; le Simulation Setup se trouve à droite.
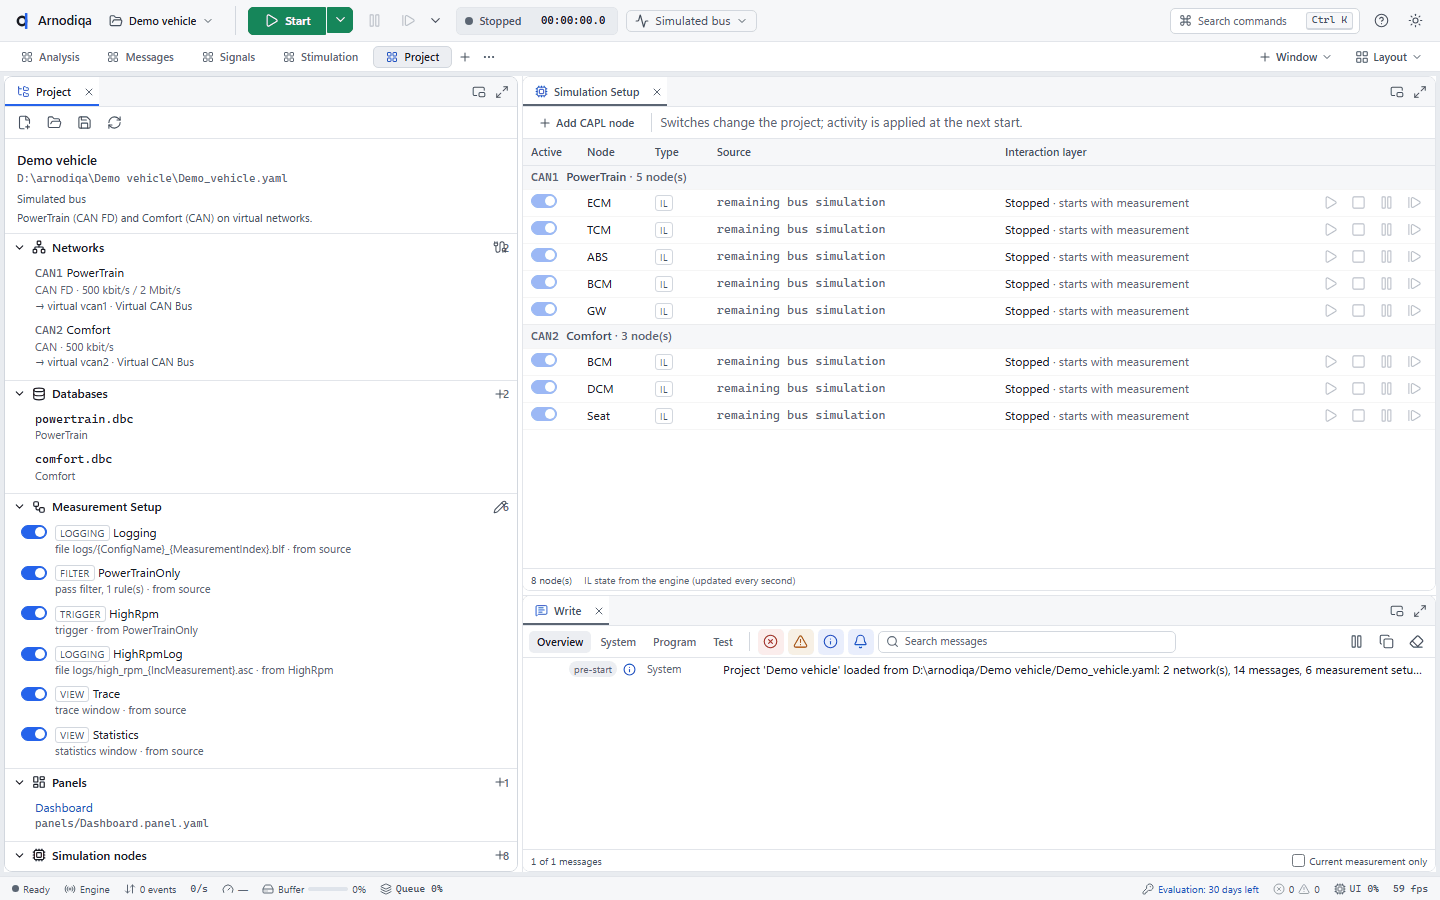
De databases van het project staan onder Databases, hier powertrain.dbc voor PowerTrain en comfort.dbc voor Comfort. Het potlood naast een DBC- of LDF-bestand opent de Database Editor; de prullenbak haalt de database uit het project, het bestand zelf blijft staan.The project's databases are listed under Databases, here powertrain.dbc for PowerTrain and comfort.dbc for Comfort. The pencil next to a DBC or LDF file opens the Database Editor; the bin removes the database from the project, the file itself remains.Les bases de données du projet figurent sous Databases, ici powertrain.dbc pour PowerTrain et comfort.dbc pour Comfort. Le crayon à côté d'un fichier DBC ou LDF ouvre le Database Editor ; la corbeille retire la base de données du projet, le fichier lui-même est conservé.
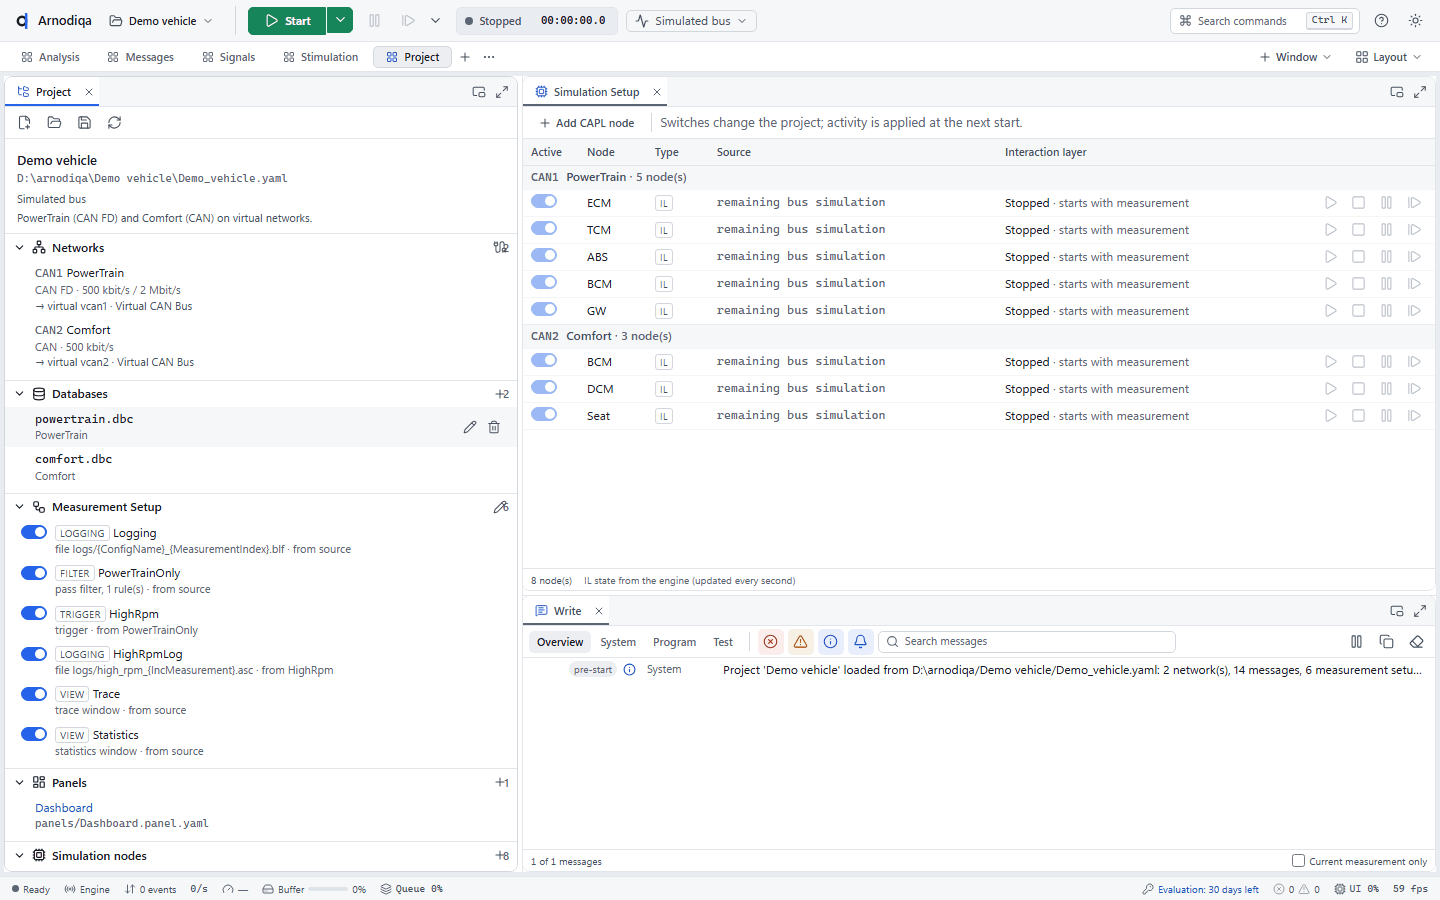
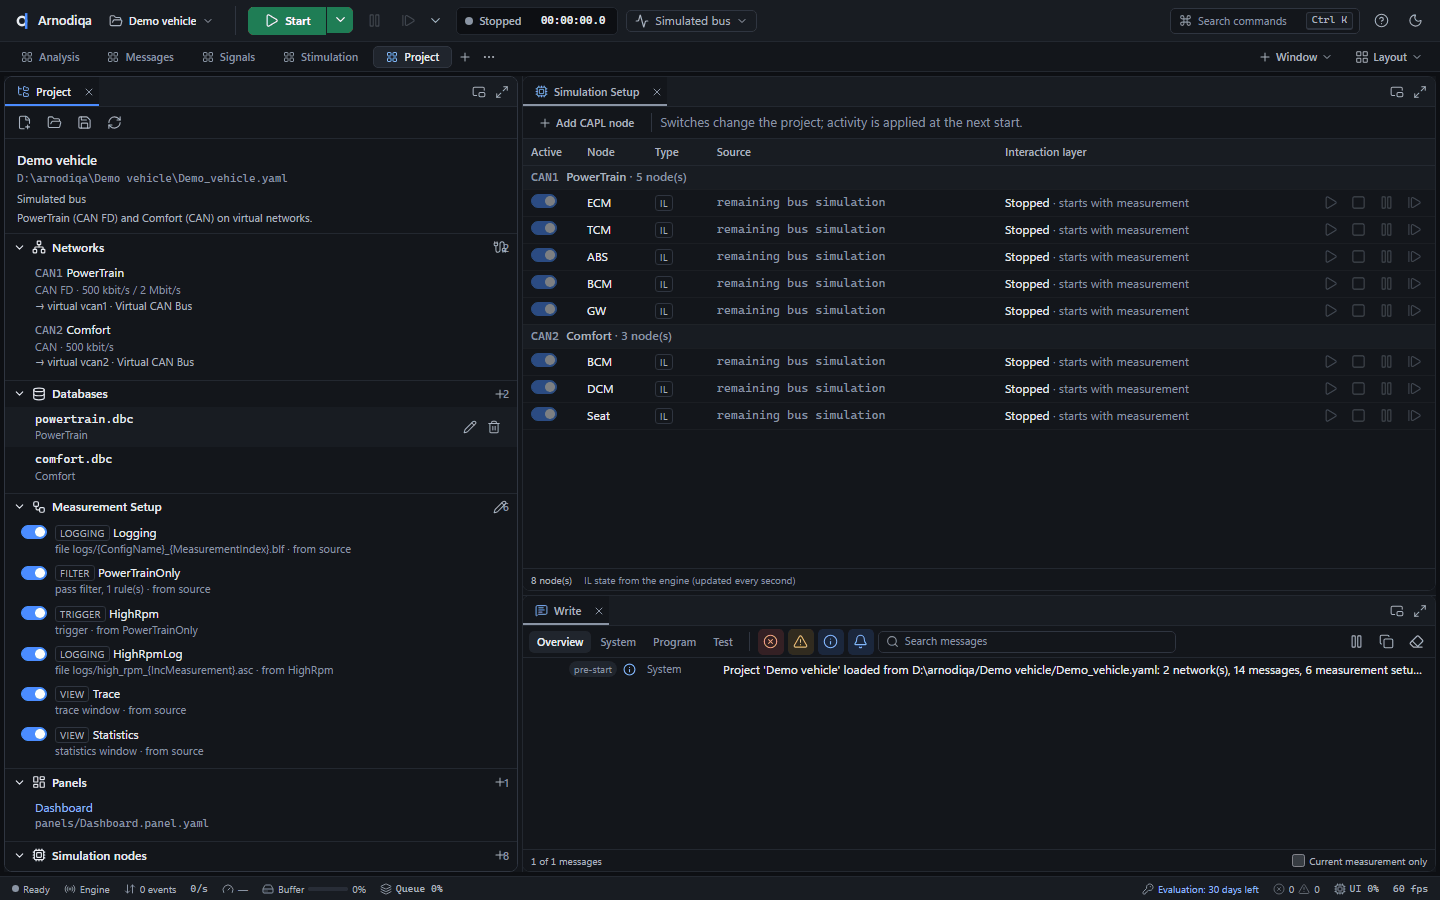
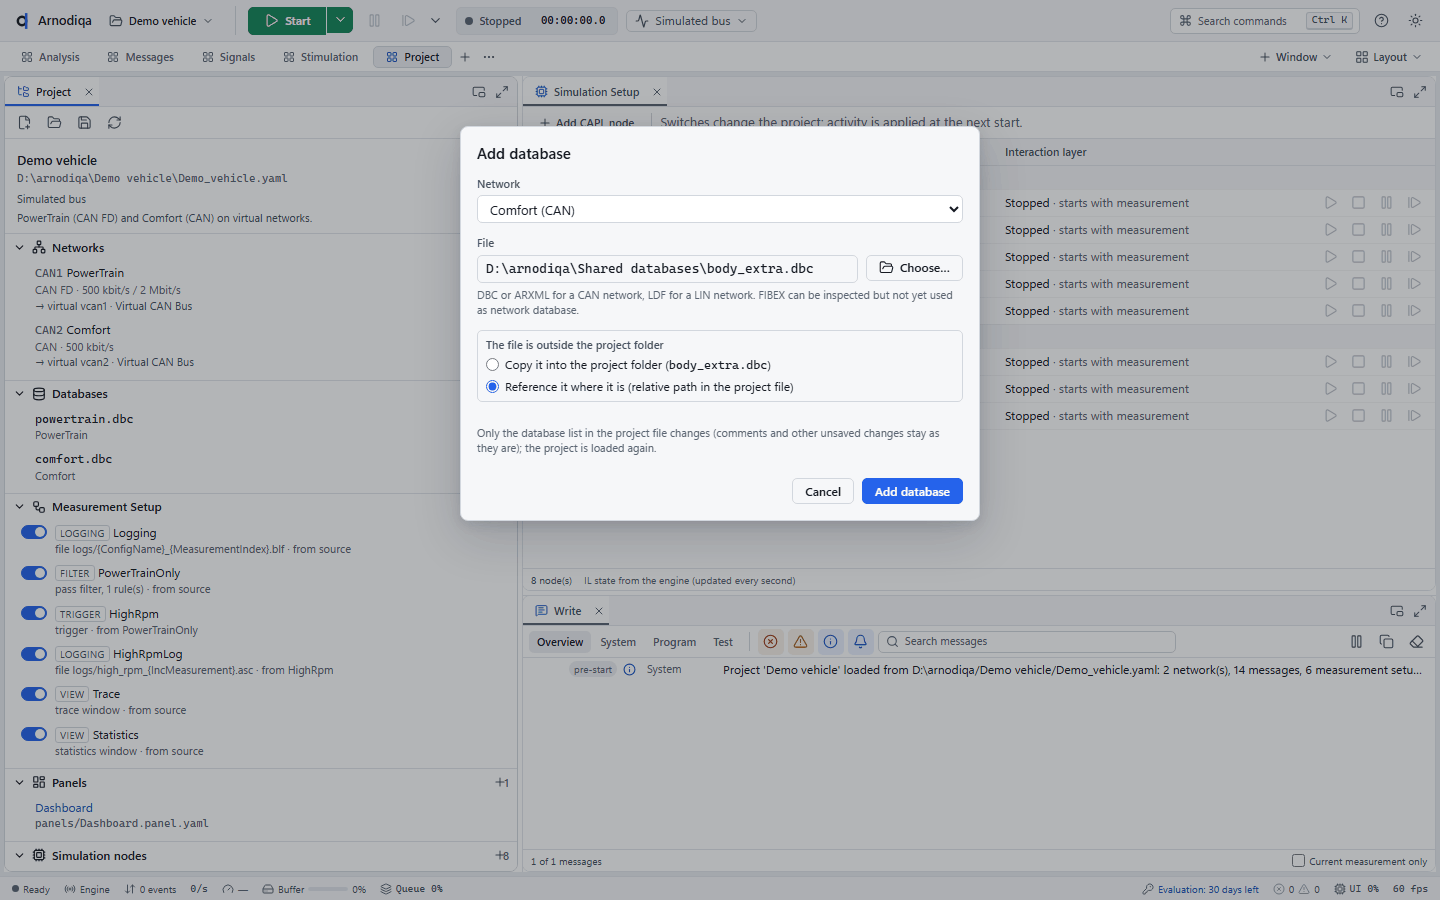
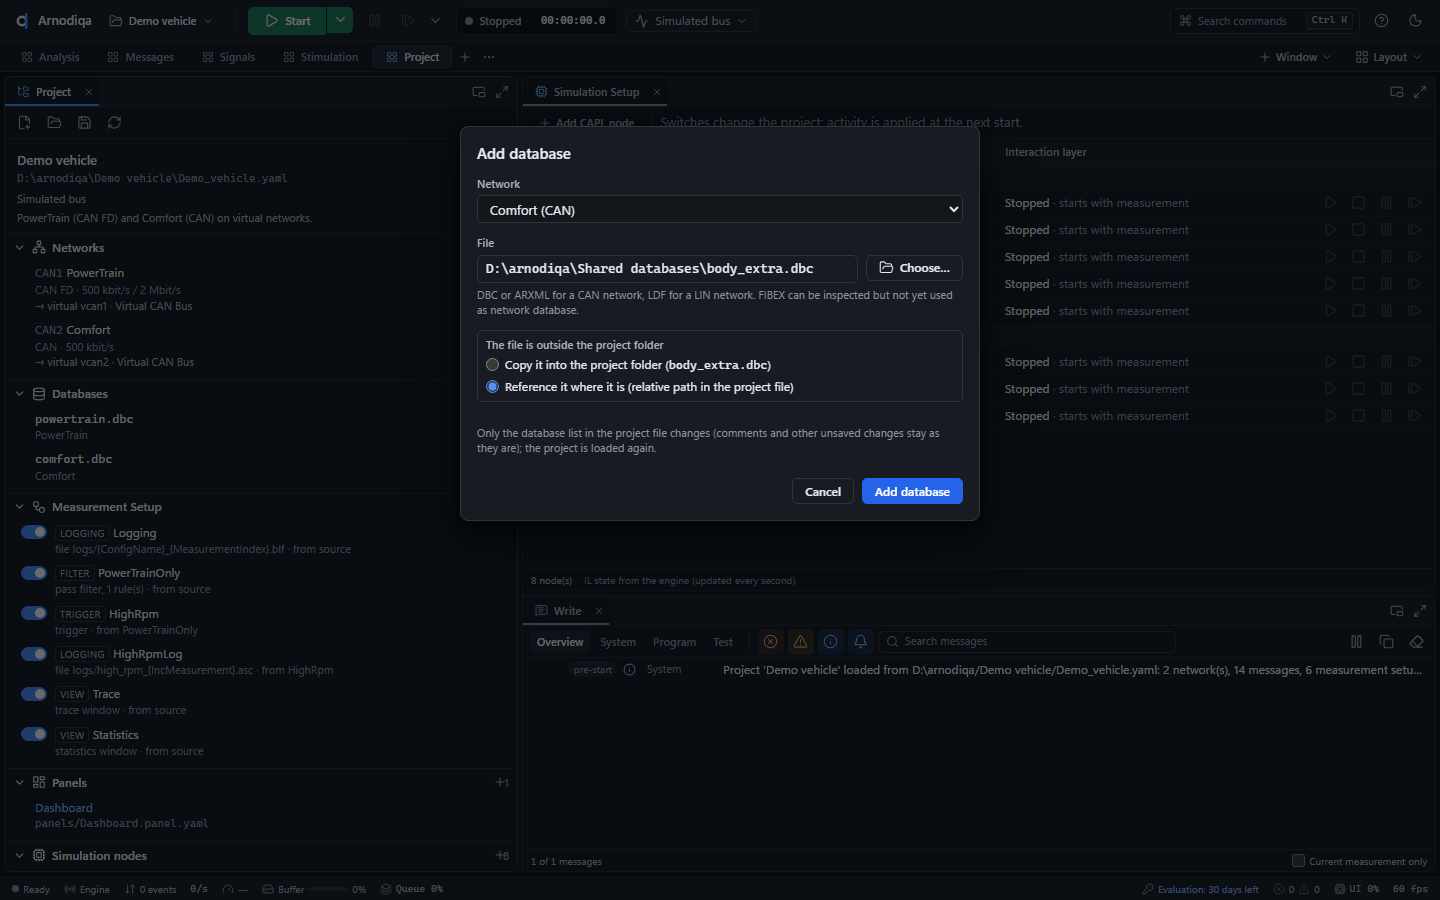
Een database toevoegen: klik op de + rechts naast Databases of op de + bij een netwerk. Kies in Add database het netwerk (hier Comfort), klik op Choose… en kies een DBC-, LDF- (voor een LIN-netwerk), ARXML- of FIBEX-bestand.To add a database, click the + to the right of Databases or the + next to a network. In Add database, choose the network (here Comfort), click Choose… and select a DBC, LDF (for a LIN network), ARXML or FIBEX file.Pour ajouter une base de données, cliquez sur le + à droite de Databases ou sur le + à côté d'un réseau. Dans Add database, choisissez le réseau (ici Comfort), cliquez sur Choose… et sélectionnez un fichier DBC, LDF (pour un réseau LIN), ARXML ou FIBEX.
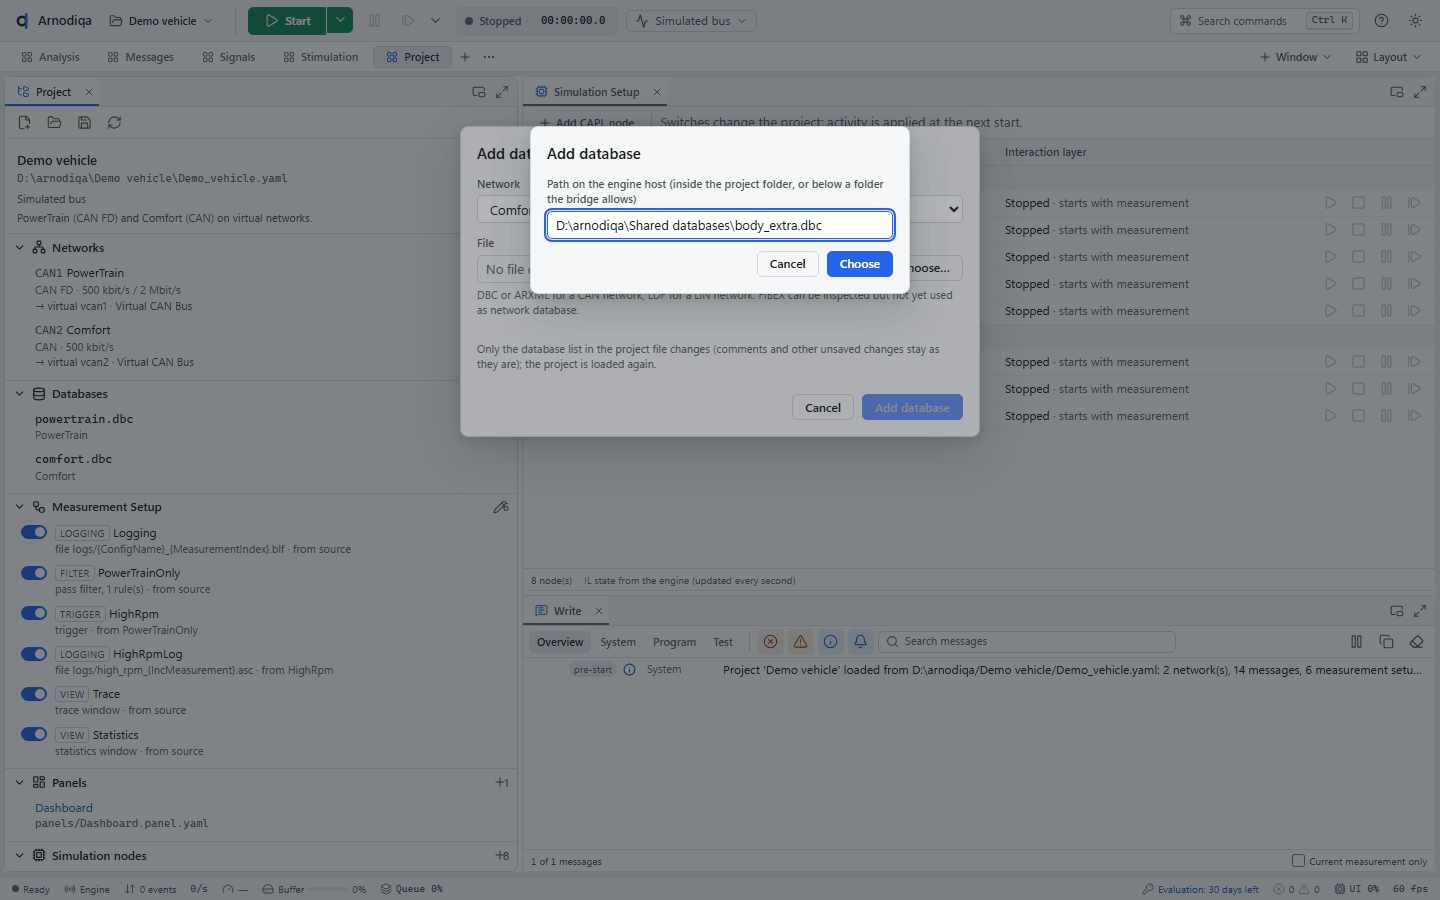
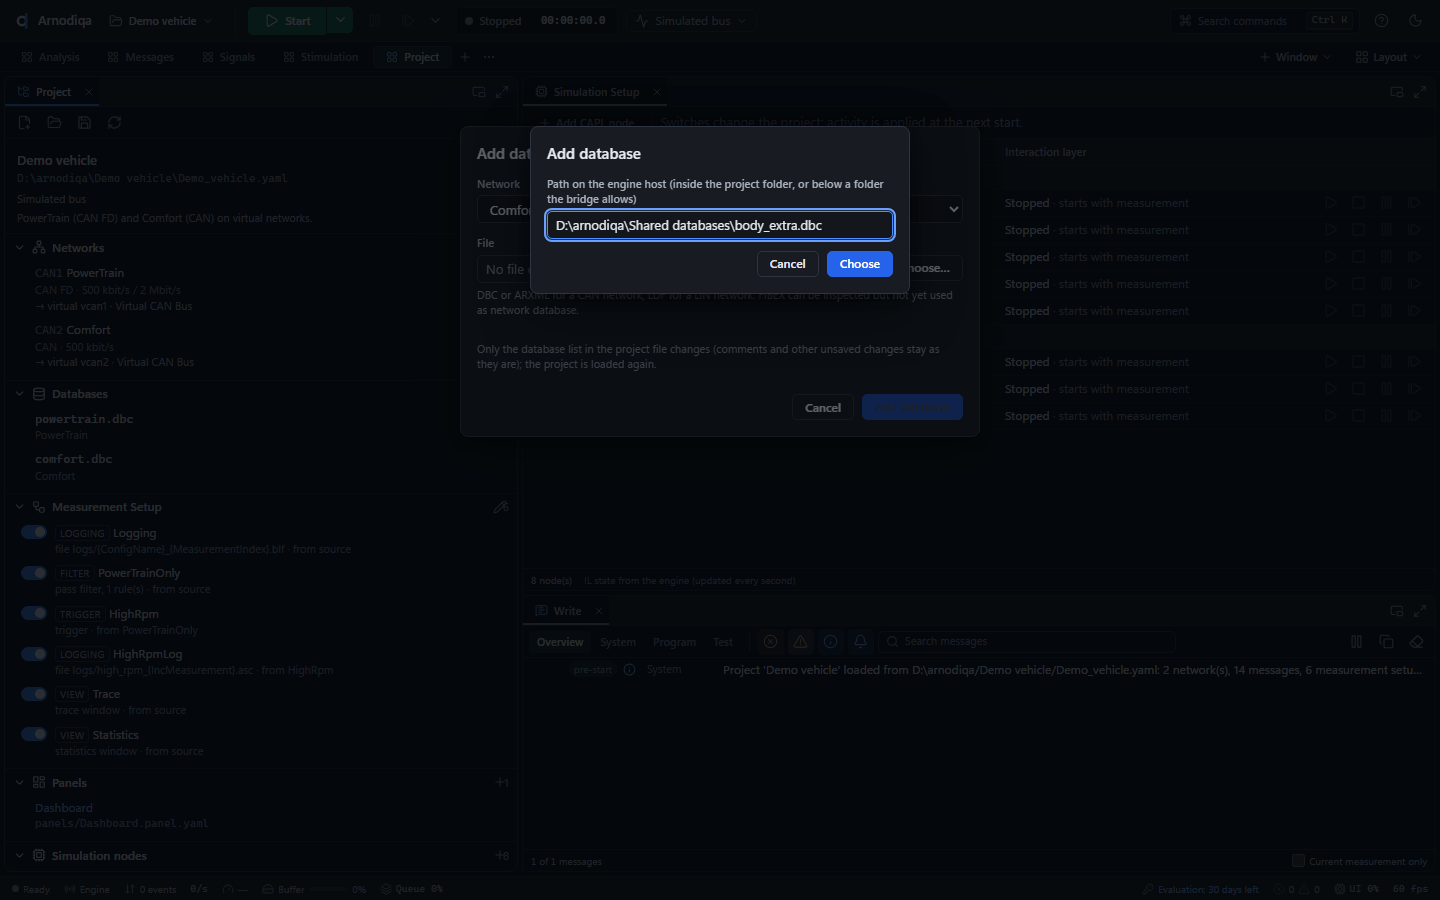
Staat het bestand buiten de projectmap, dan kies je Copy it into the project folder (een kopie naast het projectbestand) of Reference it where it is (het project verwijst relatief naar het bestand, bijvoorbeeld ../Shared databases/body_extra.dbc). Klik op Add database.If the file is outside the project folder, choose Copy it into the project folder (a copy next to the project file) or Reference it where it is (the project refers to the file with a relative path, for example ../Shared databases/body_extra.dbc). Click Add database.Si le fichier se trouve hors du dossier du projet, choisissez Copy it into the project folder (une copie à côté du fichier de projet) ou Reference it where it is (le projet désigne le fichier par un chemin relatif, par exemple ../Shared databases/body_extra.dbc). Cliquez sur Add database.
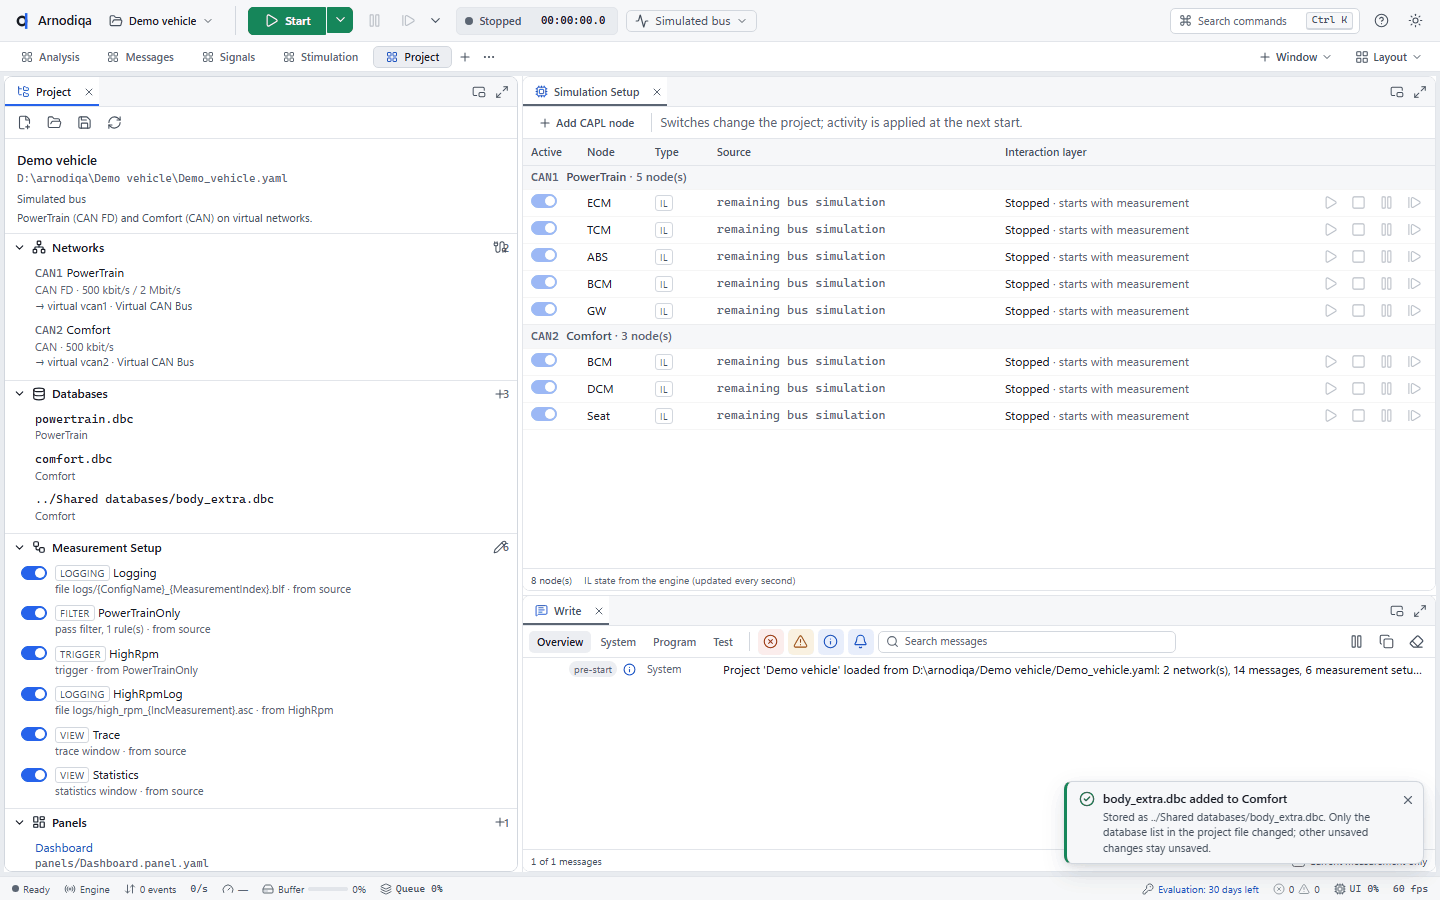
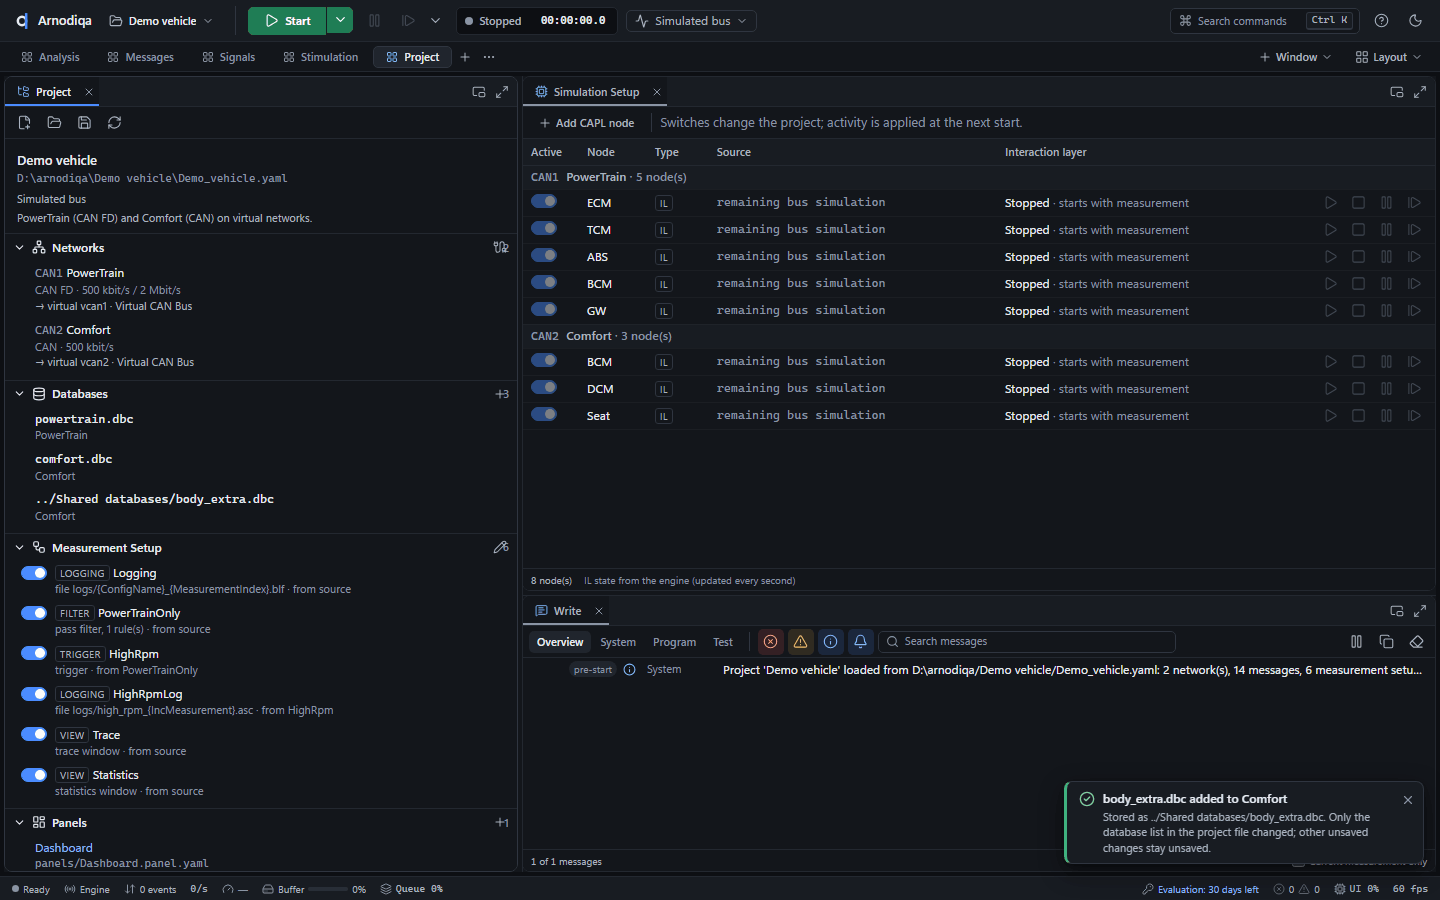
Arnodiqa slaat het project op en laadt het opnieuw: de database staat onder Databases bij Comfort, en Trace, Data en Graphics kennen de berichten ervan meteen.Arnodiqa saves and reloads the project: the database appears under Databases for Comfort, and Trace, Data and Graphics know its messages immediately.Arnodiqa enregistre puis recharge le projet : la base de données apparaît sous Databases pour Comfort, et Trace, Data et Graphics connaissent aussitôt ses messages.
Hardware kiezen of de virtuele bus gebruikenSelect hardware or use the virtual busChoisir le matériel ou utiliser le bus virtuel
Elk netwerk van het project wordt aan een kanaal toegewezen: een kanaal van een interface of van de virtuele bus.Each network of the project is assigned to a channel: a channel of an interface or of the virtual bus.Chaque réseau du projet est affecté à un canal : un canal d'une interface ou du bus virtuel.
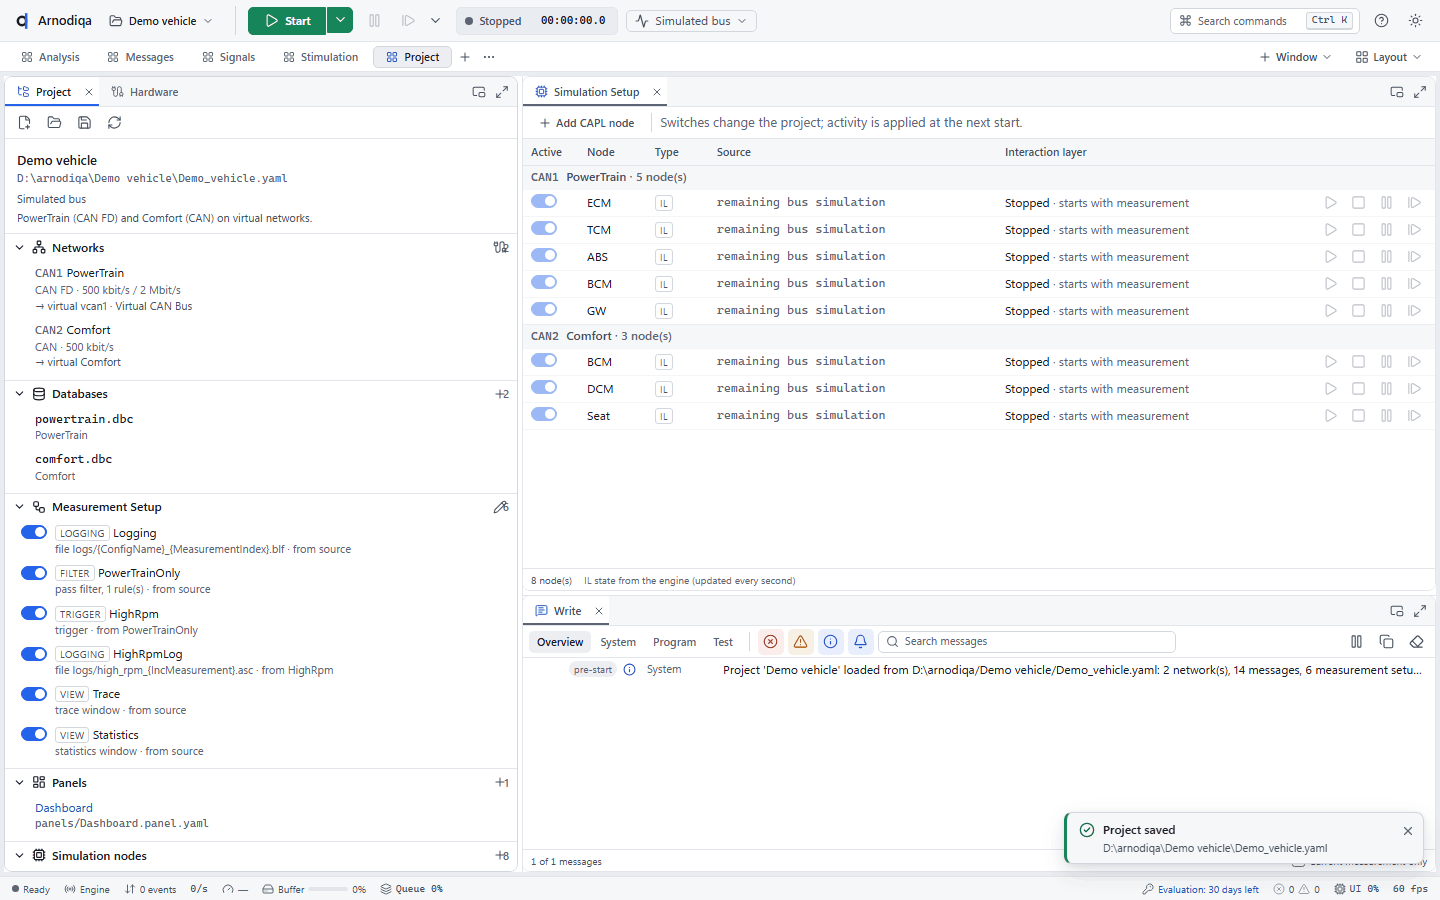
Op de desktop Project toont de projectverkenner onder Networks per netwerk de toewijzing, bijvoorbeeld → virtual vcan1 · Virtual CAN Bus. Klik op het pictogram Hardware configuration rechts naast Networks.On the Project desktop, the project explorer shows the assignment of each network under Networks, for example → virtual vcan1 · Virtual CAN Bus. Click the Hardware configuration icon to the right of Networks.Sur le desktop Project, l'explorateur de projet indique sous Networks l'affectation de chaque réseau, par exemple → virtual vcan1 · Virtual CAN Bus. Cliquez sur l'icône Hardware configuration à droite de Networks.
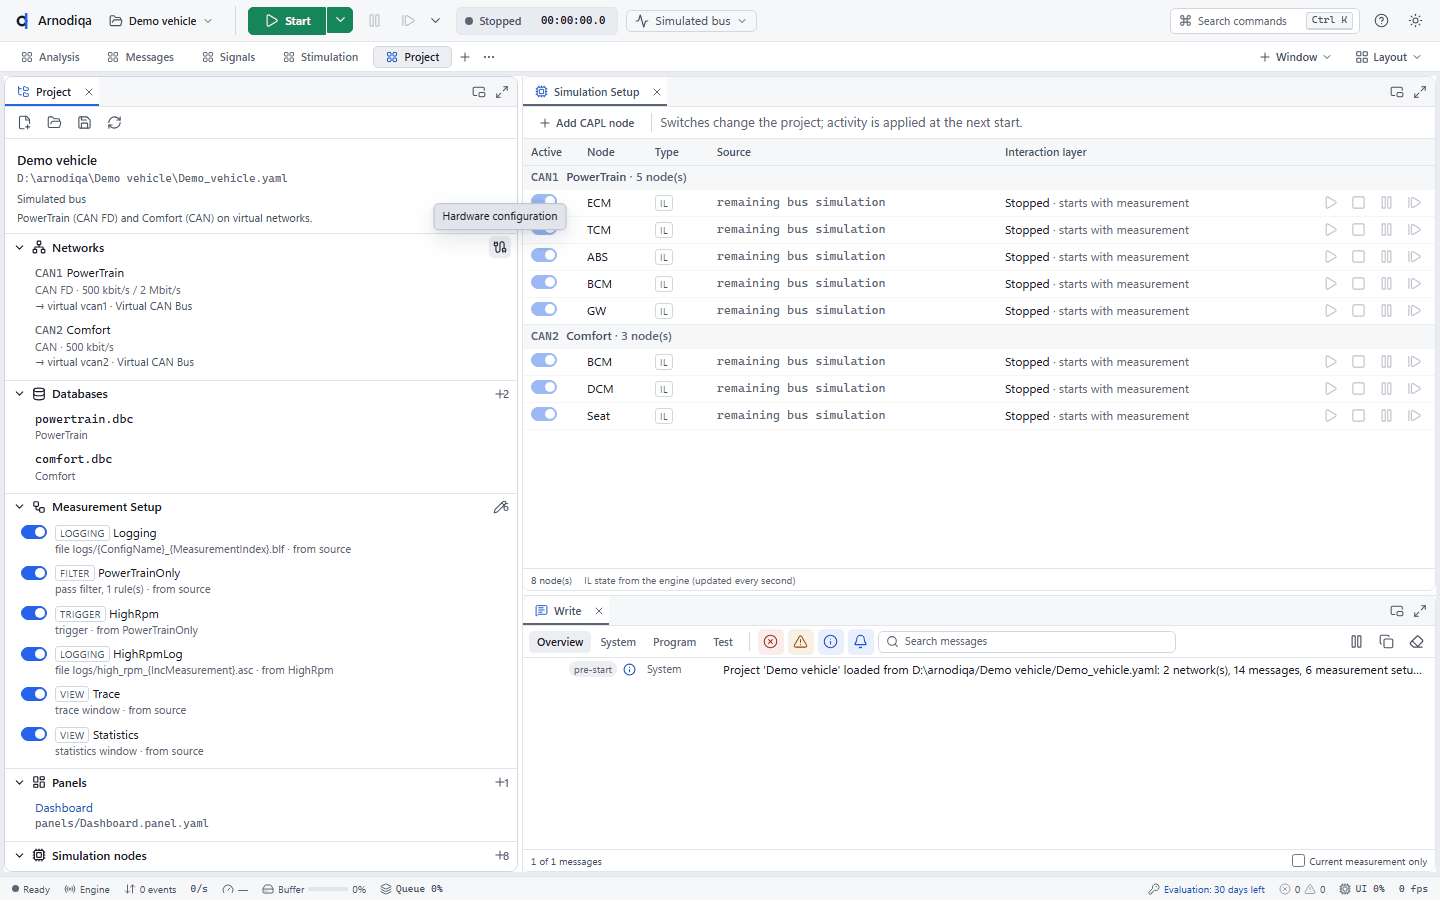
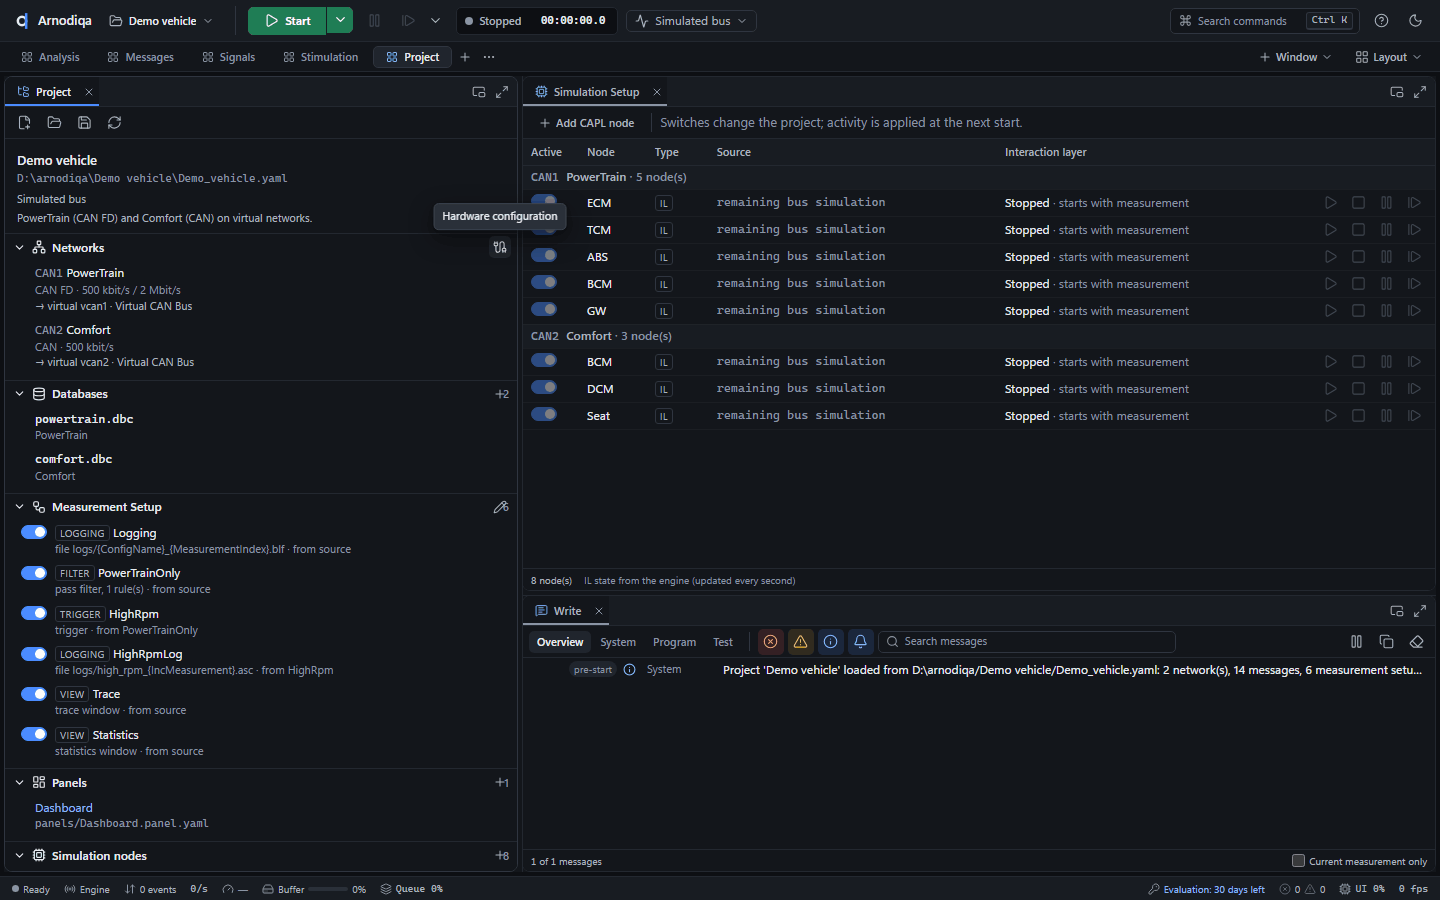
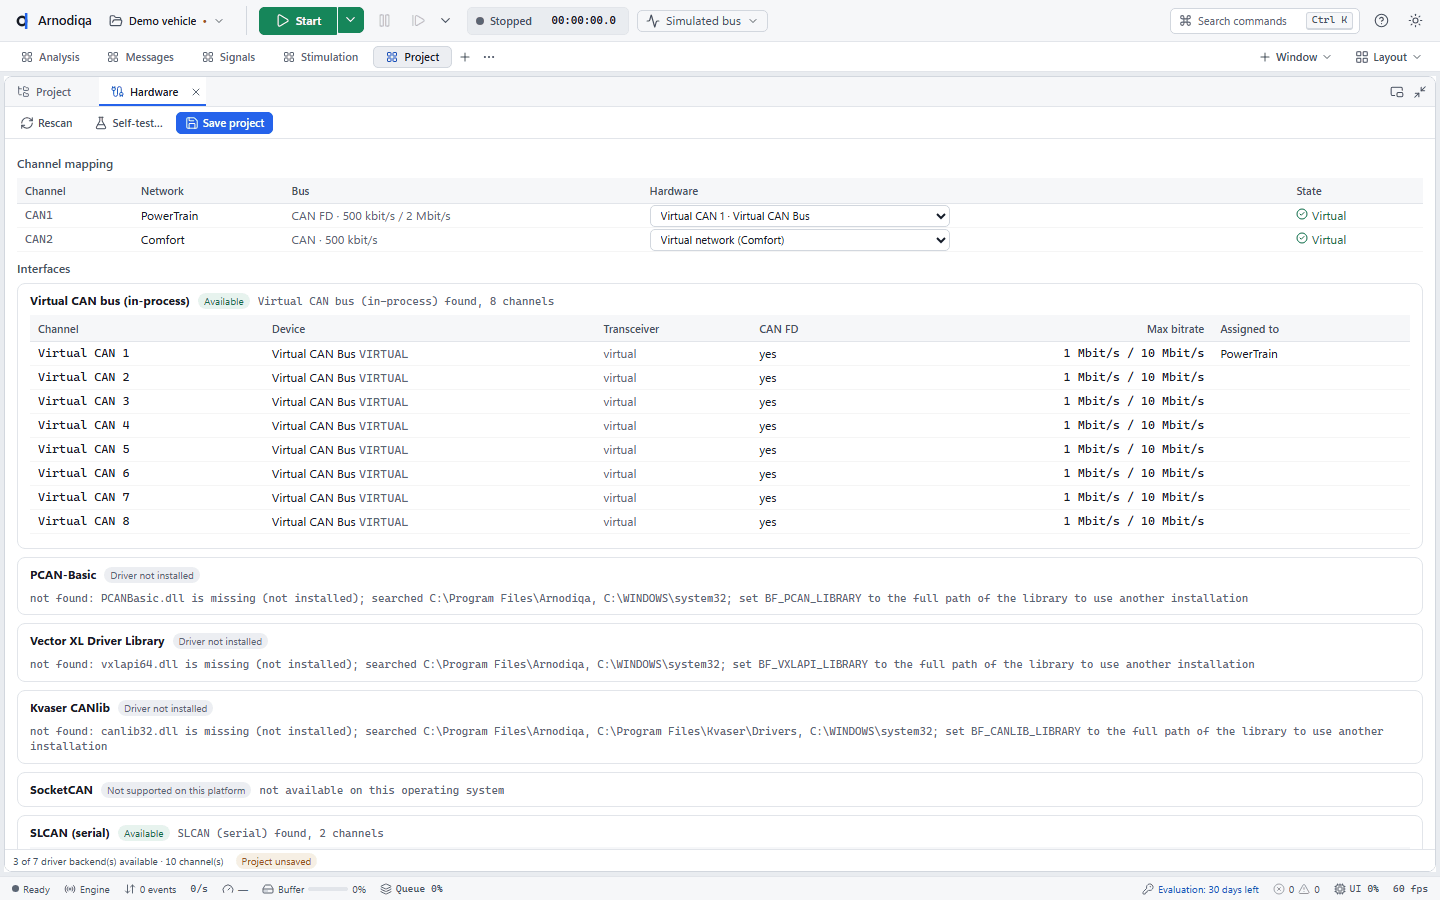
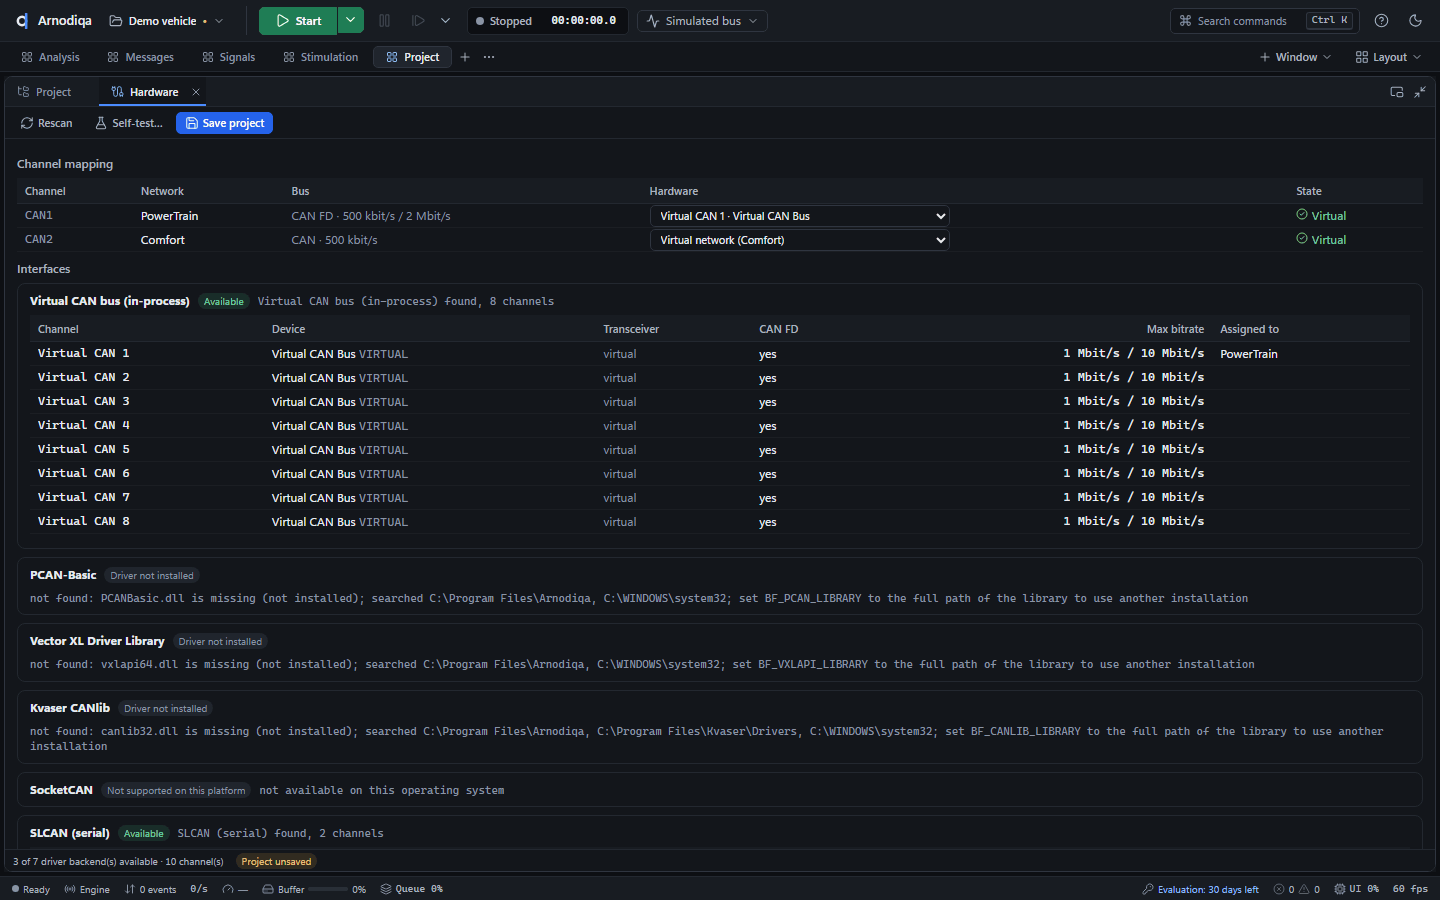
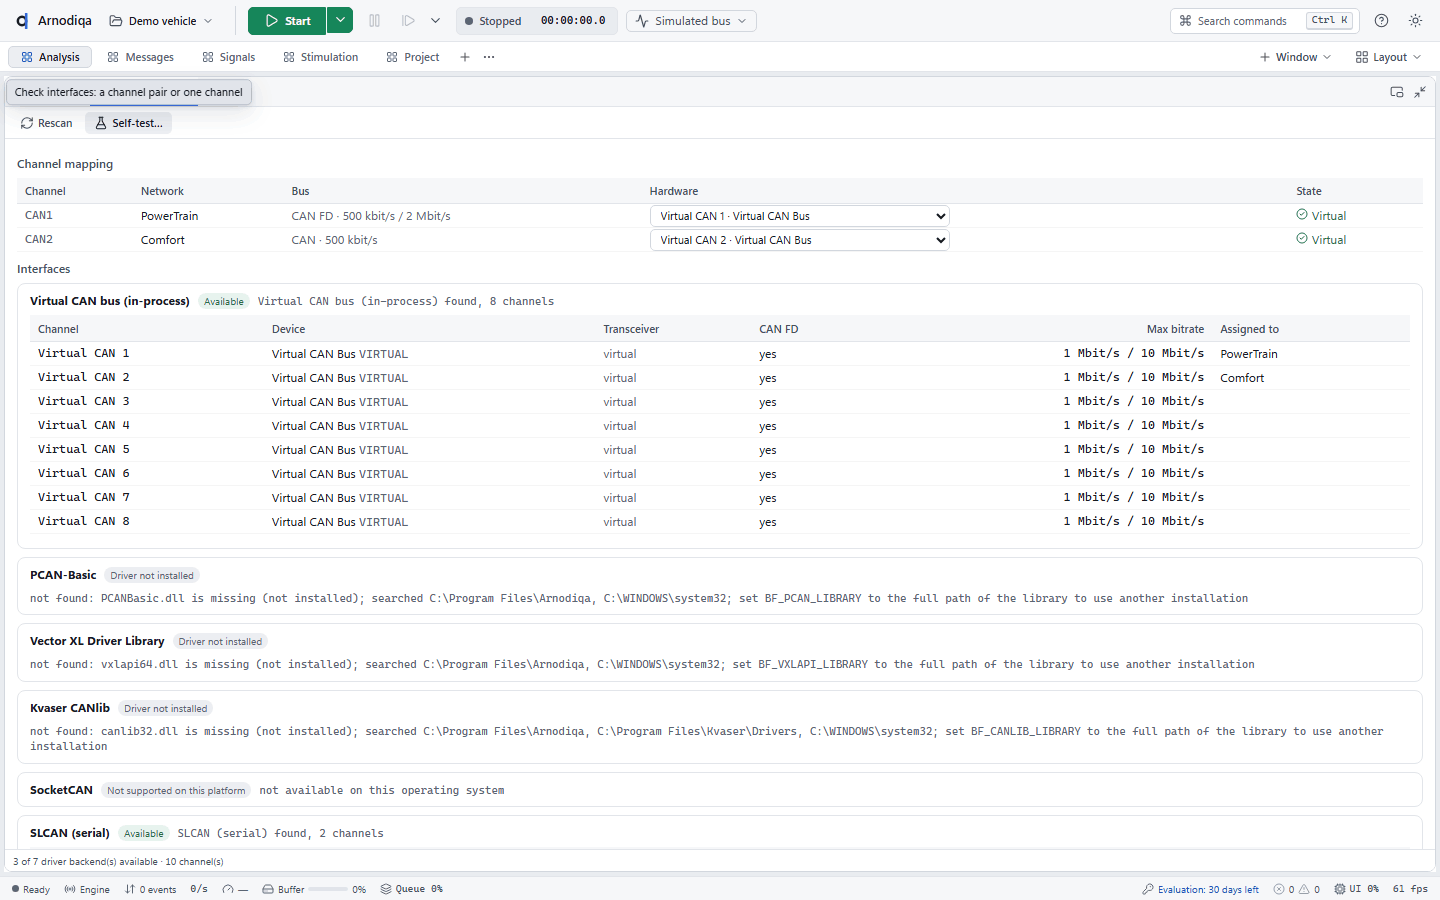
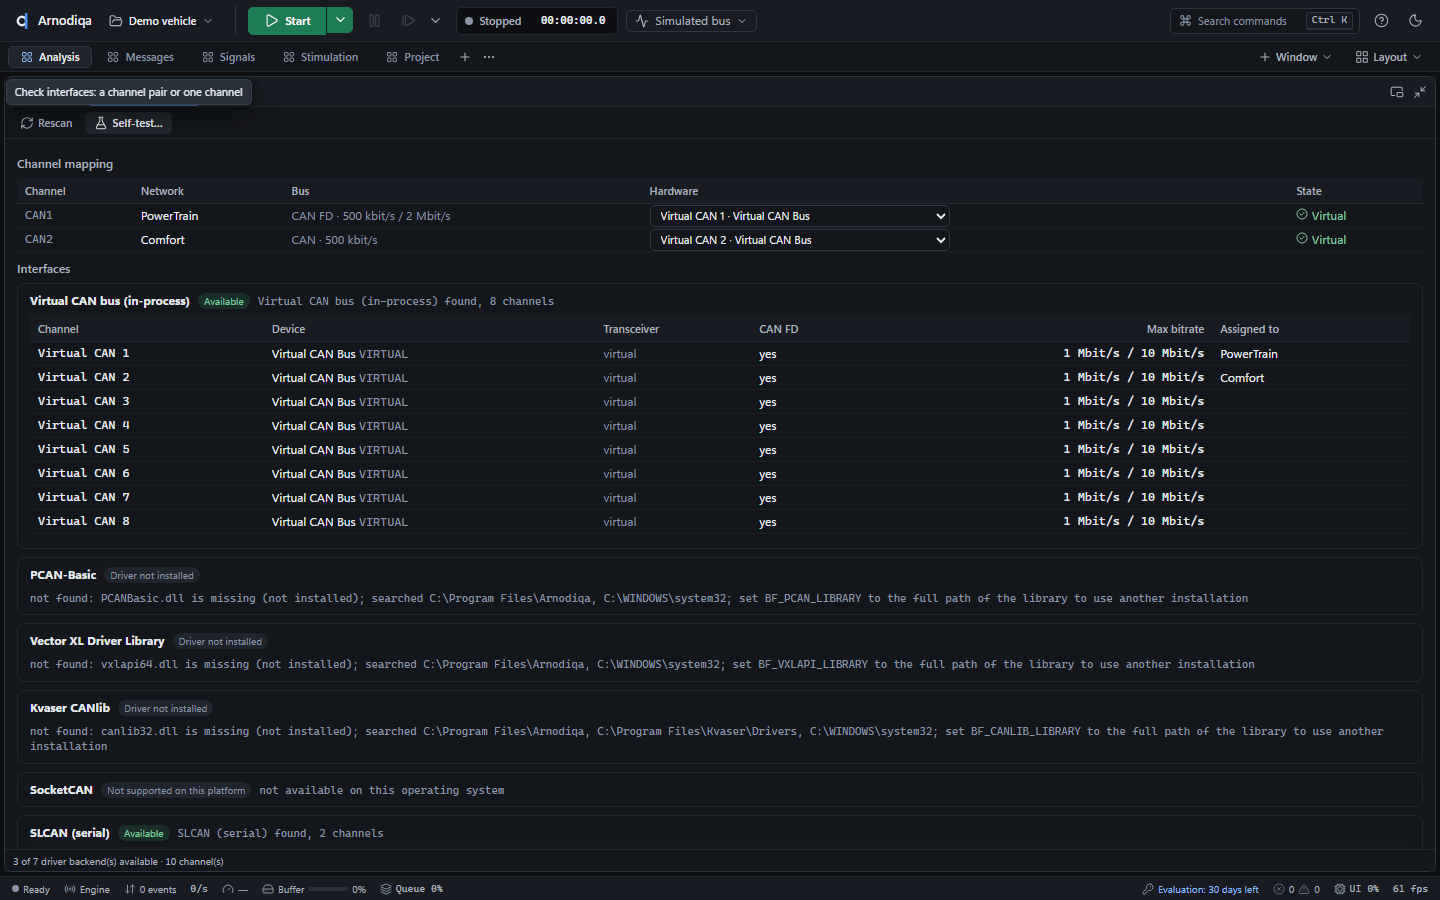
Het venster Hardware toont onder Channel mapping per netwerk het kanaal (kolom Hardware) en de status, en onder Interfaces per driver of die beschikbaar is en welke kanalen hij vond. Klik op Rescan nadat je een interface hebt aangesloten.The Hardware window shows, under Channel mapping, the channel (column Hardware) and status of each network, and under Interfaces, for each driver whether it is available and which channels it found. Click Rescan after connecting an interface.La fenêtre Hardware affiche sous Channel mapping le canal (colonne Hardware) et l'état de chaque réseau, et sous Interfaces, pour chaque pilote, s'il est disponible et quels canaux il a trouvés. Cliquez sur Rescan après avoir branché une interface.
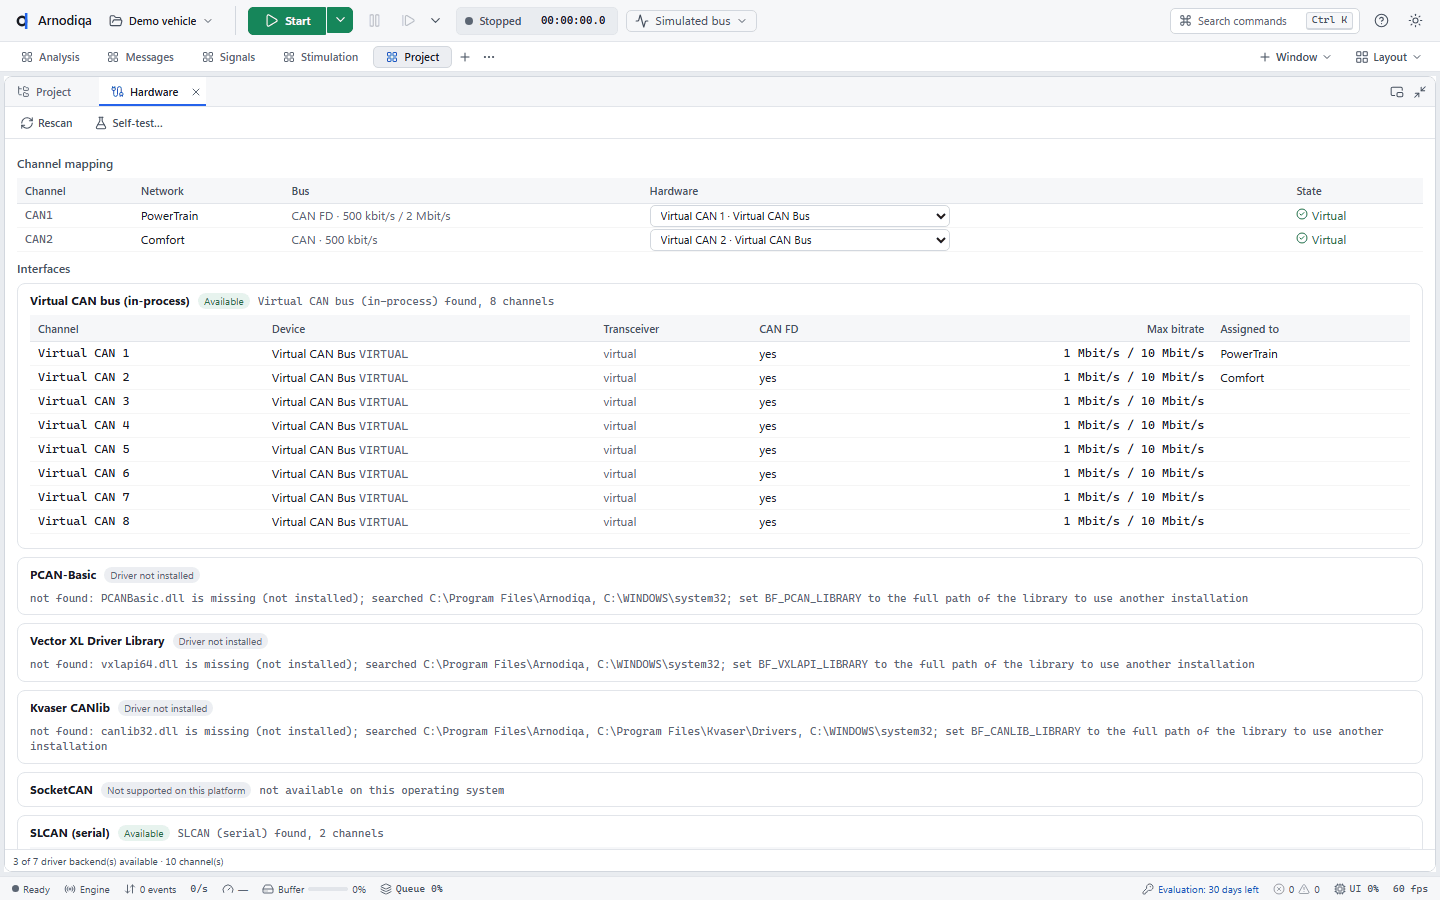
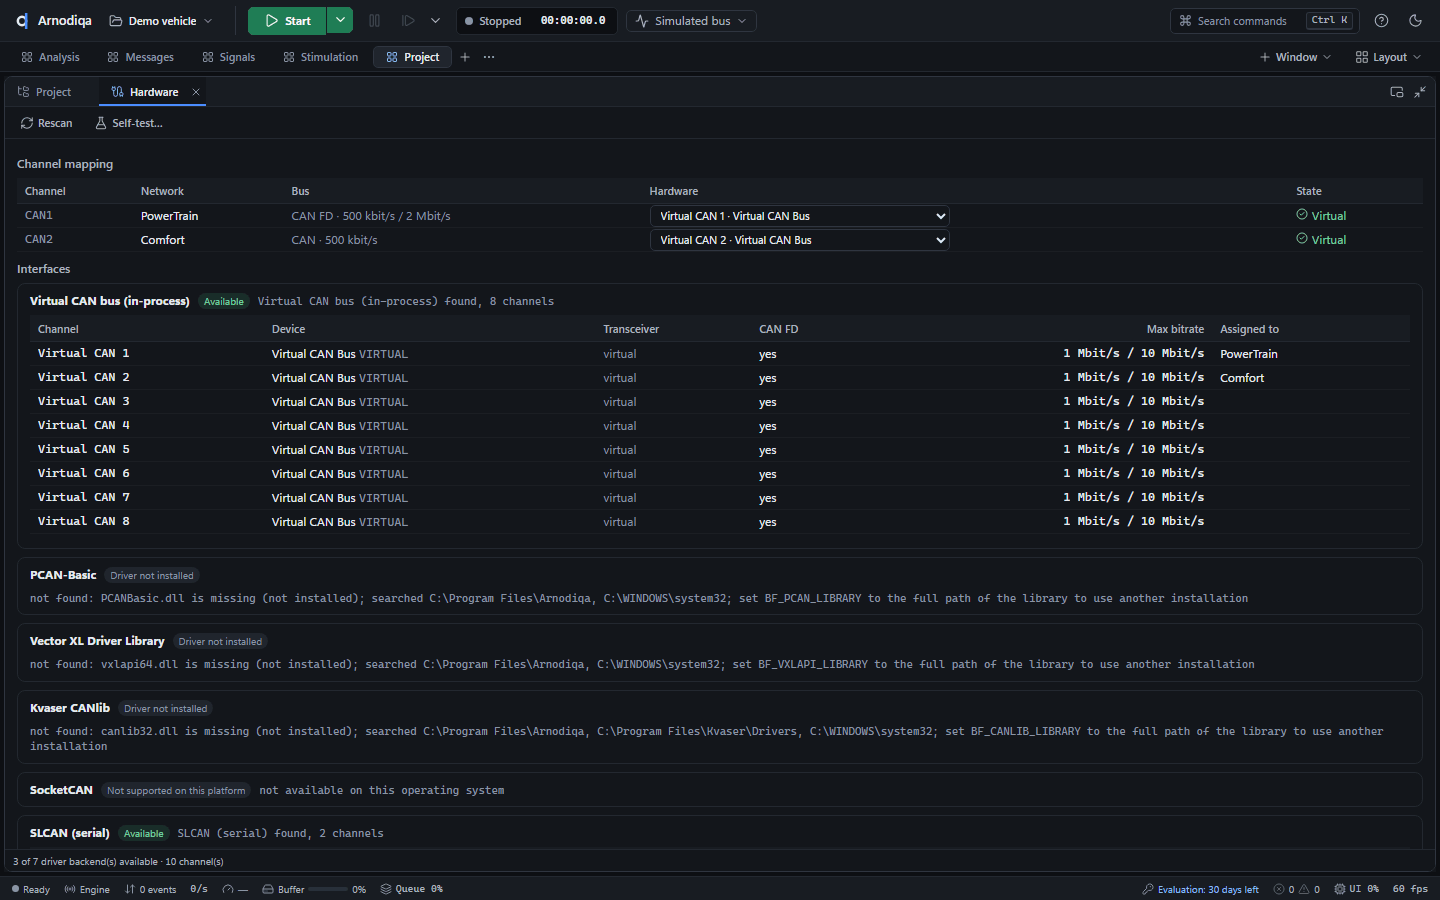
Kies per netwerk in de keuzelijst onder Hardware een kanaal van een aangesloten interface, een kanaal van de virtuele bus (Virtual CAN 1 …) of Virtual network (Comfort). De toewijzing geldt meteen; klik op Save project om het projectbestand bij te werken.For each network, choose in the list under Hardware a channel of a connected interface, a channel of the virtual bus (Virtual CAN 1 …) or Virtual network (Comfort). The assignment applies immediately; click Save project to update the project file.Pour chaque réseau, choisissez dans la liste sous Hardware un canal d'une interface connectée, un canal du bus virtuel (Virtual CAN 1 …) ou Virtual network (Comfort). L'affectation s'applique immédiatement ; cliquez sur Save project pour mettre à jour le fichier de projet.
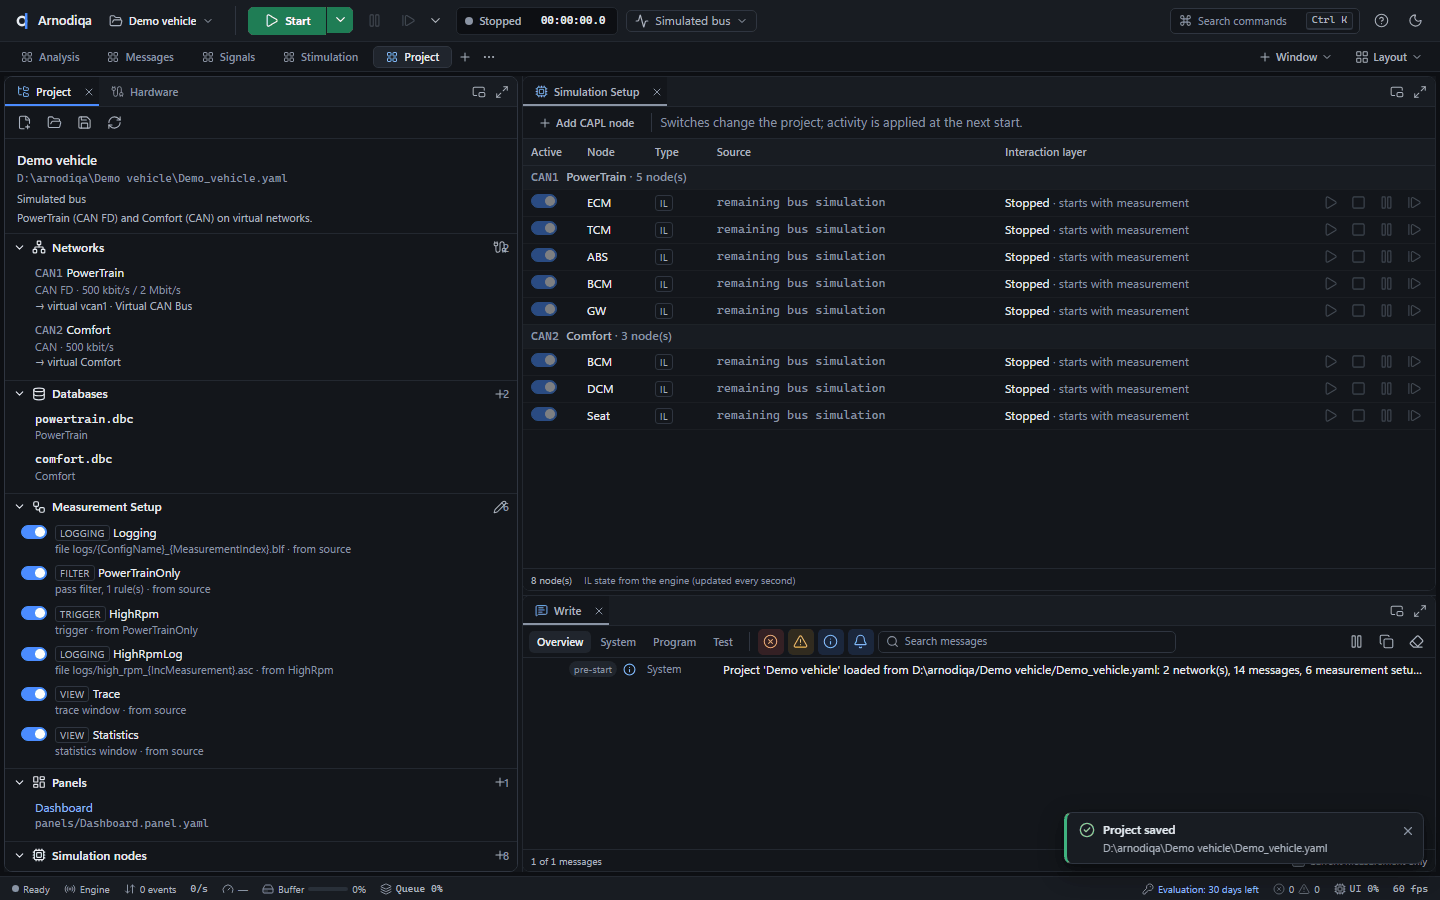
De projectverkenner toont de nieuwe toewijzing bij het netwerk (→ virtual Comfort). Een kanaal dat bij de start niet gevonden wordt, staat daar als not connected.The project explorer shows the new assignment next to the network (→ virtual Comfort). A channel that is not found at start is shown there as not connected.L'explorateur de projet affiche la nouvelle affectation à côté du réseau (→ virtual Comfort). Un canal introuvable au démarrage y apparaît comme not connected.
Een meting starten en stoppenStart and stop a measurementDémarrer et arrêter une mesure
Toolbar, statusbalk en het venster Statistics tonen de toestand van de meting en de busload.The toolbar, status bar and the Statistics window show the state of the measurement and the bus load.La barre d'outils, la barre d'état et la fenêtre Statistics indiquent l'état de la mesure et la charge de bus.
Klik op Start in de toolbar of druk op F9. Met het pijltje naast Start kies je Start measurement without logging.Click Start in the toolbar or press F9. The arrow next to Start offers Start measurement without logging.Cliquez sur Start dans la barre d'outils ou appuyez sur F9. La flèche à côté de Start propose Start measurement without logging.
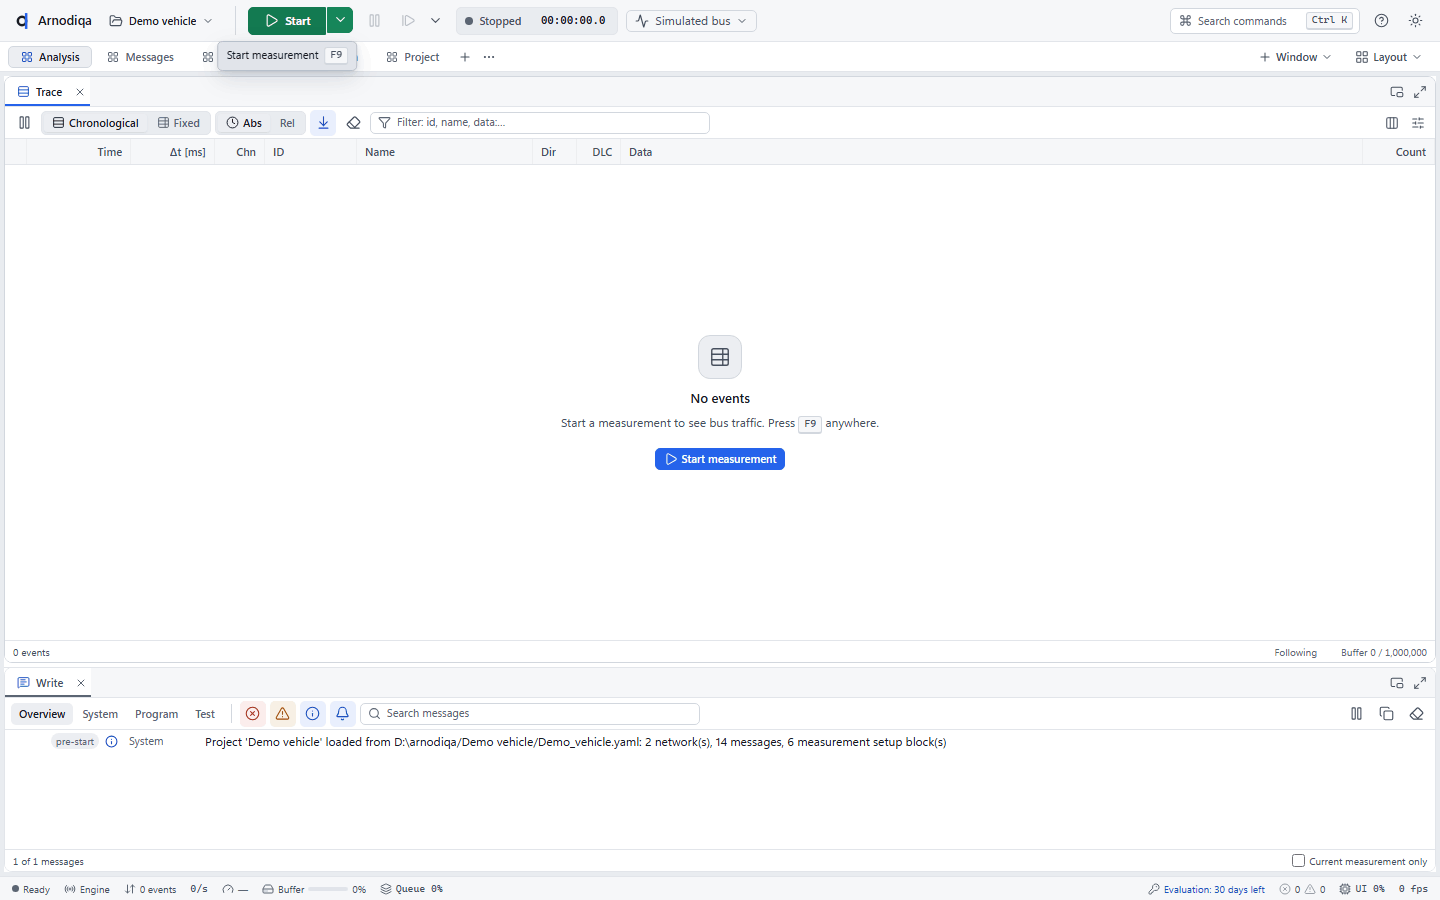
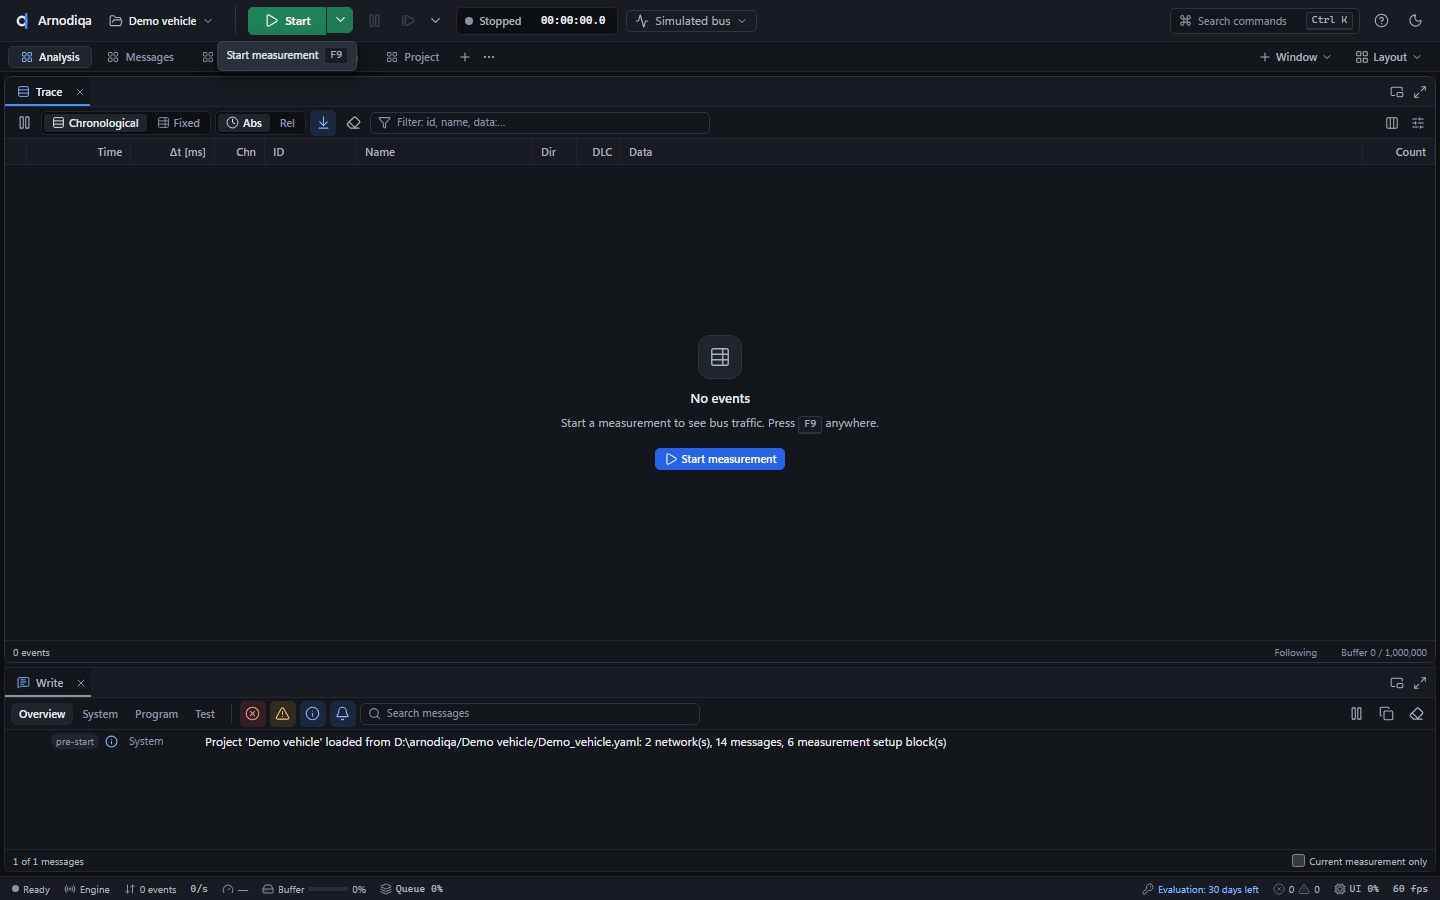
Tijdens de meting staat de status op Running met de meettijd ernaast, en daarnaast de busload per kanaal. De Trace vult zich. De statusbalk onderaan toont het aantal events, de events per seconde en de buffervulling.During the measurement the state shows Running with the measurement time, followed by the bus load per channel. The Trace fills up. The status bar at the bottom shows the number of events, events per second and the buffer level.Pendant la mesure, l'état indique Running avec la durée de mesure, puis la charge de bus par canal. La Trace se remplit. La barre d'état en bas affiche le nombre d'événements, les événements par seconde et le remplissage du tampon.
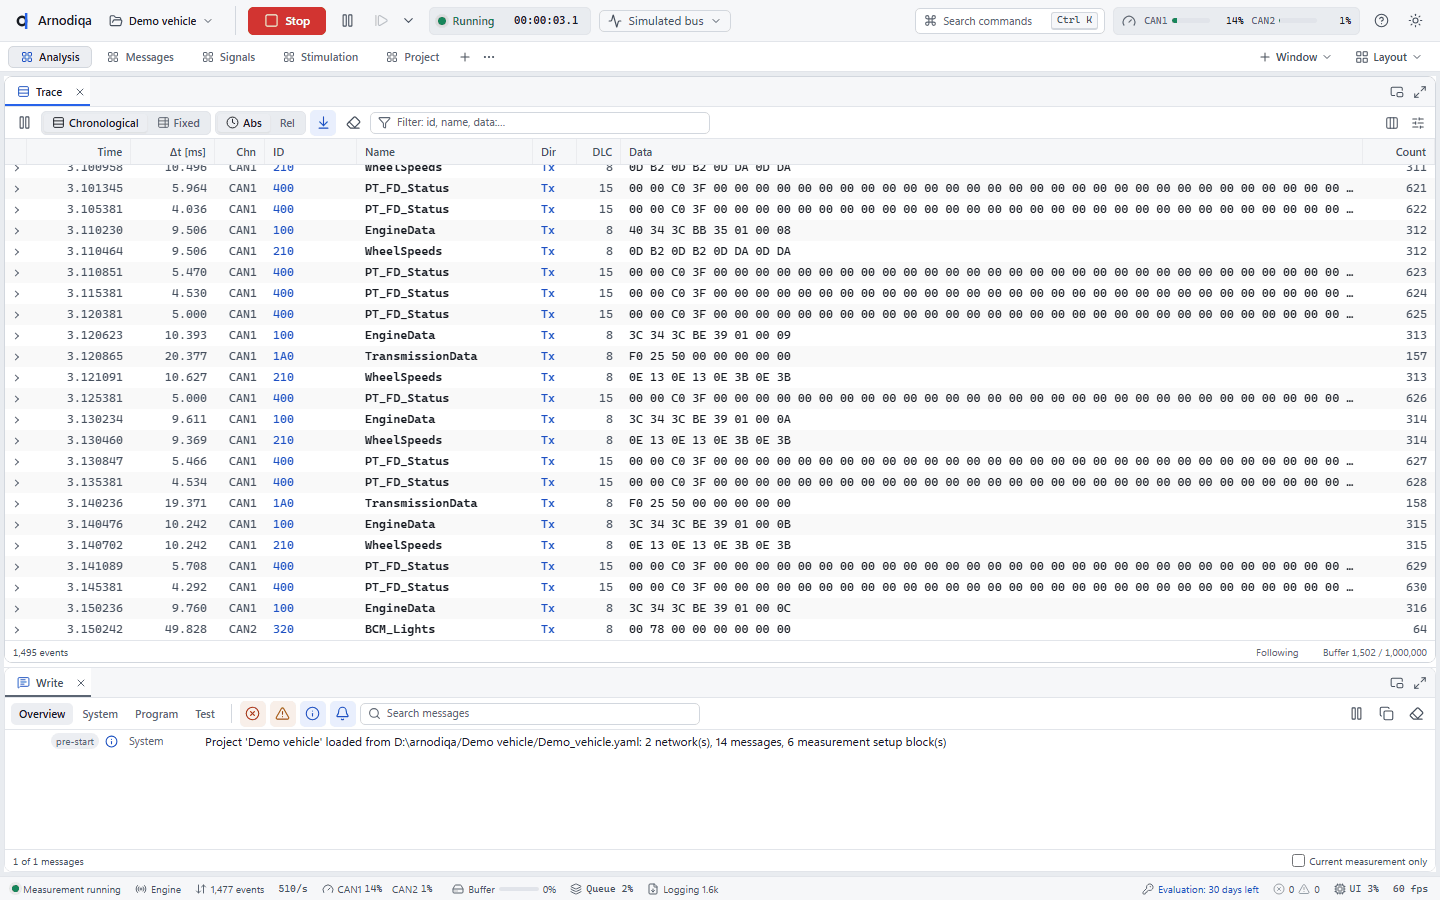
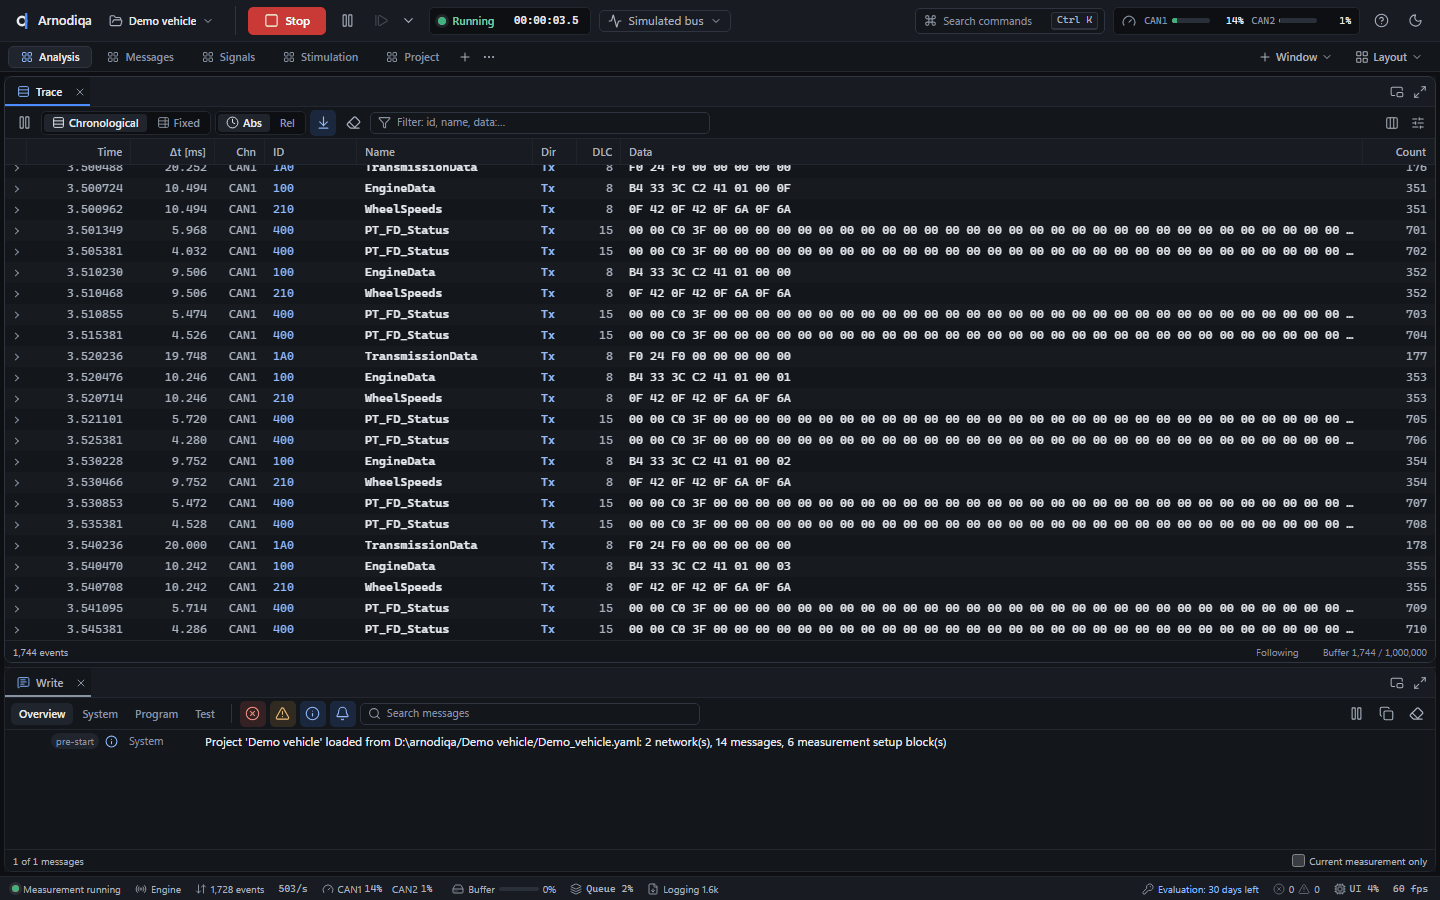
De busload staat in de toolbar en in de statusbalk. Meer detail geeft het venster Statistics op de desktop Signals: per kanaal Busload [%], Peak load [%], frames per seconde en de framecounters. Alle drie gebruiken dezelfde berekening over een venster van één seconde.The bus load appears in the toolbar and in the status bar. The Statistics window on the Signals desktop gives more detail: per channel Busload [%], Peak load [%], frames per second and the frame counters. All three use the same calculation over a one-second window.La charge de bus apparaît dans la barre d'outils et dans la barre d'état. La fenêtre Statistics du desktop Signals donne plus de détails : par canal Busload [%], Peak load [%], les trames par seconde et les compteurs de trames. Les trois affichages utilisent le même calcul sur une fenêtre d'une seconde.
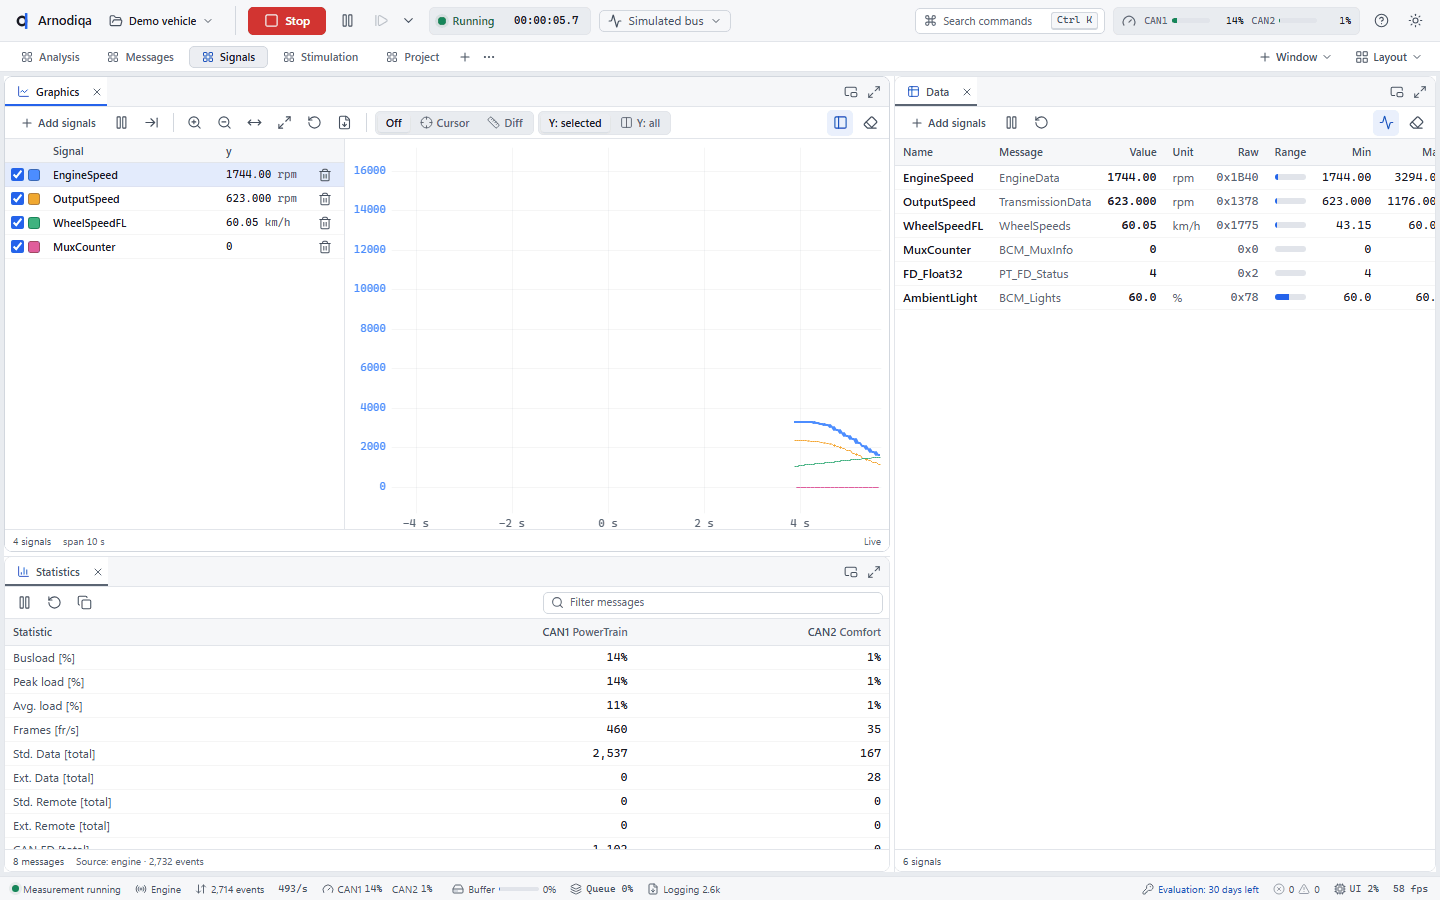
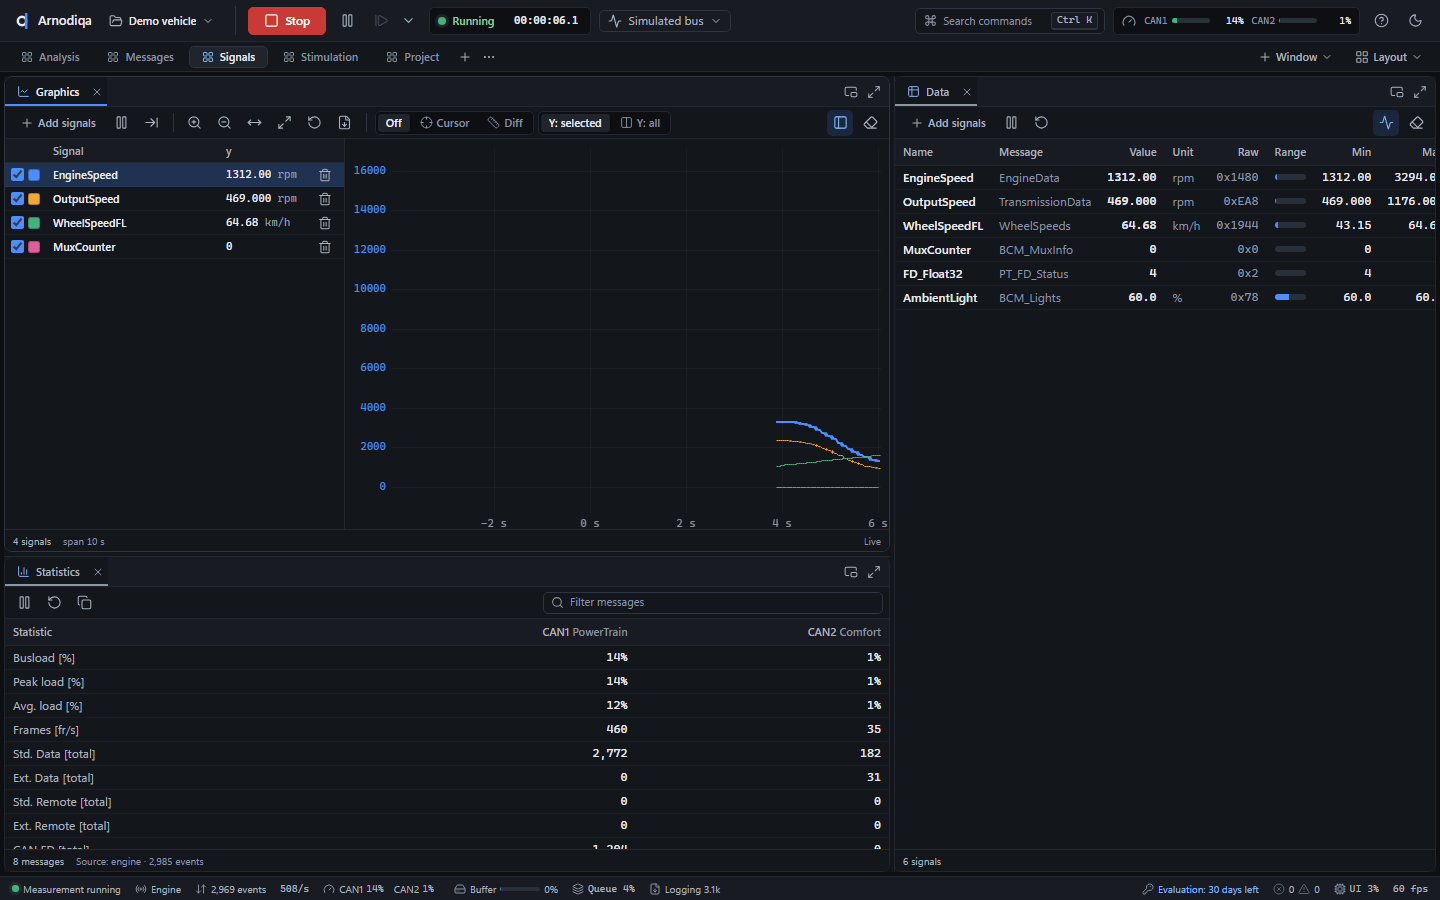
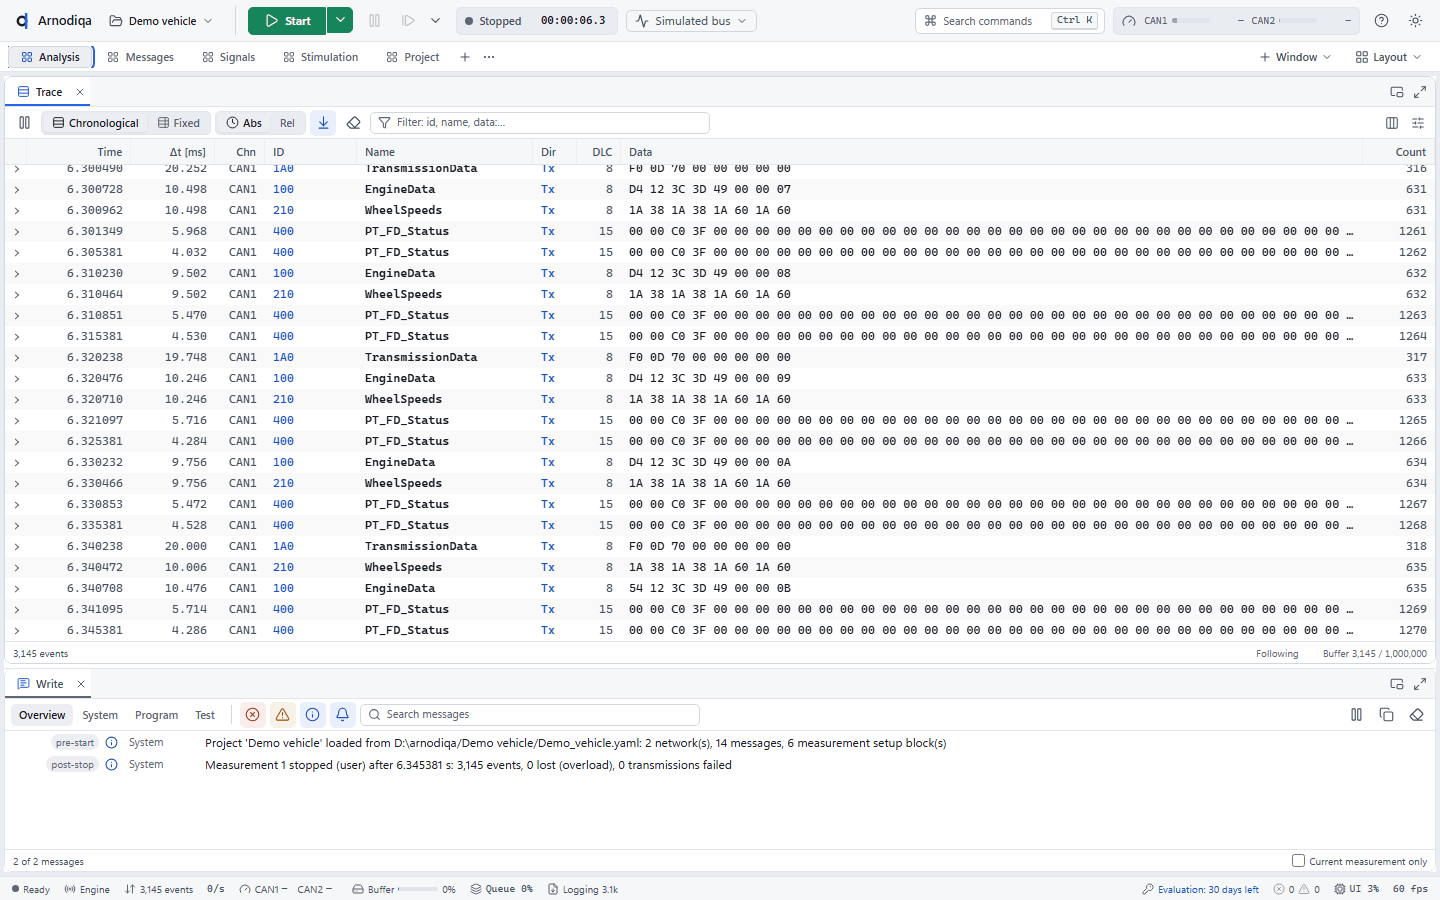
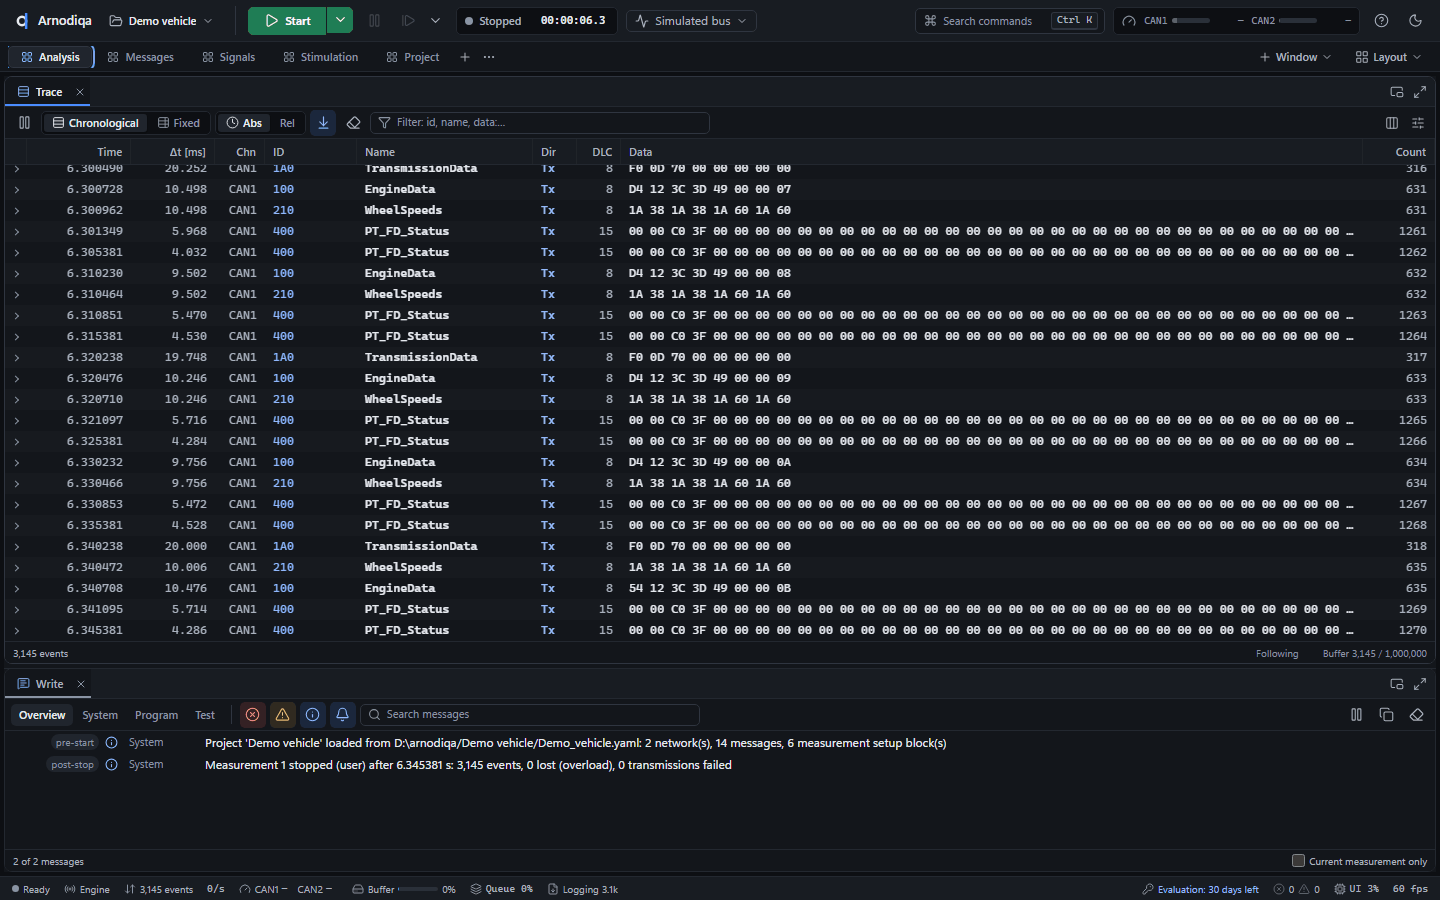
Stop de meting met Stop of met Esc. Het Write-venster meldt Measurement 1 stopped (user) after … s.Stop the measurement with Stop or Esc. The Write window reports Measurement 1 stopped (user) after … s.Arrêtez la mesure avec Stop ou Échap. La fenêtre Write affiche Measurement 1 stopped (user) after … s.
De Trace: modi, filteren, signalen en exportThe Trace: modes, filtering, signals and exportLa Trace : modes, filtrage, signaux et export
De Trace toont elk frame en elk busevent, gedecodeerd met de databases van het project.The Trace shows every frame and bus event, decoded with the project's databases.La Trace affiche chaque trame et chaque événement de bus, décodés avec les bases de données du projet.
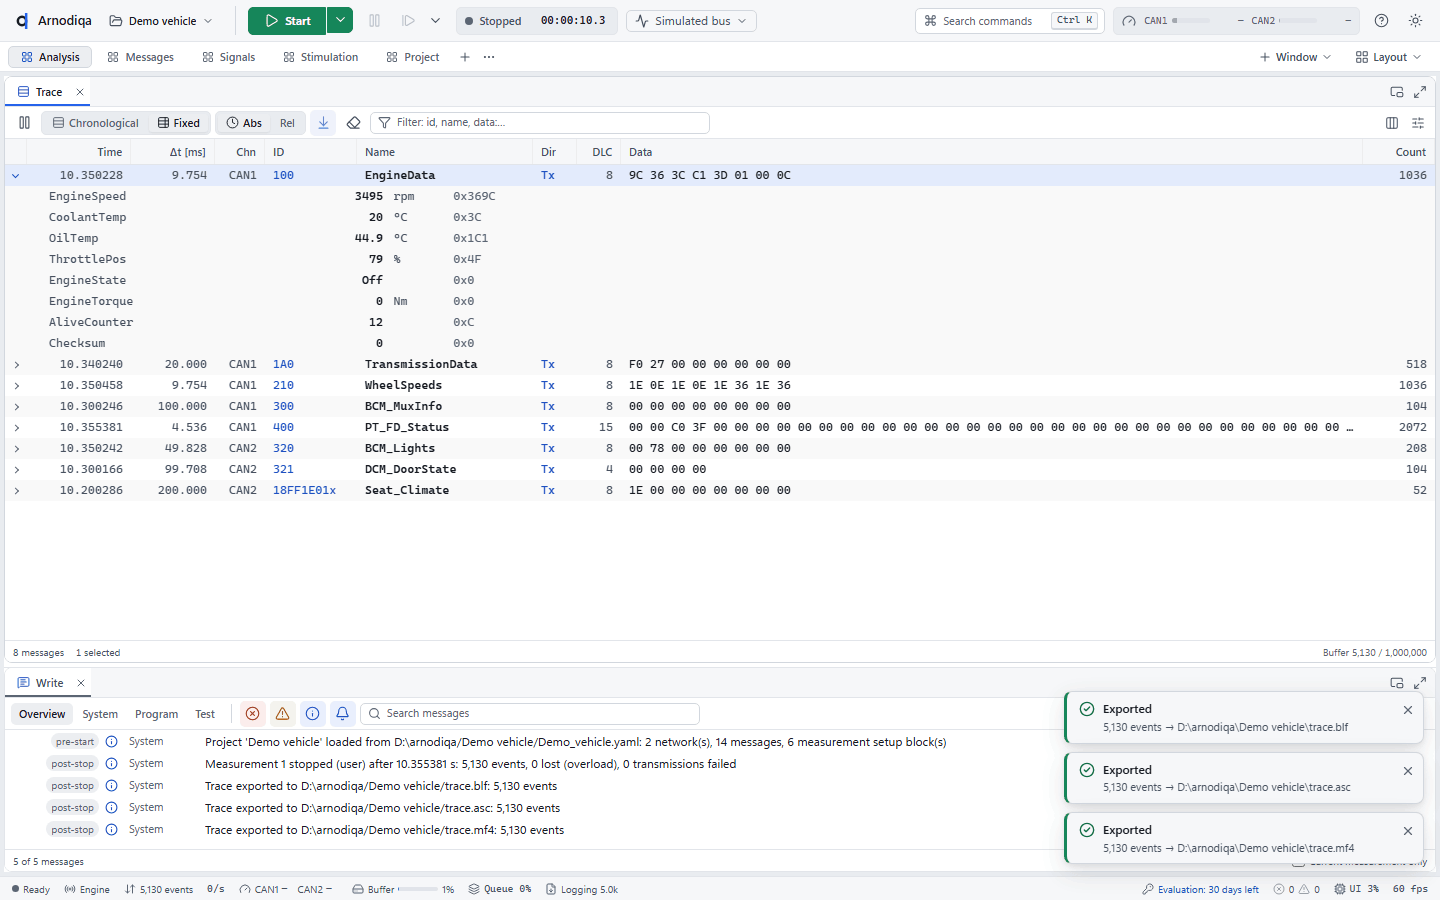
De Trace staat op de desktop Analysis. In de modus Chronological krijgt elk event een eigen regel, de nieuwste onderaan. Met Maximize rechtsboven vult het venster de desktop.The Trace is on the Analysis desktop. In Chronological mode each event has its own row, newest at the bottom. Maximize at the top right makes the window fill the desktop.La Trace se trouve sur le desktop Analysis. En mode Chronological, chaque événement occupe sa propre ligne, le plus récent en bas. Maximize, en haut à droite, agrandit la fenêtre à tout le desktop.
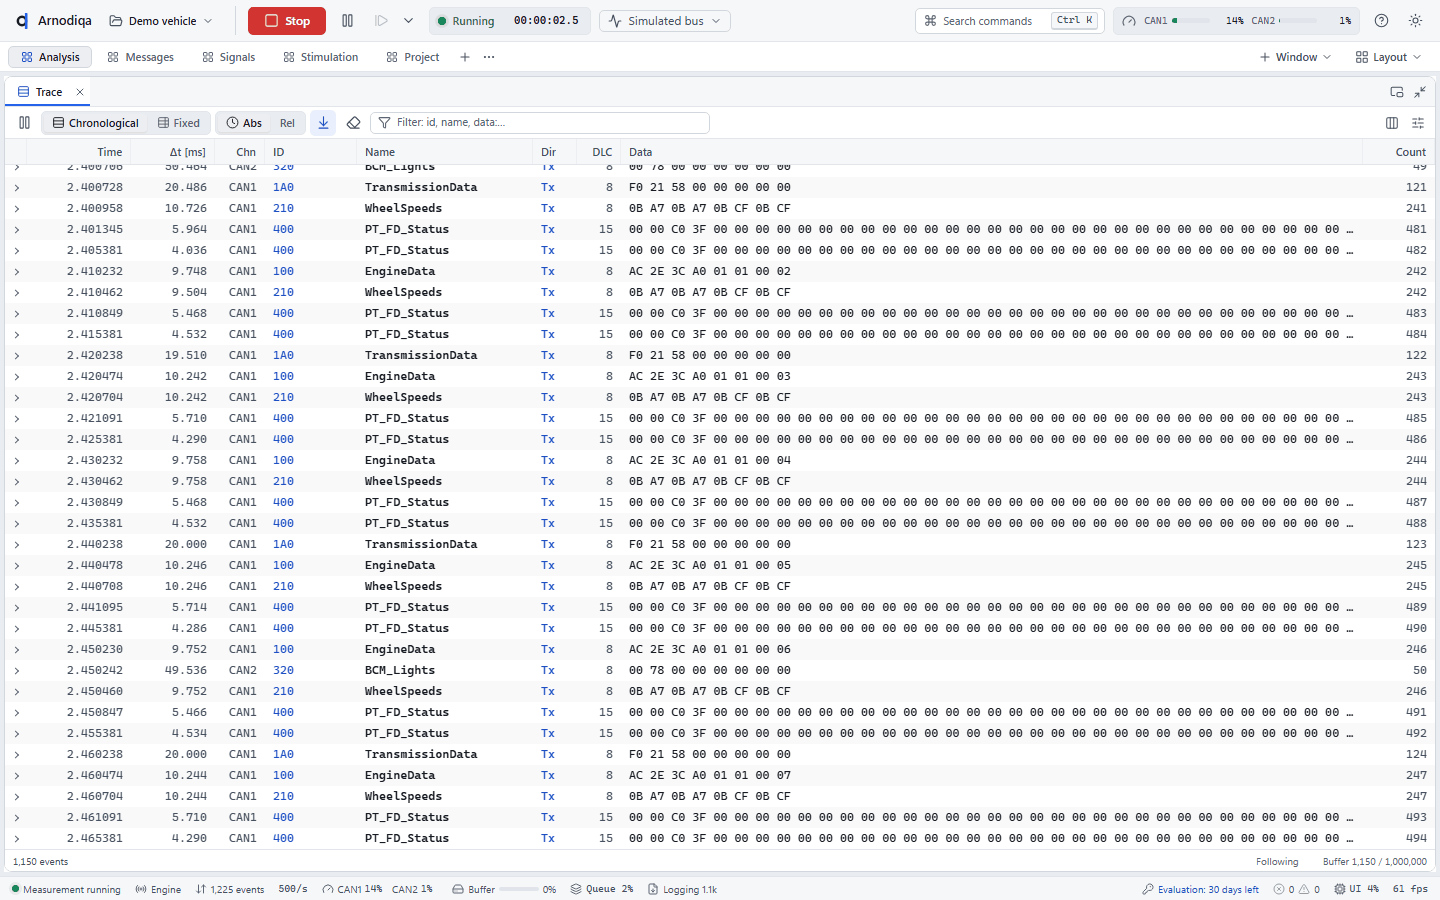
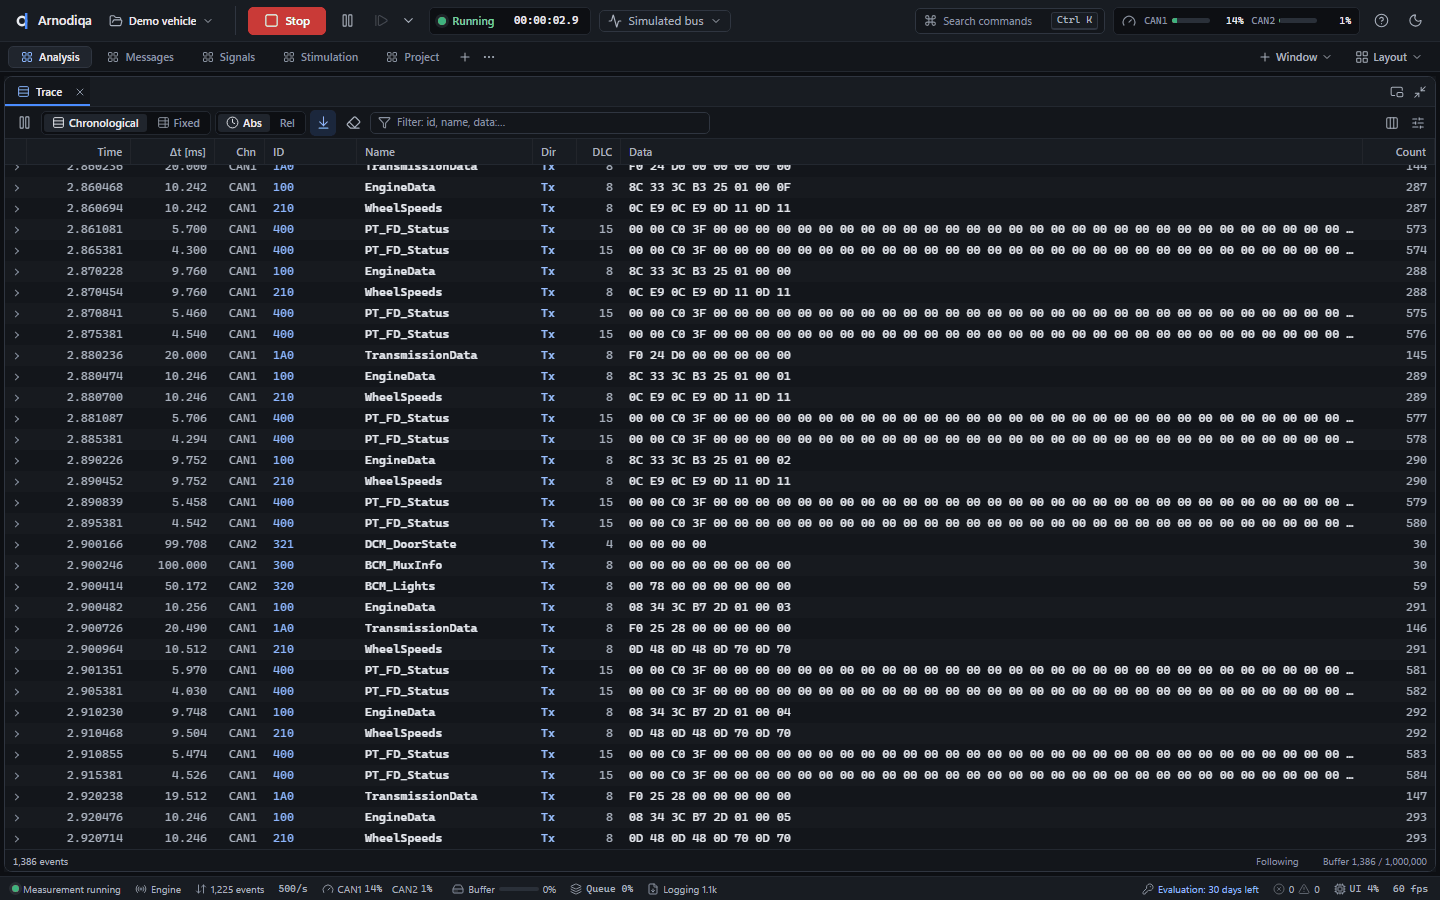
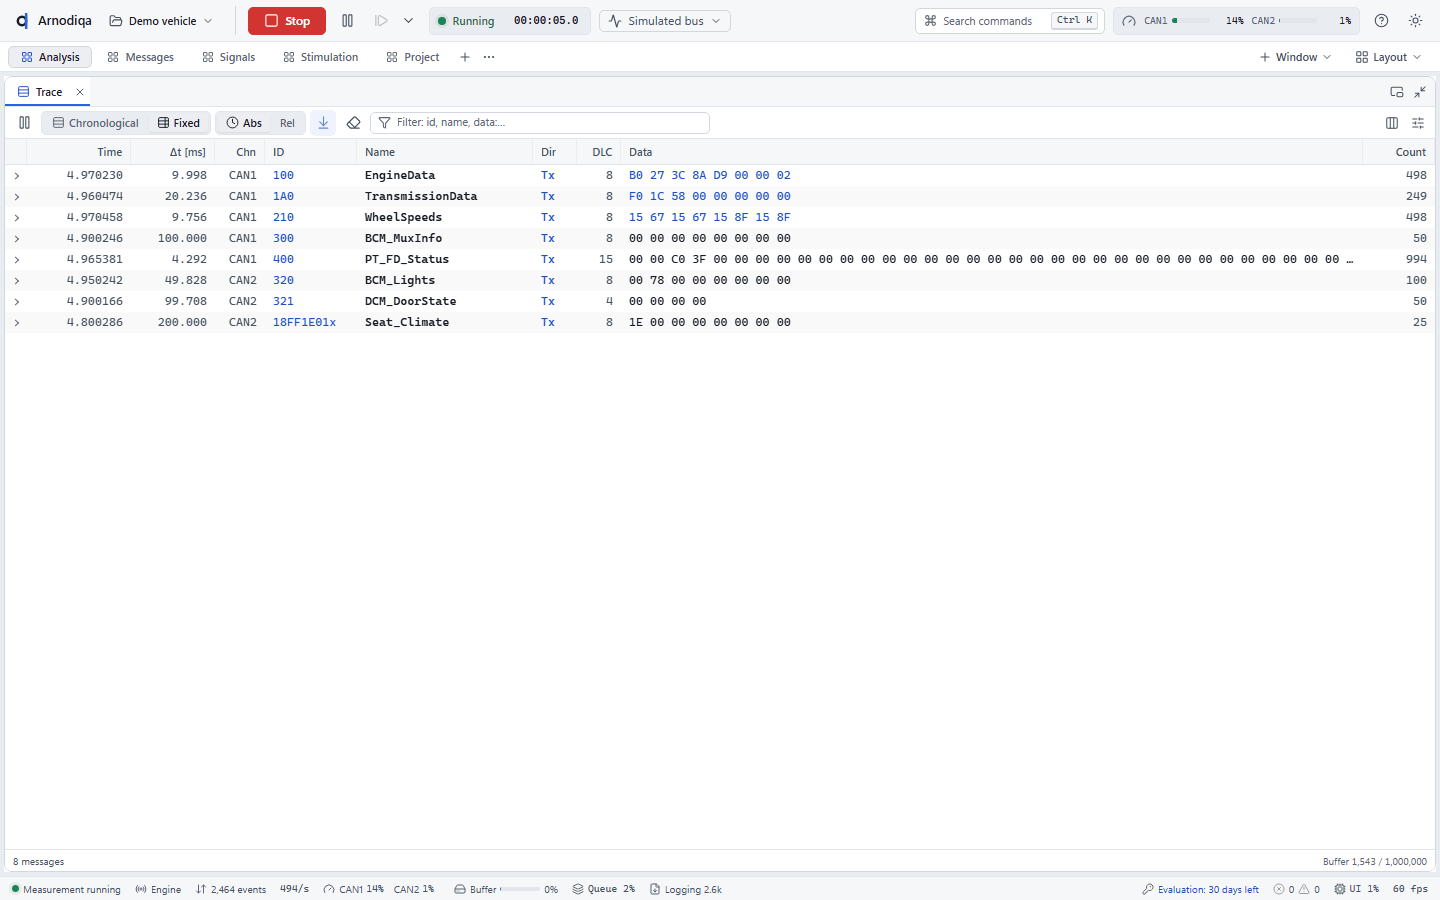
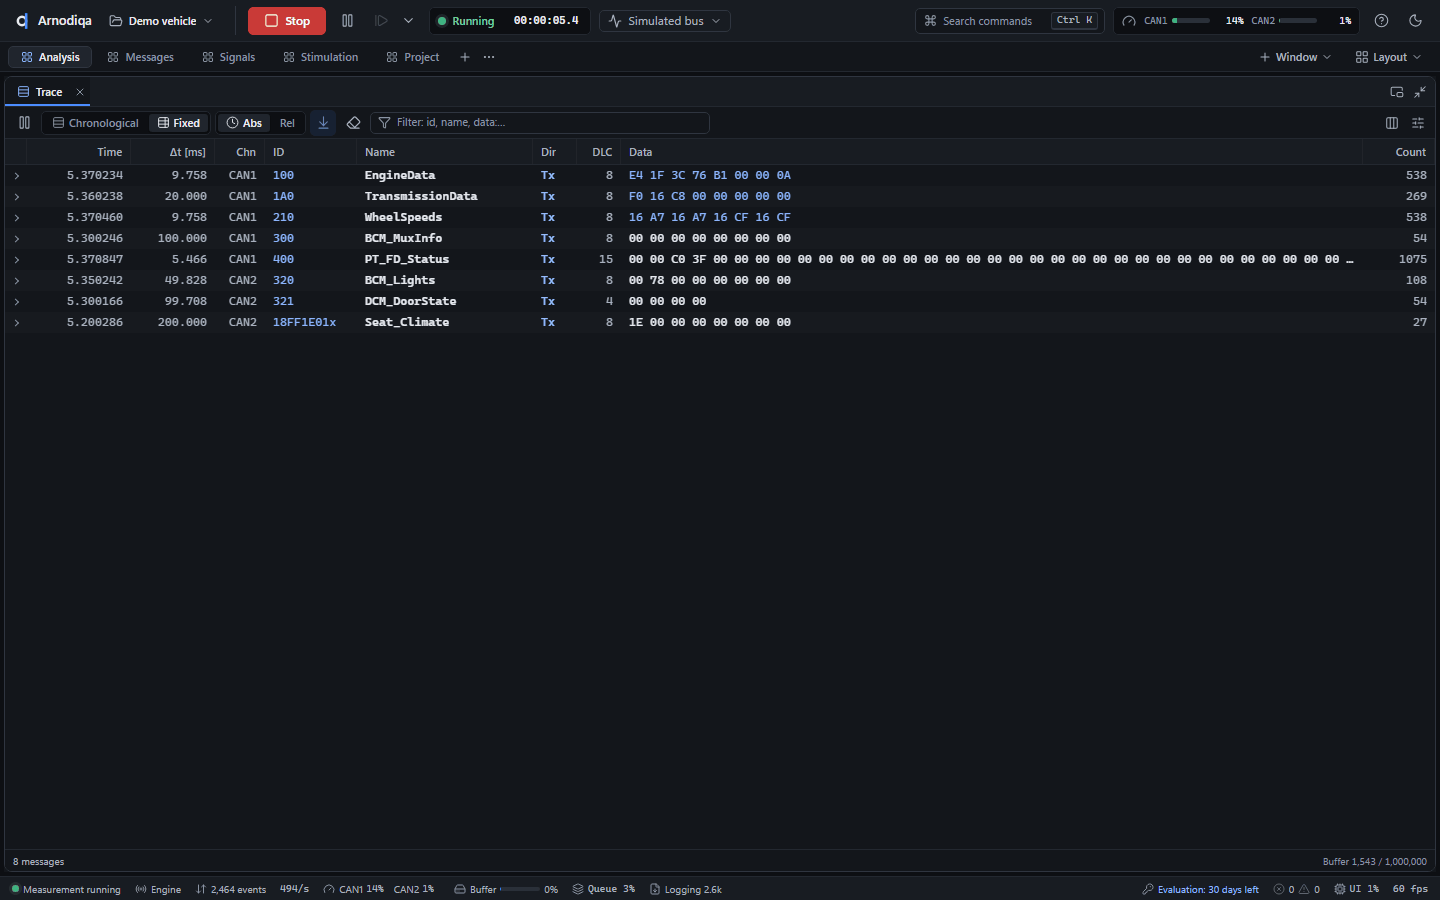
Klik op Fixed voor één regel per bericht, die op zijn plaats wordt bijgewerkt. Abs en Rel kiezen absolute of relatieve tijd; Spatie pauzeert de weergave.Click Fixed for one row per message, updated in place. Abs and Rel select absolute or relative time; Space pauses the display.Cliquez sur Fixed pour obtenir une ligne par message, mise à jour sur place. Abs et Rel sélectionnent le temps absolu ou relatif ; Espace met l'affichage en pause.
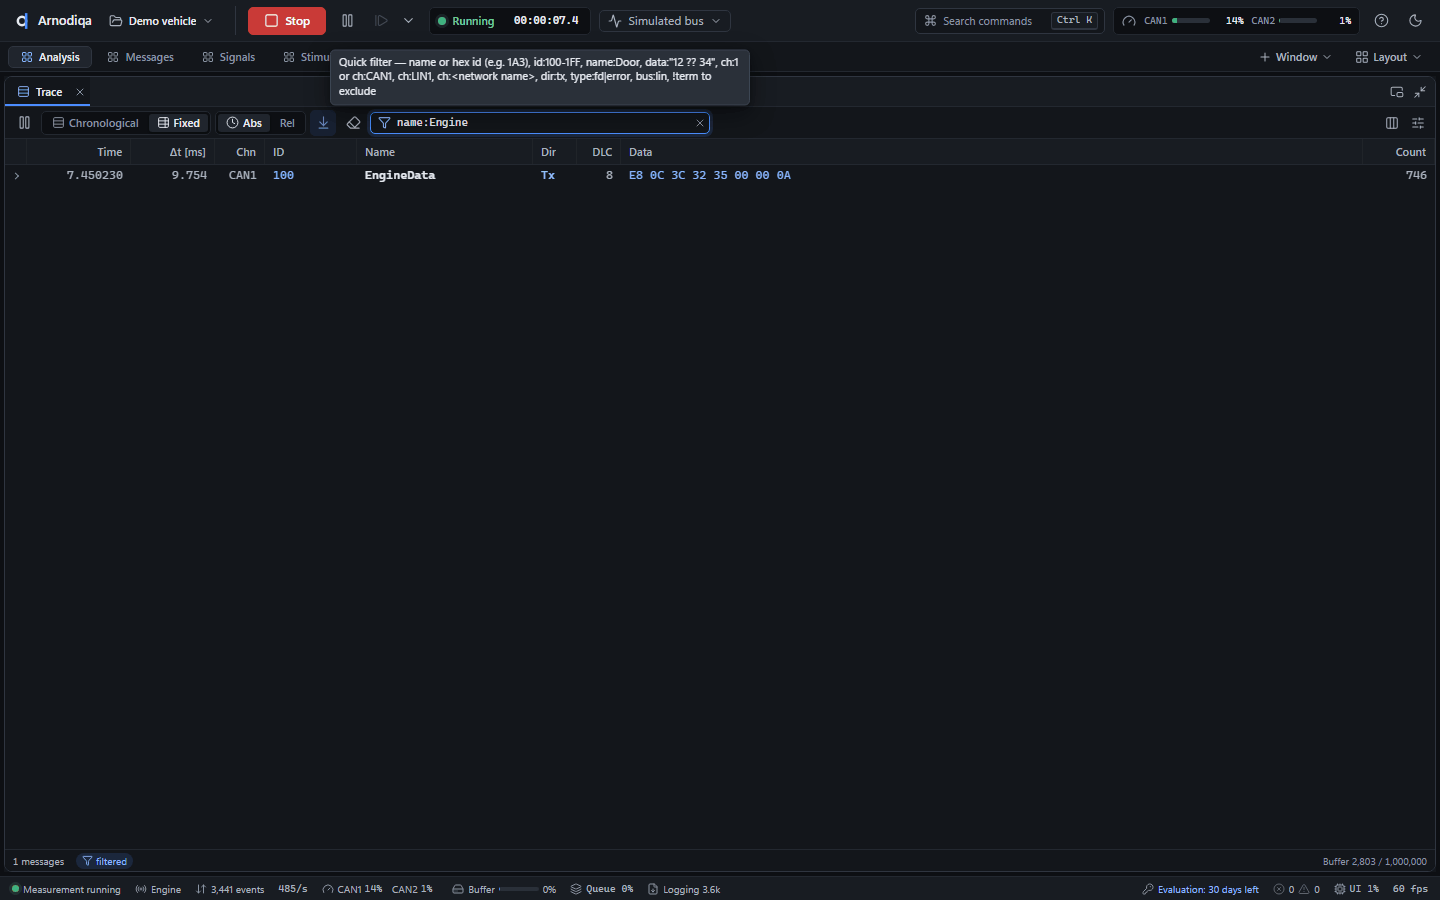
Typ in het filterveld (Ctrl+F) een filter, hier
name:Engine. Voorbeelden:1A0ofid:100-1FF(ID of bereik),ch:CAN2ofch:Comfort(kanaal of netwerk),dir:tx,type:fd,!name:Door(niet). Termen worden gecombineerd; de tooltip van het veld toont de volledige syntax.Type a filter in the filter field (Ctrl+F), herename:Engine. Examples:1A0orid:100-1FF(ID or range),ch:CAN2orch:Comfort(channel or network),dir:tx,type:fd,!name:Door(not). Terms are combined; the field's tooltip shows the full syntax.Saisissez un filtre dans le champ de filtre (Ctrl+F), iciname:Engine. Exemples :1A0ouid:100-1FF(ID ou plage),ch:CAN2ouch:Comfort(canal ou réseau),dir:tx,type:fd,!name:Door(négation). Les termes se combinent ; l'info-bulle du champ donne la syntaxe complète.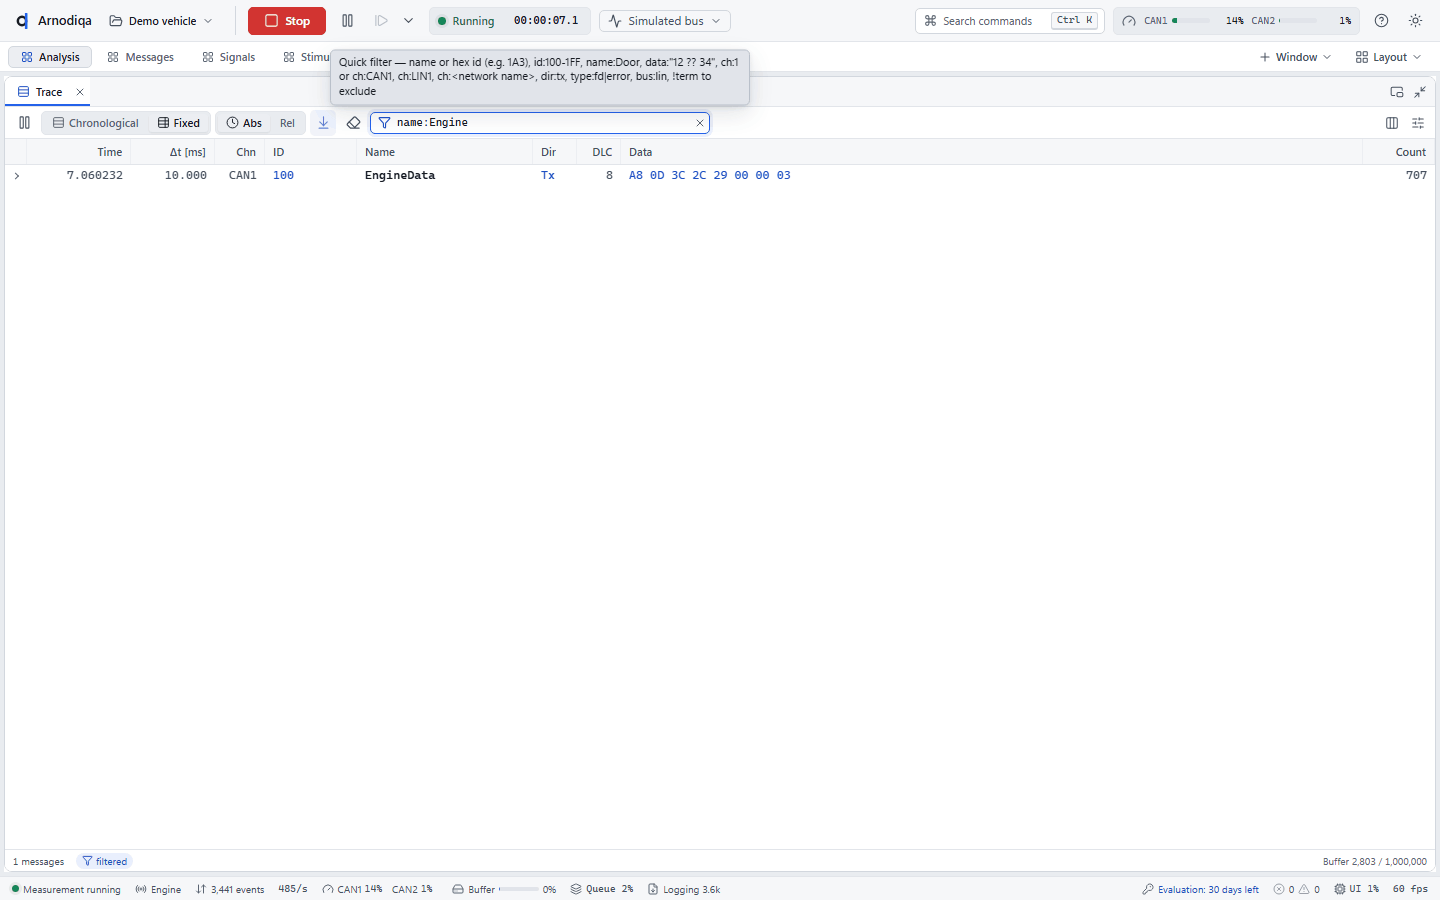
Een tweede voorbeeld:
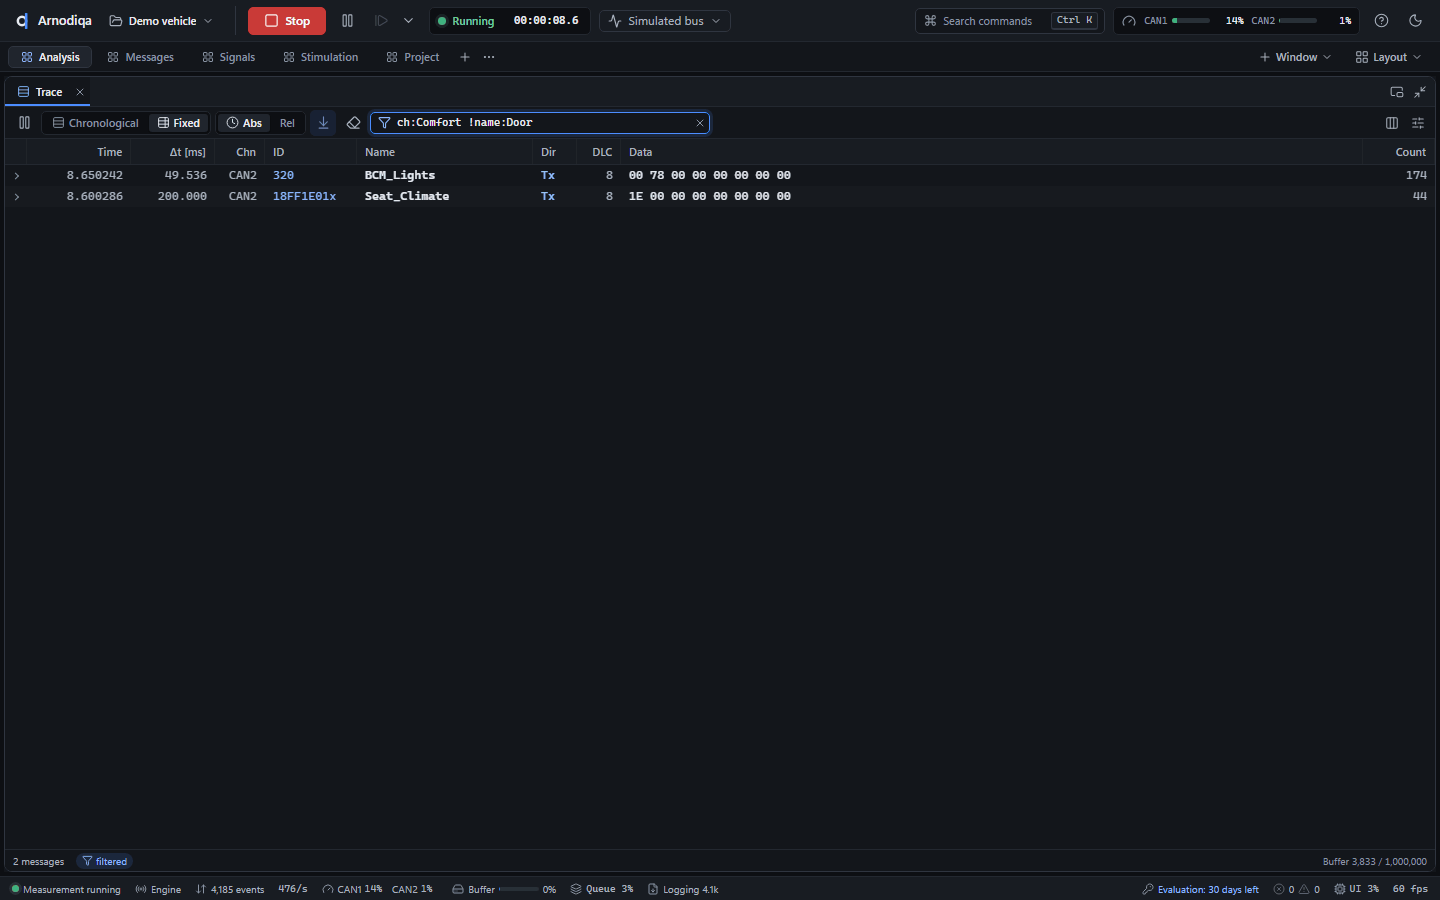
ch:Comfort !name:Doortoont alle berichten op het netwerk Comfort behalve die met Door in de naam. Onderaan staat filtered; Esc in het veld wist het filter.A second example:ch:Comfort !name:Doorshows all messages on the Comfort network except those with Door in the name. The bottom bar shows filtered; Esc in the field clears the filter.Deuxième exemple :ch:Comfort !name:Dooraffiche tous les messages du réseau Comfort sauf ceux dont le nom contient Door. La barre du bas indique filtered ; Échap dans le champ efface le filtre.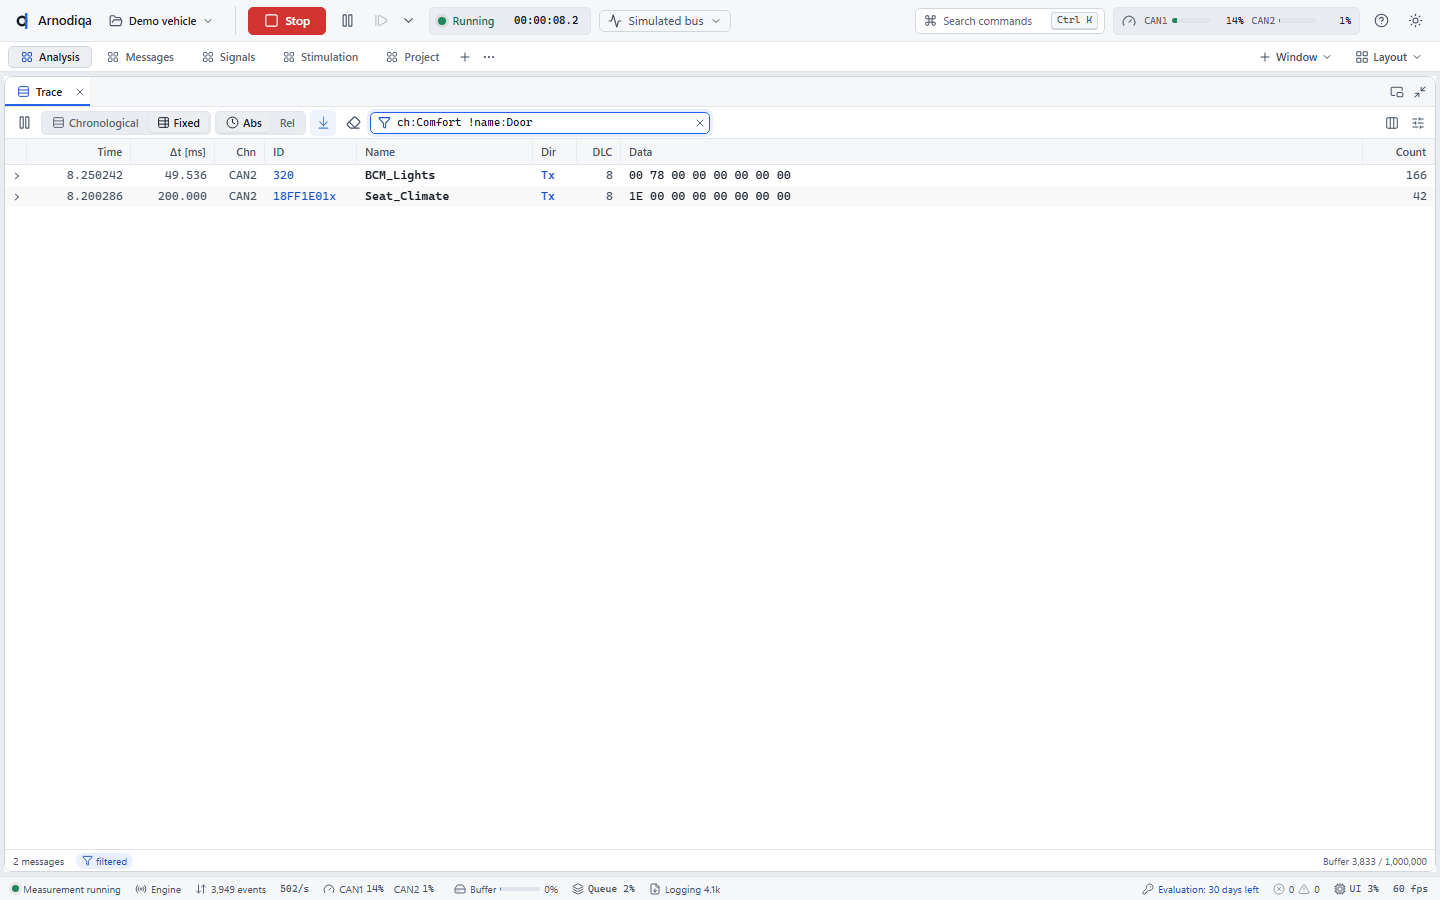
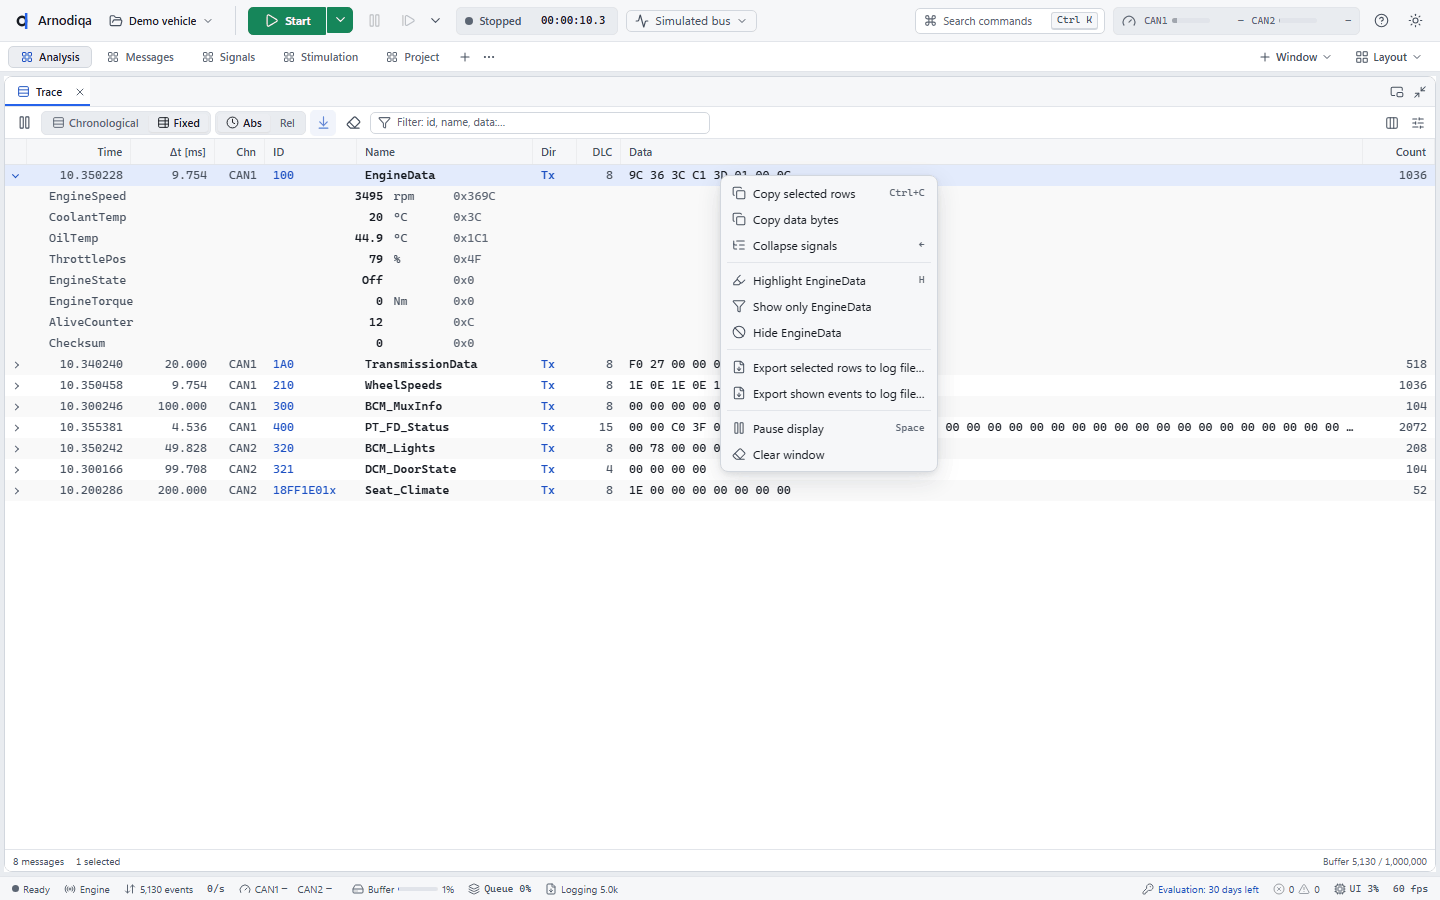
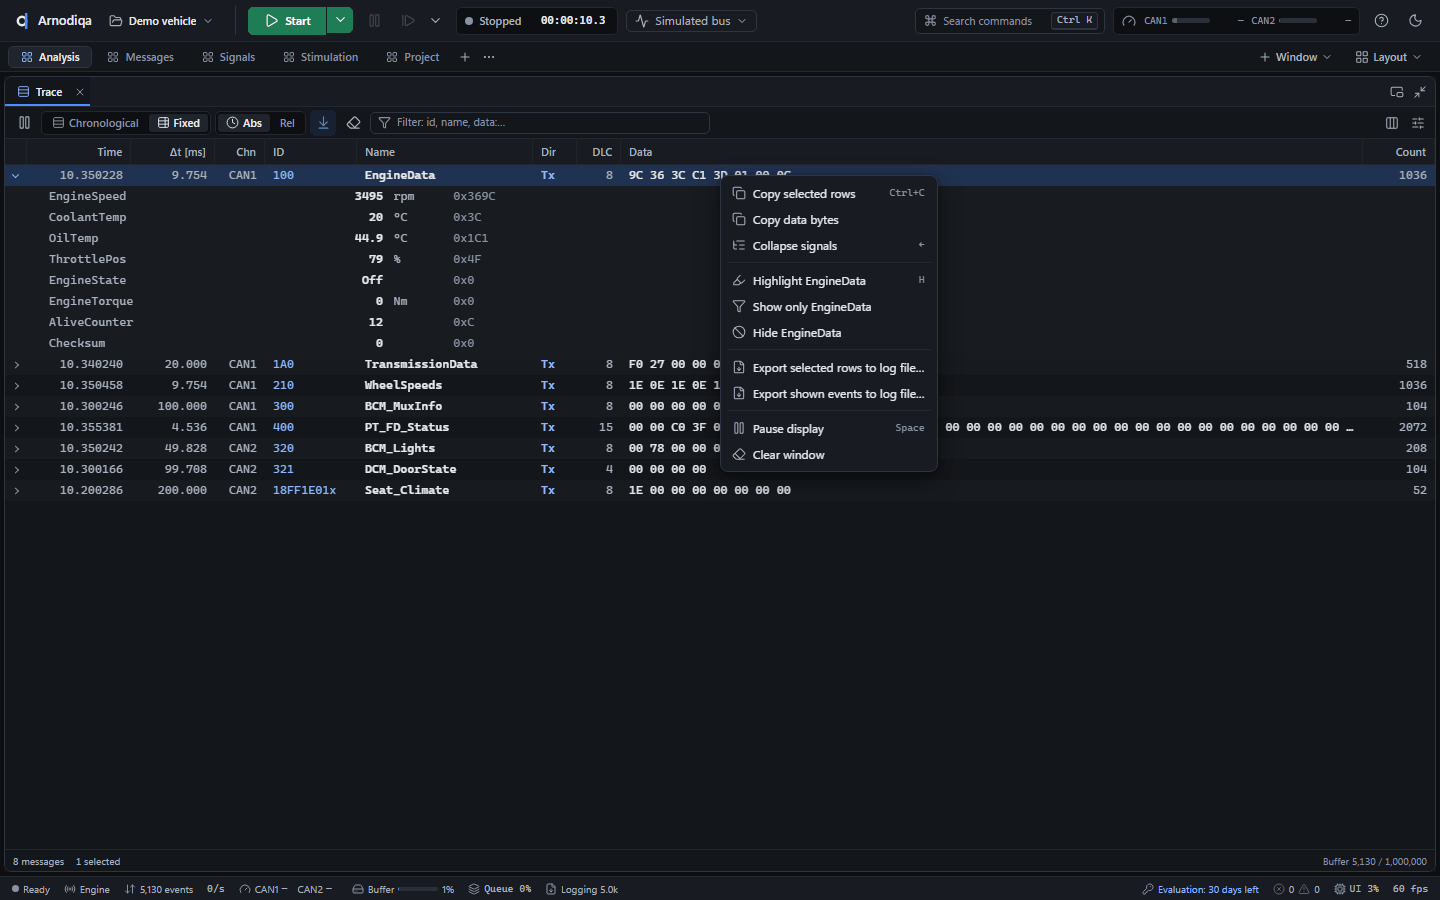
Klik op het pijltje vooraan een regel om het frame open te klappen: elk signaal staat eronder met fysische waarde, eenheid en ruwe waarde.Click the arrow at the start of a row to expand the frame: each signal is listed below it with physical value, unit and raw value.Cliquez sur la flèche en début de ligne pour déplier la trame : chaque signal apparaît en dessous avec sa valeur physique, son unité et sa valeur brute.
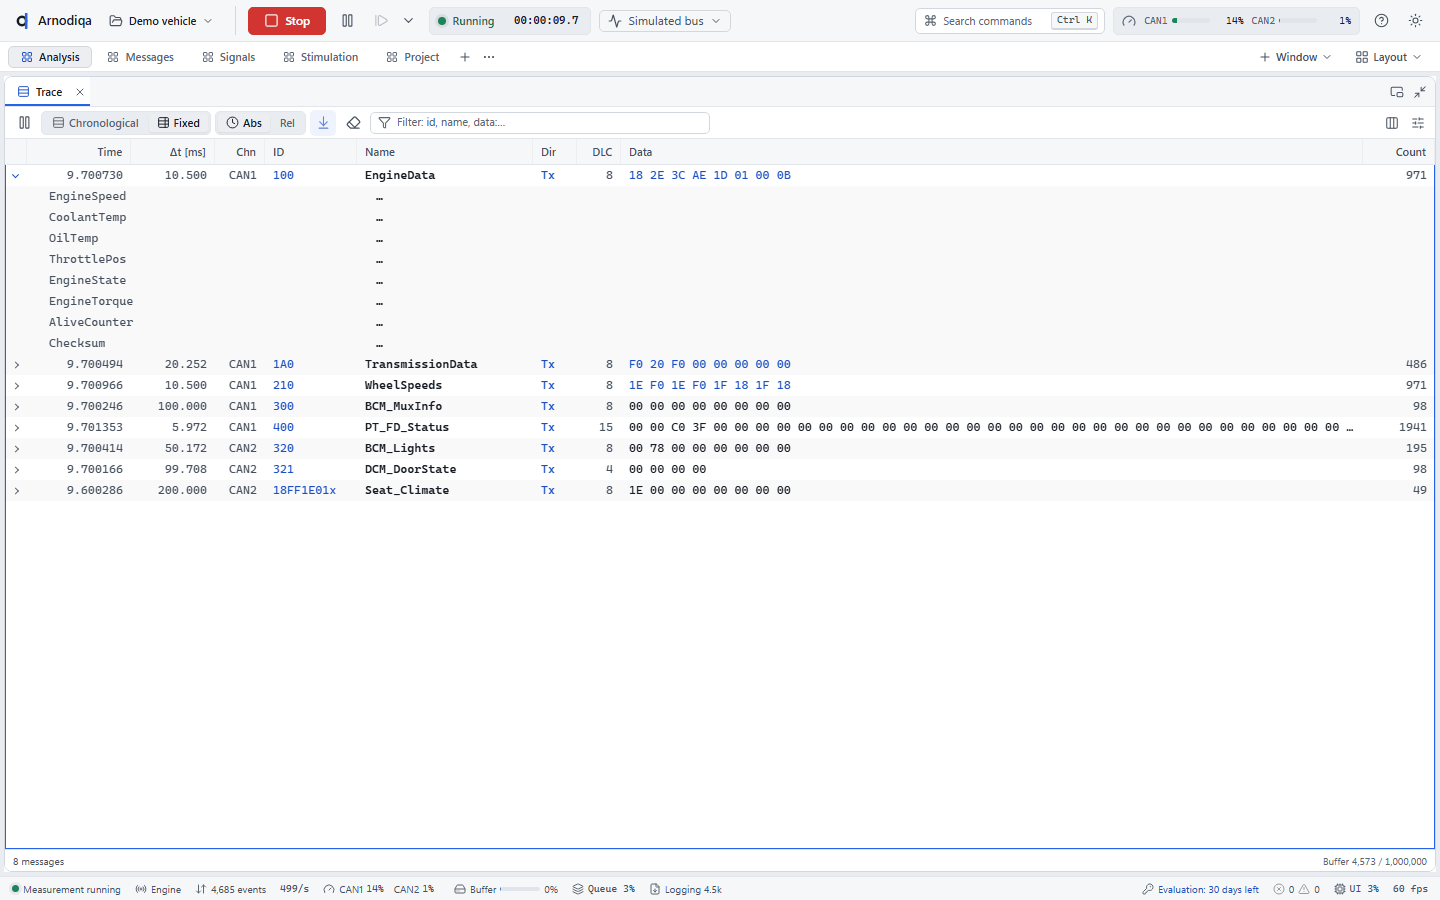
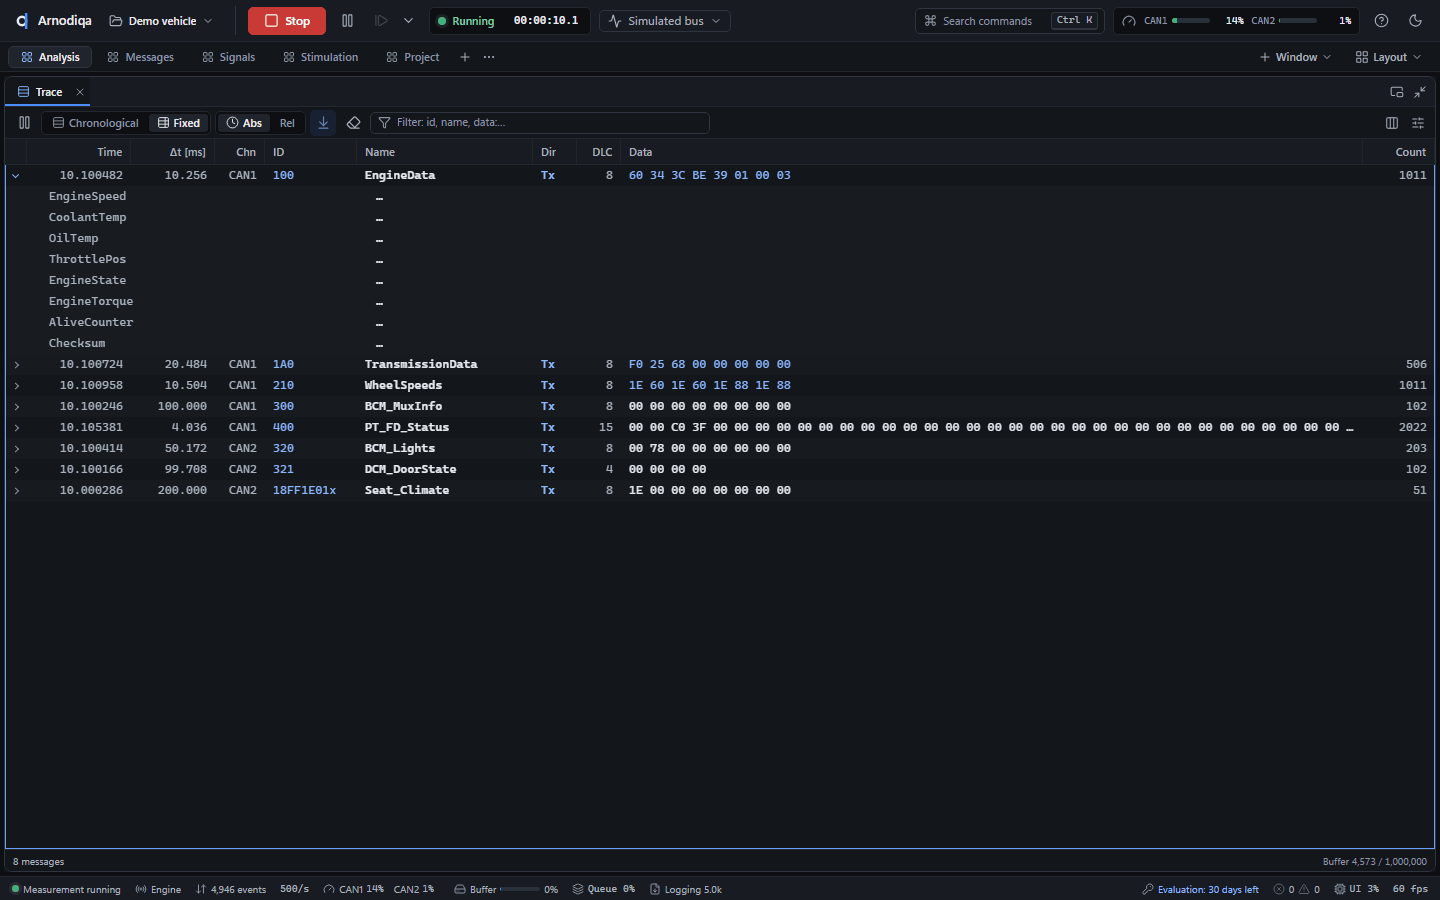
Het contextmenu (rechtermuisknop) bevat Export selected rows to log file… en Export shown events to log file… (alles wat het venster met het huidige filter toont). In het opslagvenster kies je de naam en het type: BLF, ASC, MF4 of PCAPNG.The context menu (right-click) contains Export selected rows to log file… and Export shown events to log file… (everything the window shows with the current filter). In the save dialog, choose the name and type: BLF, ASC, MF4 or PCAPNG.Le menu contextuel (clic droit) contient Export selected rows to log file… et Export shown events to log file… (tout ce que la fenêtre affiche avec le filtre en cours). Dans la boîte d'enregistrement, choisissez le nom et le type : BLF, ASC, MF4 ou PCAPNG.
Na het exporteren meldt Arnodiqa het aantal geschreven events; het Write-venster vermeldt elk bestand, hier trace.blf, trace.asc en trace.mf4.After exporting, Arnodiqa reports the number of events written; the Write window lists each file, here trace.blf, trace.asc and trace.mf4.Après l'export, Arnodiqa indique le nombre d'événements écrits ; la fenêtre Write mentionne chaque fichier, ici trace.blf, trace.asc et trace.mf4.
Signalen volgen in Data en GraphicsFollow signals in Data and GraphicsSuivre des signaux dans Data et Graphics
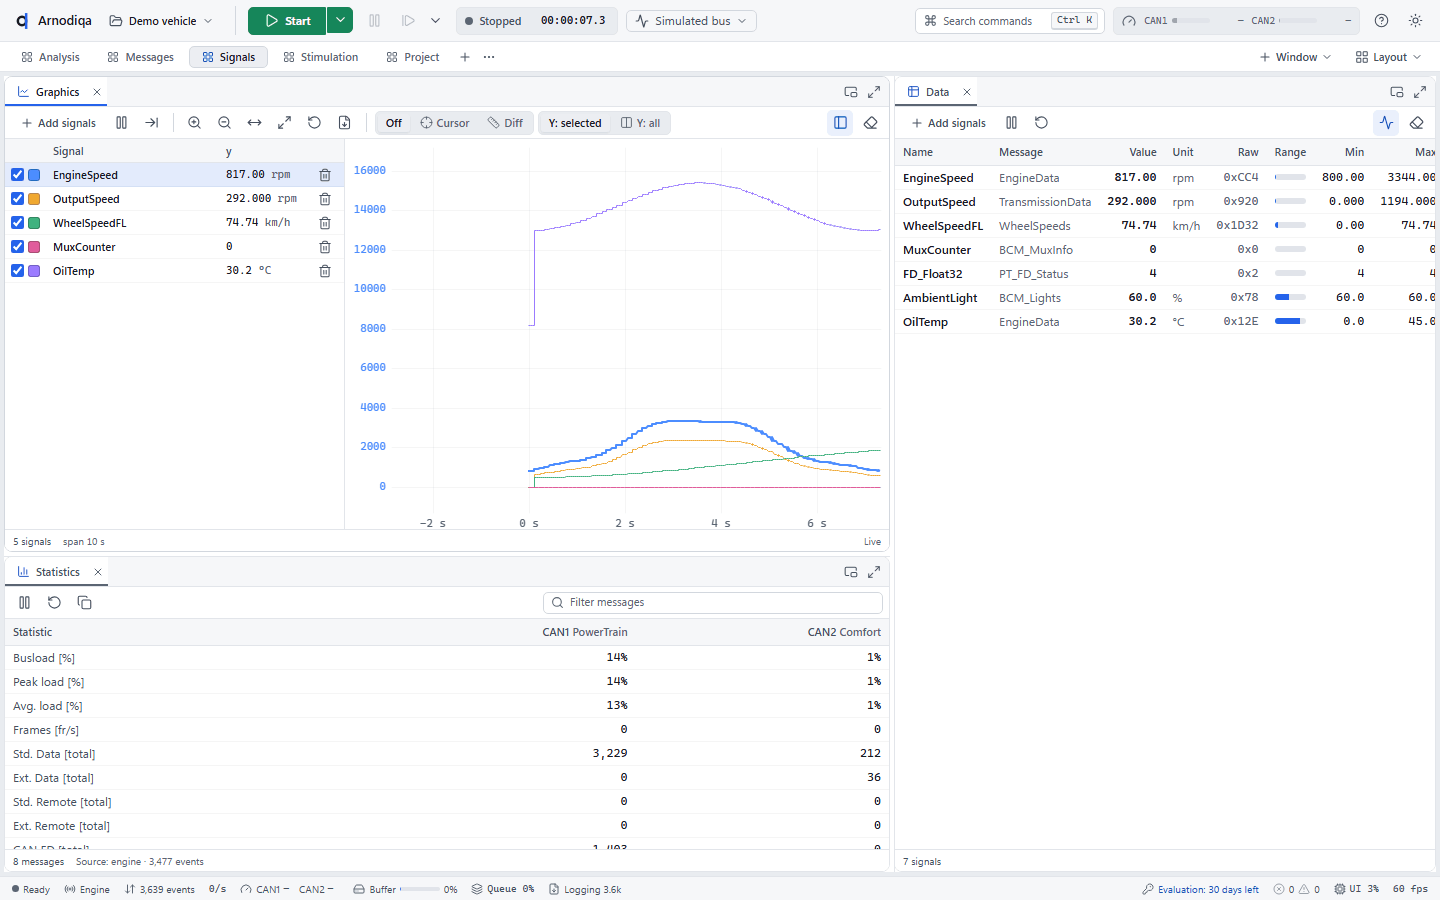
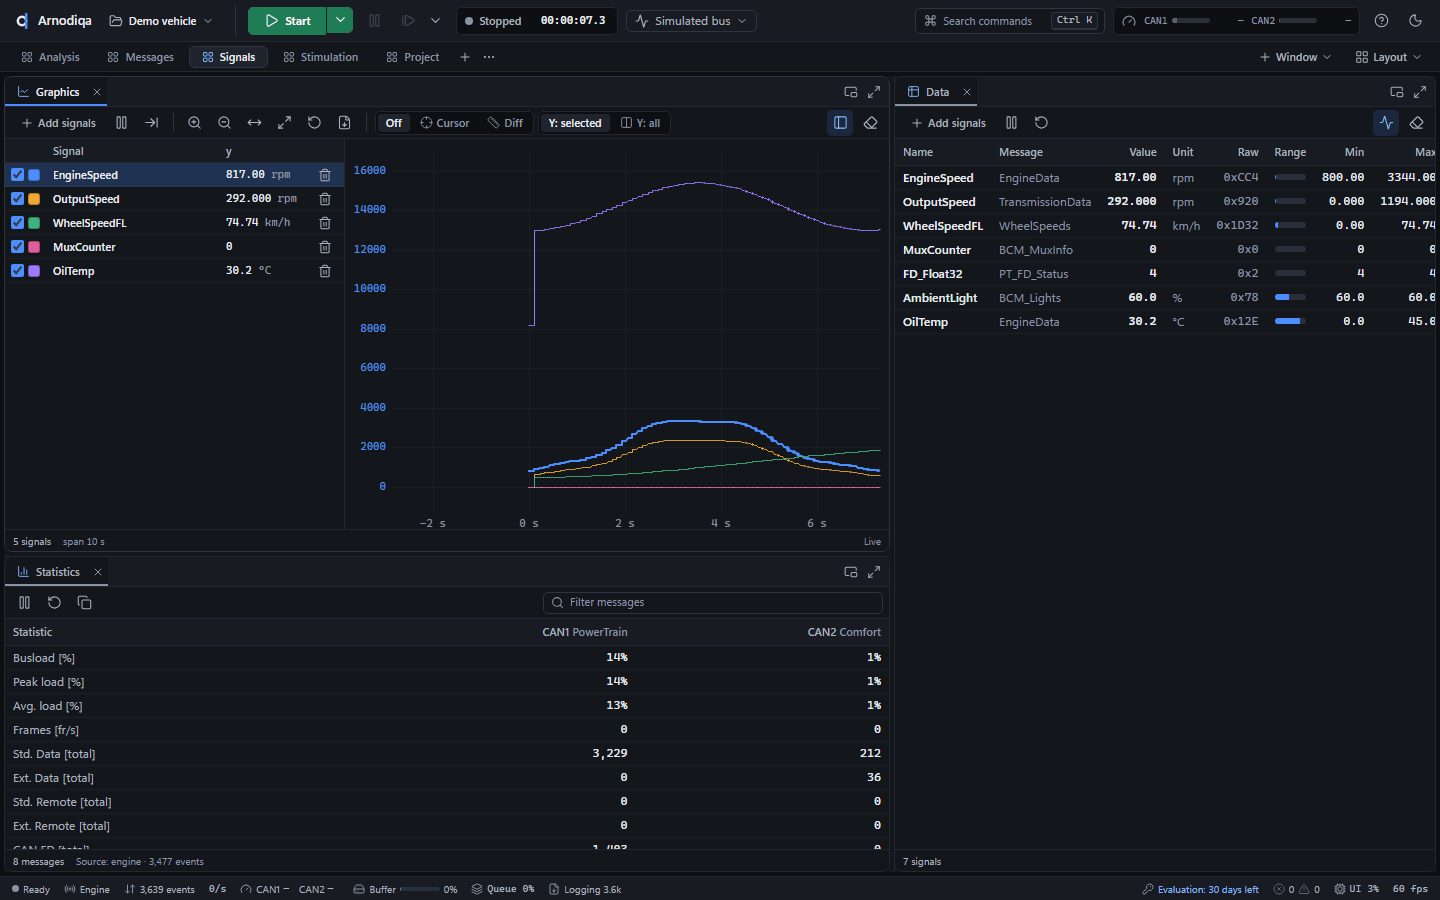
Data toont actuele signaalwaarden, Graphics het verloop in de tijd.Data shows current signal values, Graphics their course over time.Data affiche les valeurs actuelles des signaux, Graphics leur évolution dans le temps.
Open de desktop Signals. Graphics en Data zijn al gevuld met signalen uit de databases van het project.Open the Signals desktop. Graphics and Data already contain signals from the project's databases.Ouvrez le desktop Signals. Graphics et Data contiennent déjà des signaux issus des bases de données du projet.
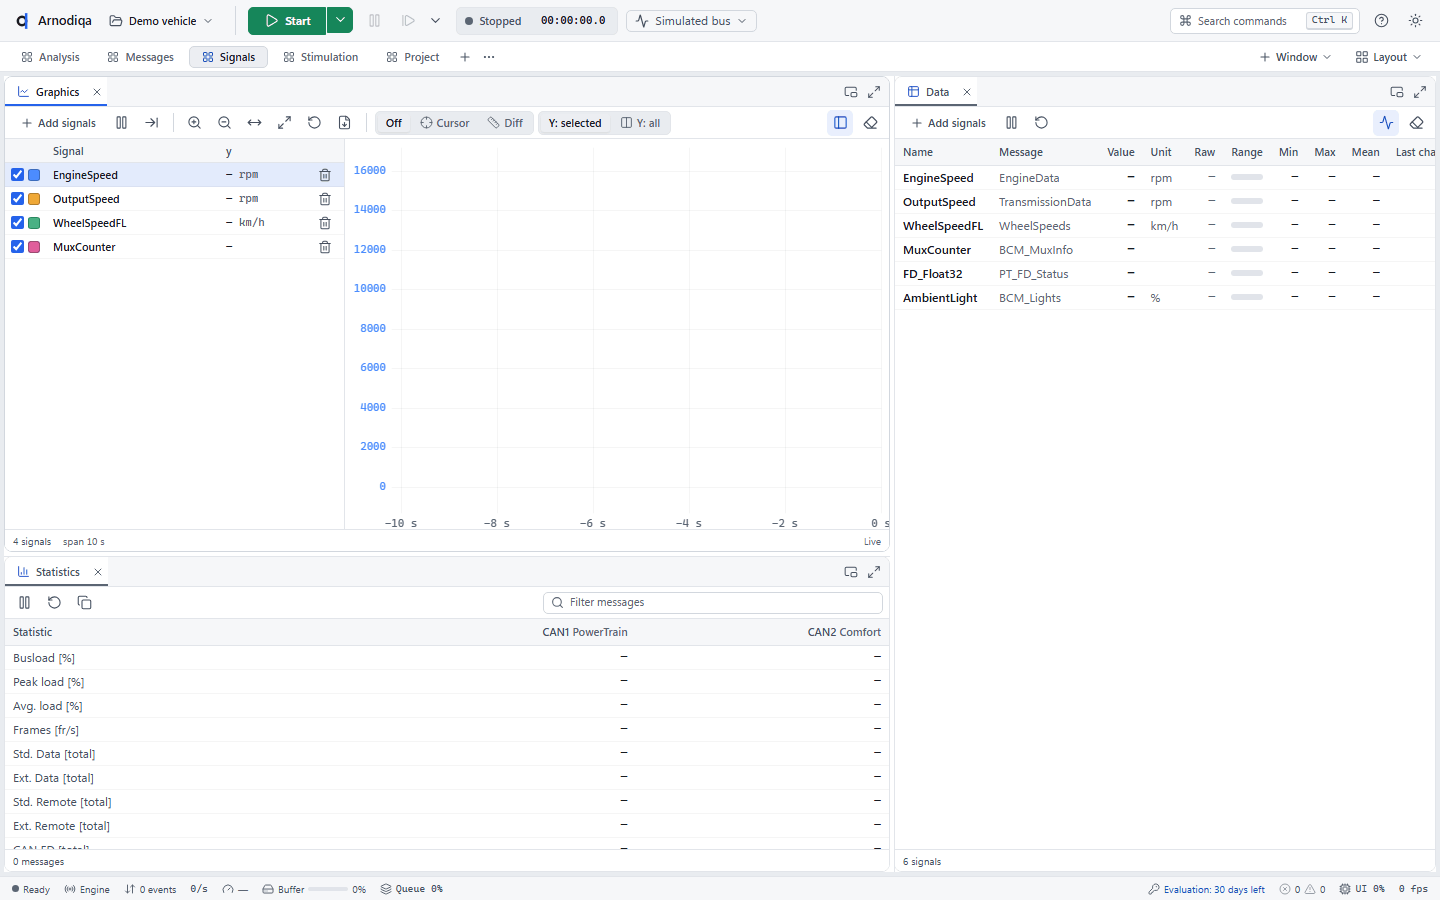
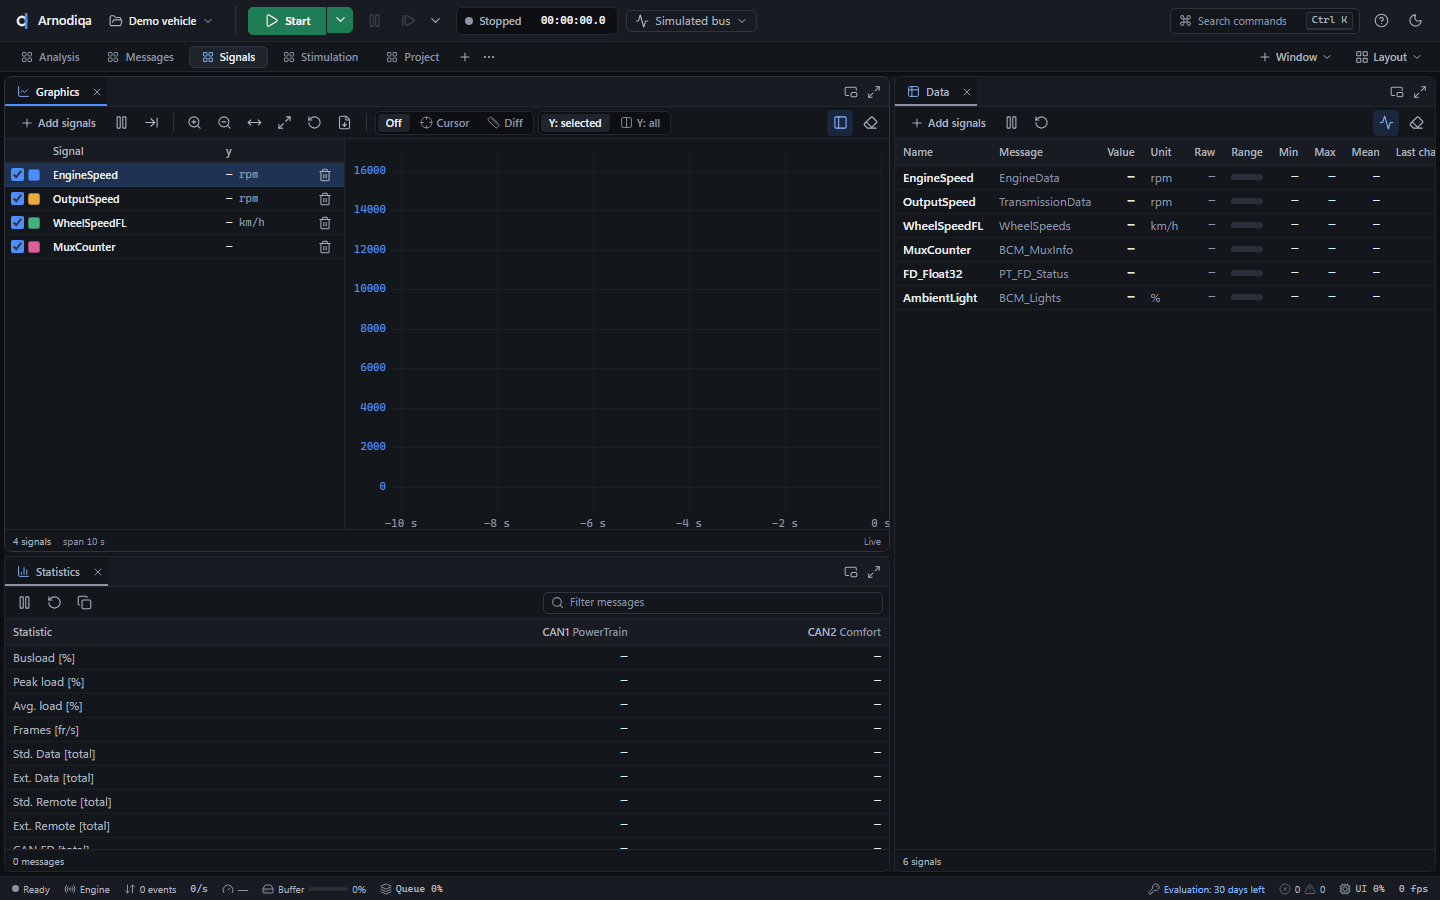
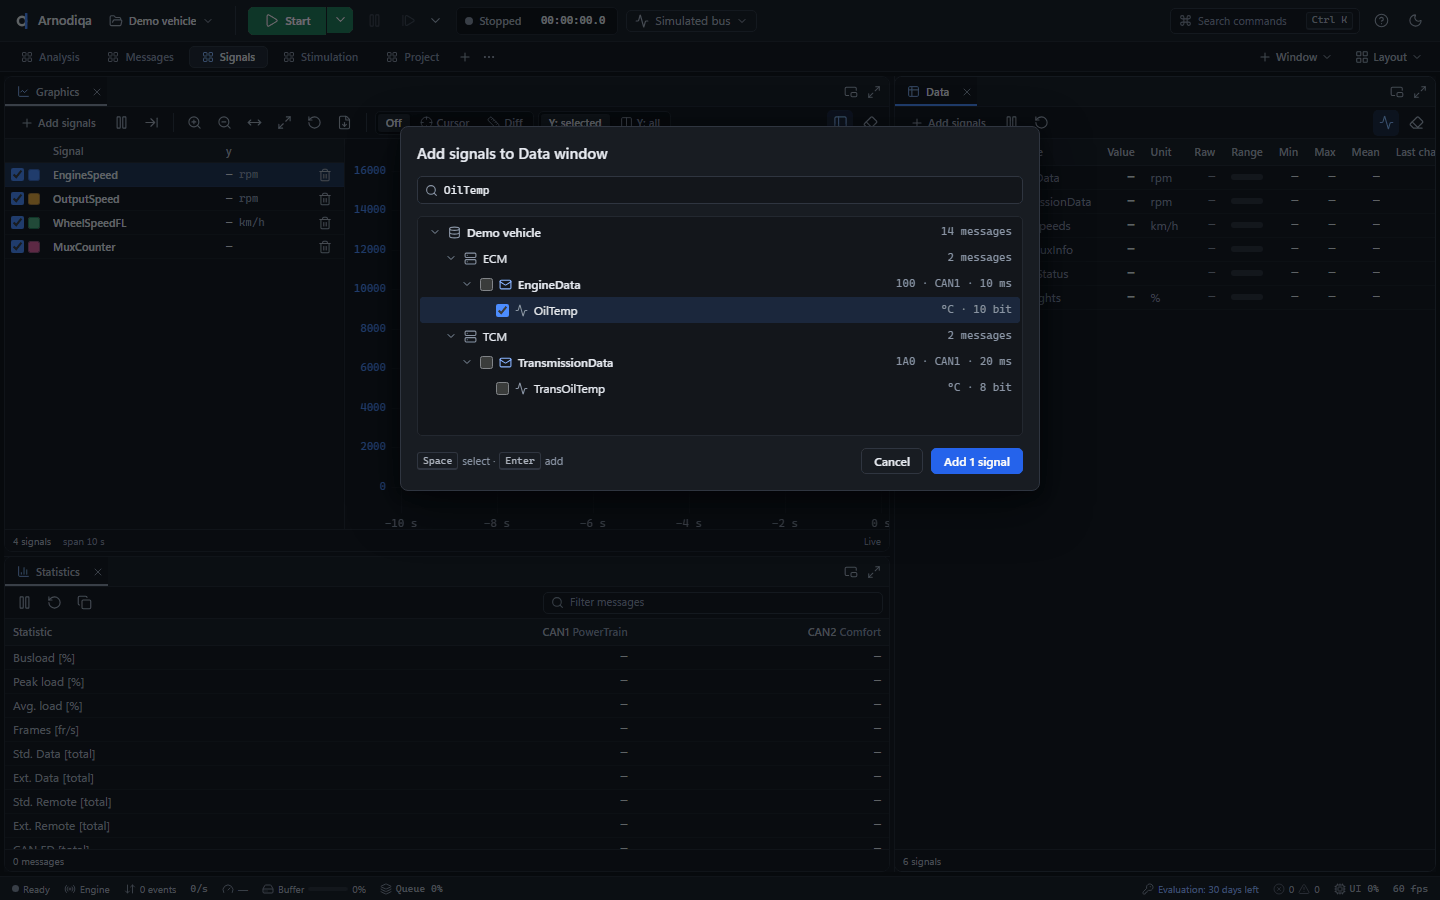
Klik in het Data-venster op Add signals. Zoek in Add signals to Data window op naam (hier OilTemp), vink het signaal aan (Spatie) en klik op Add 1 signal (Enter). Een signaal uit de Trace kun je ook naar het venster slepen.In the Data window, click Add signals. In Add signals to Data window, search by name (here OilTemp), tick the signal (Space) and click Add 1 signal (Enter). You can also drag a signal from the Trace into the window.Dans la fenêtre Data, cliquez sur Add signals. Dans Add signals to Data window, recherchez par nom (ici OilTemp), cochez le signal (Espace) et cliquez sur Add 1 signal (Entrée). Vous pouvez aussi faire glisser un signal de la Trace vers la fenêtre.
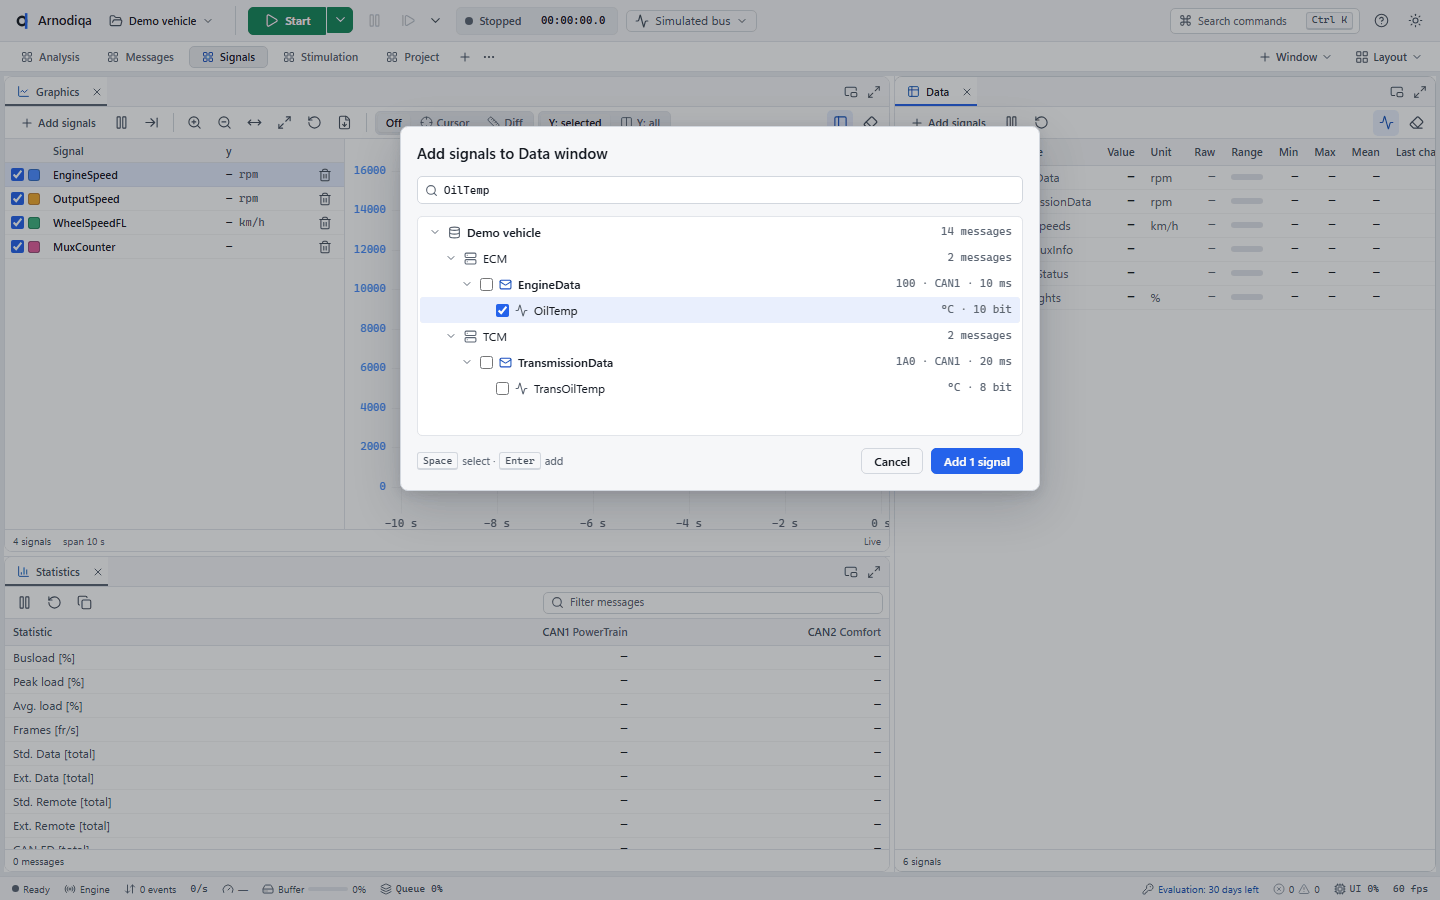
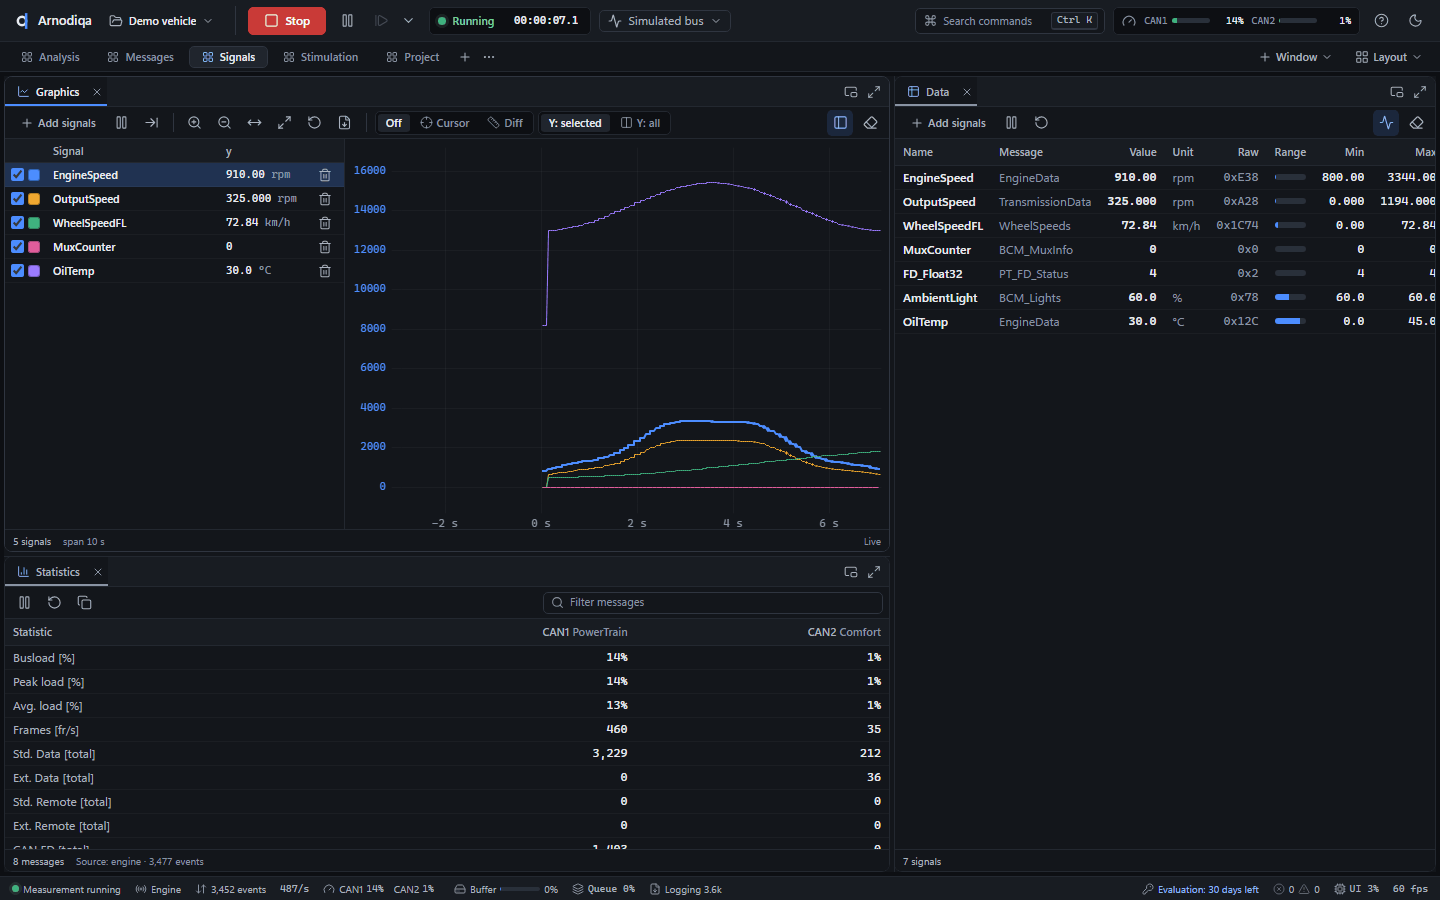
Doe hetzelfde in Graphics met Add signals en start de meting (F9). Data toont per signaal de actuele waarde, eenheid, ruwe waarde en min/max; Graphics het verloop met de laatste waarde in de signaallijst.Do the same in Graphics with Add signals and start the measurement (F9). Data shows the current value, unit, raw value and min/max of each signal; Graphics shows the course over time with the latest value in the signal list.Procédez de même dans Graphics avec Add signals et démarrez la mesure (F9). Data affiche pour chaque signal la valeur actuelle, l'unité, la valeur brute et le min/max ; Graphics affiche l'évolution, avec la dernière valeur dans la liste des signaux.
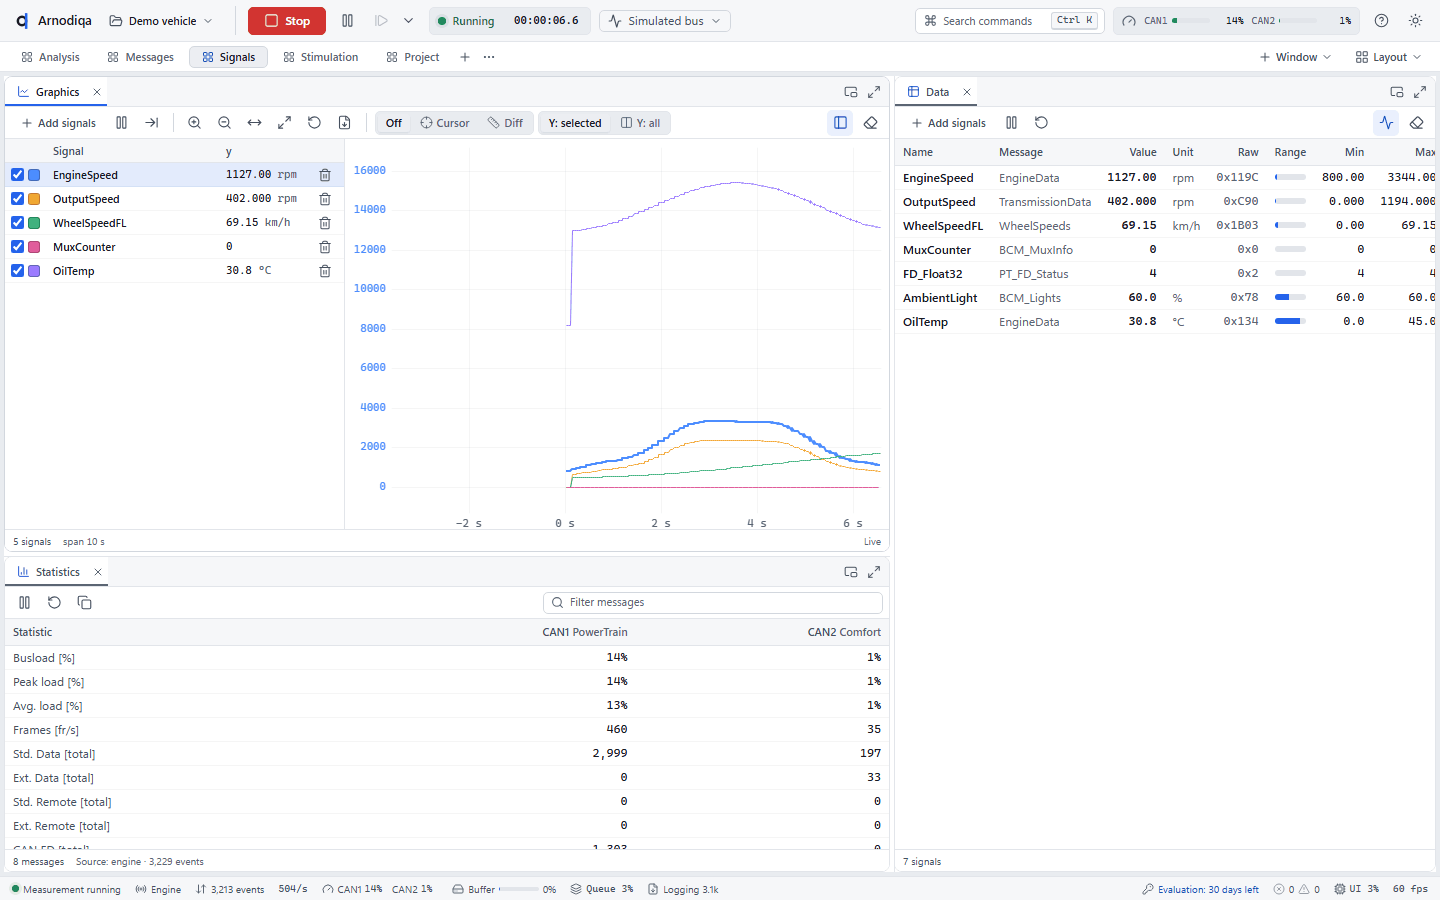
Na de stop blijft het verloop staan. Scroll in Graphics om te zoomen en sleep om te verschuiven; het contextmenu exporteert de frames naar een logbestand of de signalen als CSV.After stopping, the plot remains. Scroll in Graphics to zoom and drag to pan; the context menu exports the frames to a log file or the signals as CSV.Après l'arrêt, la courbe reste affichée. Dans Graphics, la molette zoome et un glisser déplace la vue ; le menu contextuel exporte les trames vers un fichier journal ou les signaux au format CSV.
Berichten zenden met de Interactive GeneratorSend messages with the Interactive GeneratorEnvoyer des messages avec l'Interactive Generator
De Interactive Generator zendt frames eenmalig, periodiek of op een toets.The Interactive Generator sends frames once, periodically or on a key.L'Interactive Generator envoie des trames une seule fois, périodiquement ou sur appui d'une touche.
De desktop Stimulation bevat de Interactive Generator met berichten uit de database van het project.The Stimulation desktop contains the Interactive Generator with messages from the project's database.Le desktop Stimulation contient l'Interactive Generator avec des messages issus de la base de données du projet.
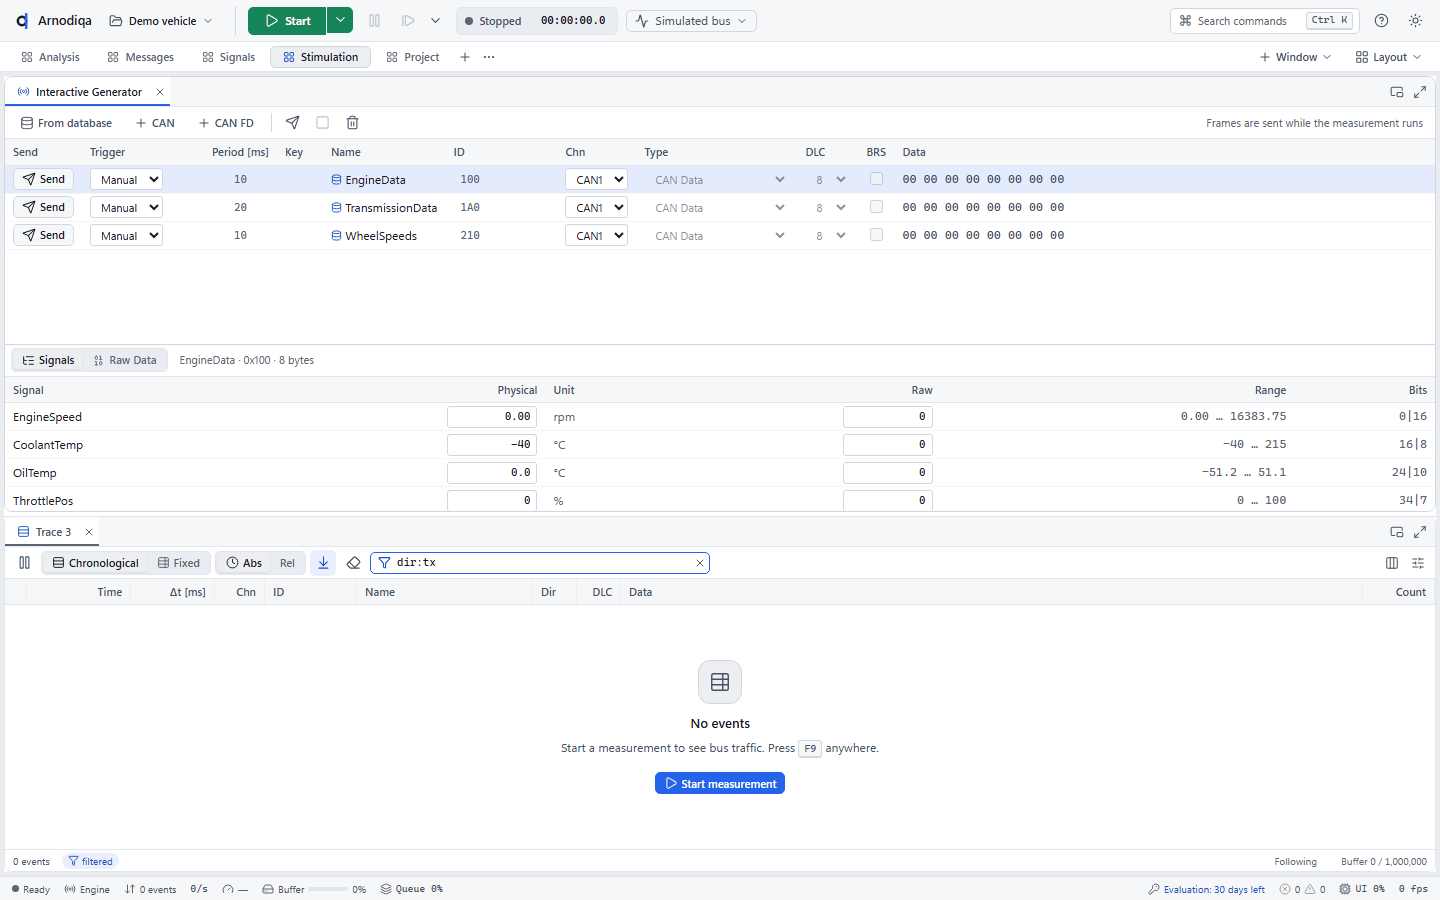
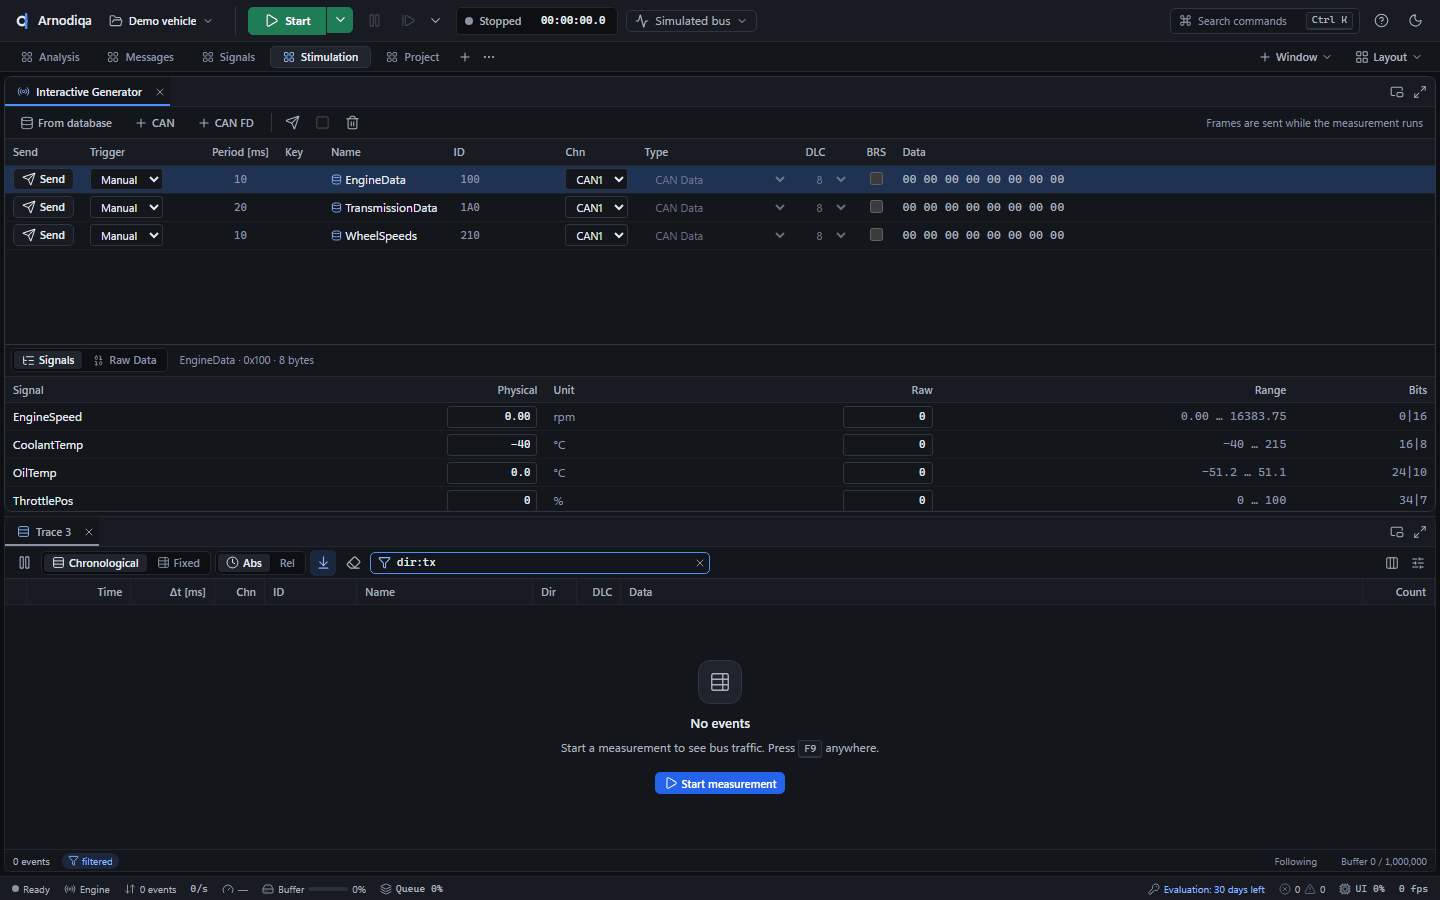
Klik op + CAN voor een eigen CAN-frame; From database voegt een bericht uit de database toe. Vul de ID in (hier 7E0) en onder Raw Data de databytes; bij een databasebericht bewerk je de waarden onder Signals.Click + CAN for a custom CAN frame; From database adds a message from the database. Enter the ID (here 7E0) and the data bytes under Raw Data; for a database message, edit the values under Signals.Cliquez sur + CAN pour une trame CAN personnalisée ; From database ajoute un message de la base de données. Saisissez l'ID (ici 7E0) et les octets de données sous Raw Data ; pour un message de la base de données, modifiez les valeurs sous Signals.
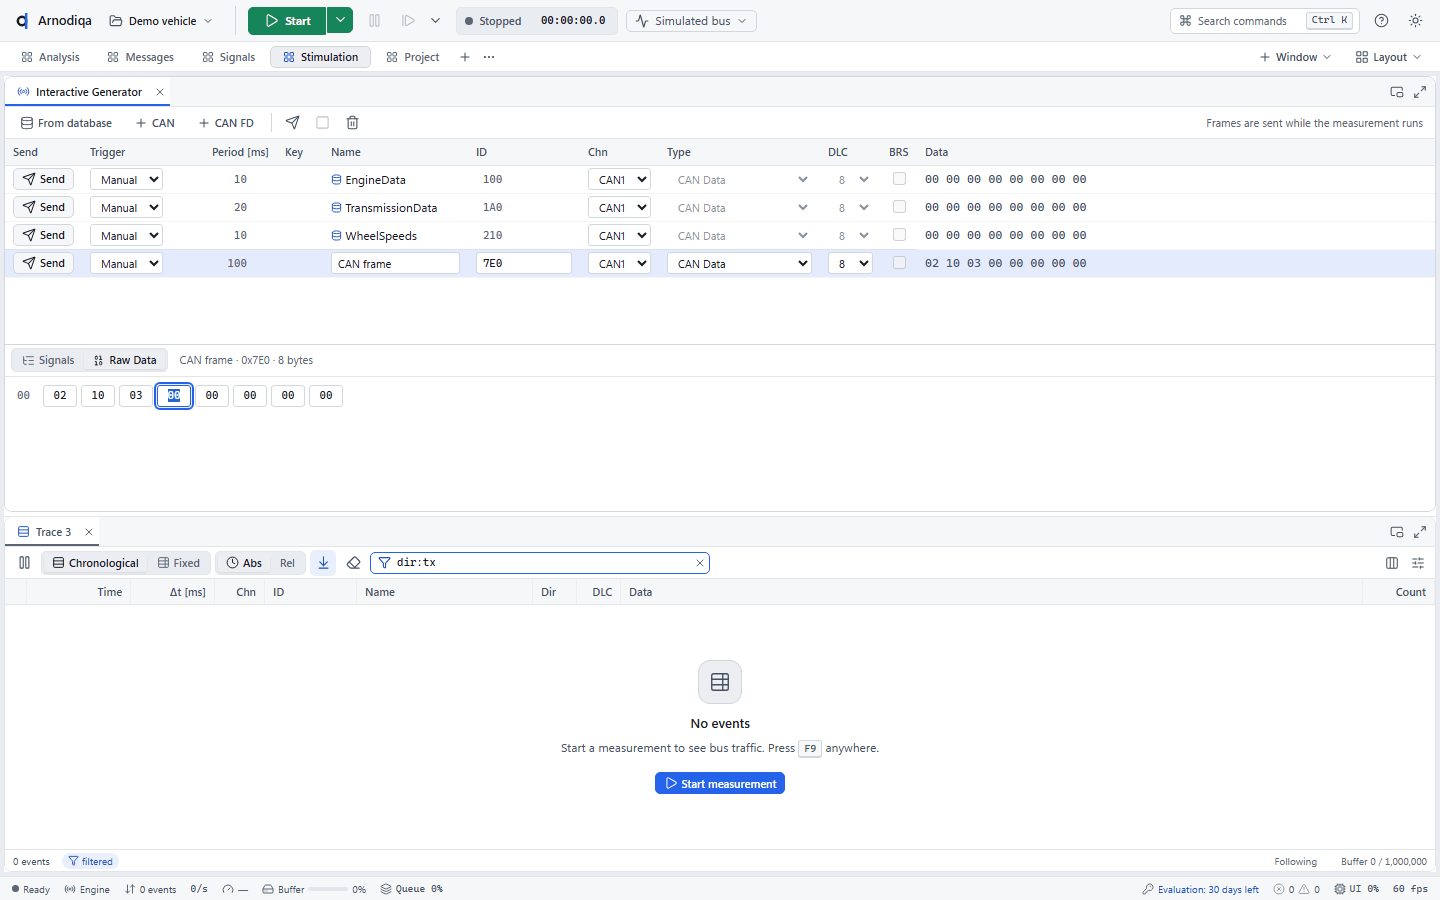
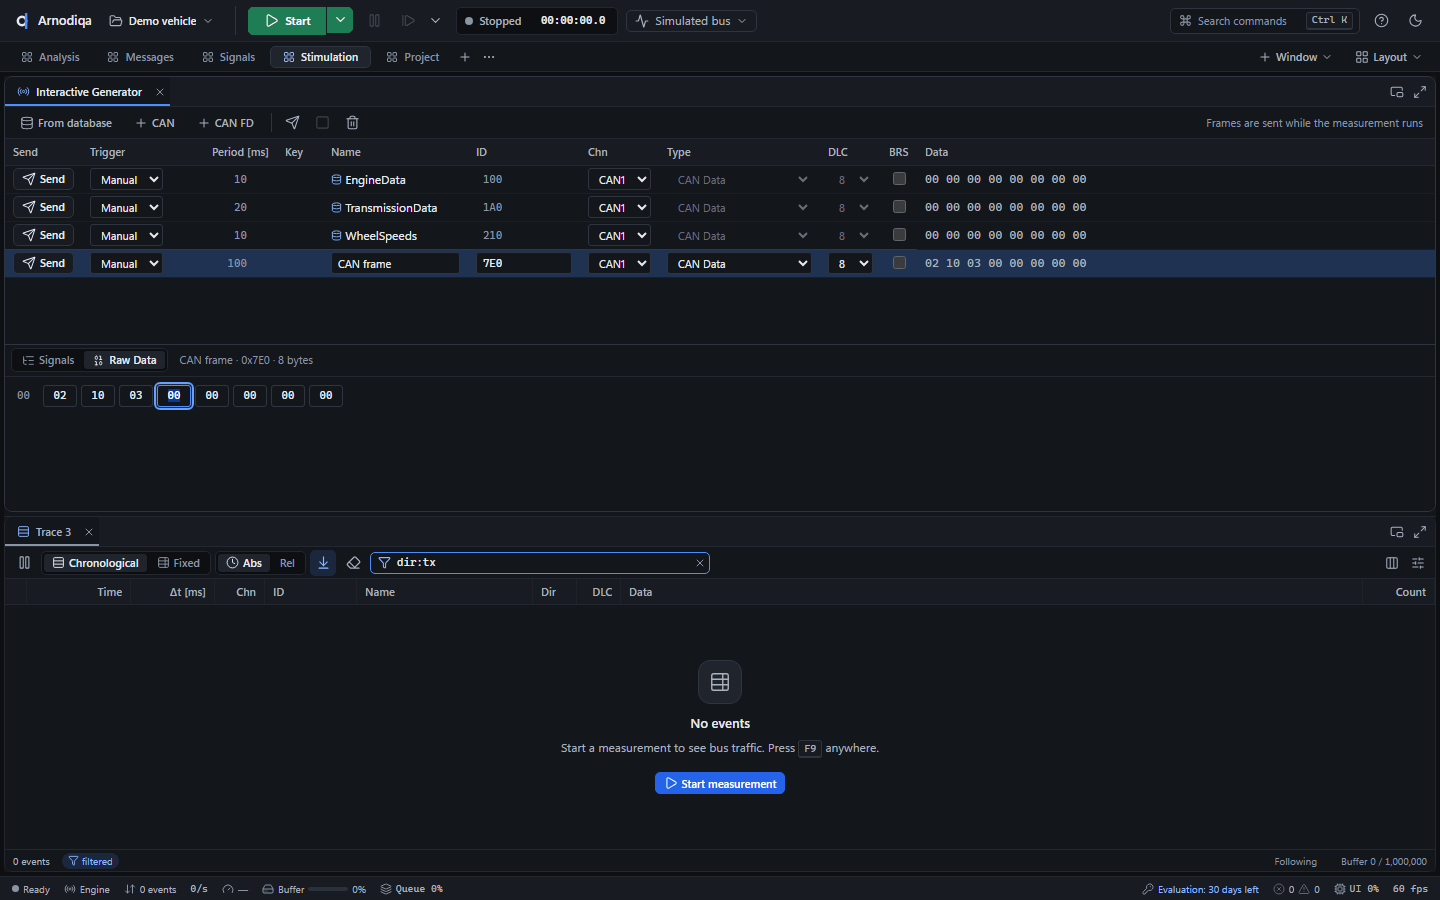
Start de meting. Send zendt het frame één keer. Kies bij Trigger de waarde Periodic, vul de periode in ms in en klik op Send: het frame gaat cyclisch en de knop heet dan Stop.Start the measurement. Send transmits the frame once. Set Trigger to Periodic, enter the period in ms and click Send: the frame is sent cyclically and the button changes to Stop.Démarrez la mesure. Send envoie la trame une fois. Réglez Trigger sur Periodic, saisissez la période en ms et cliquez sur Send : la trame est envoyée de façon cyclique et le bouton devient Stop.
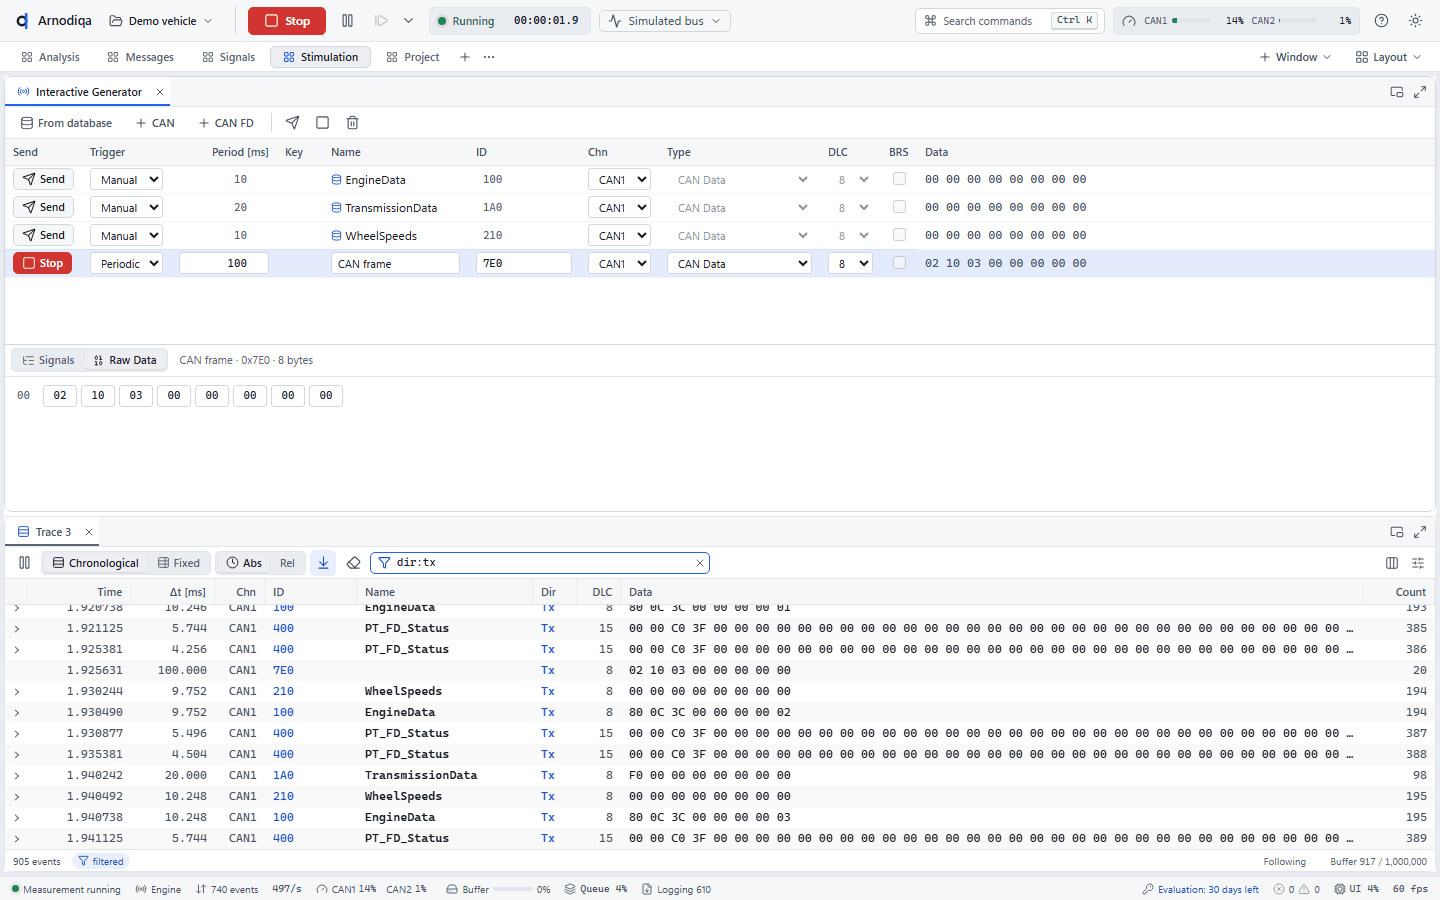
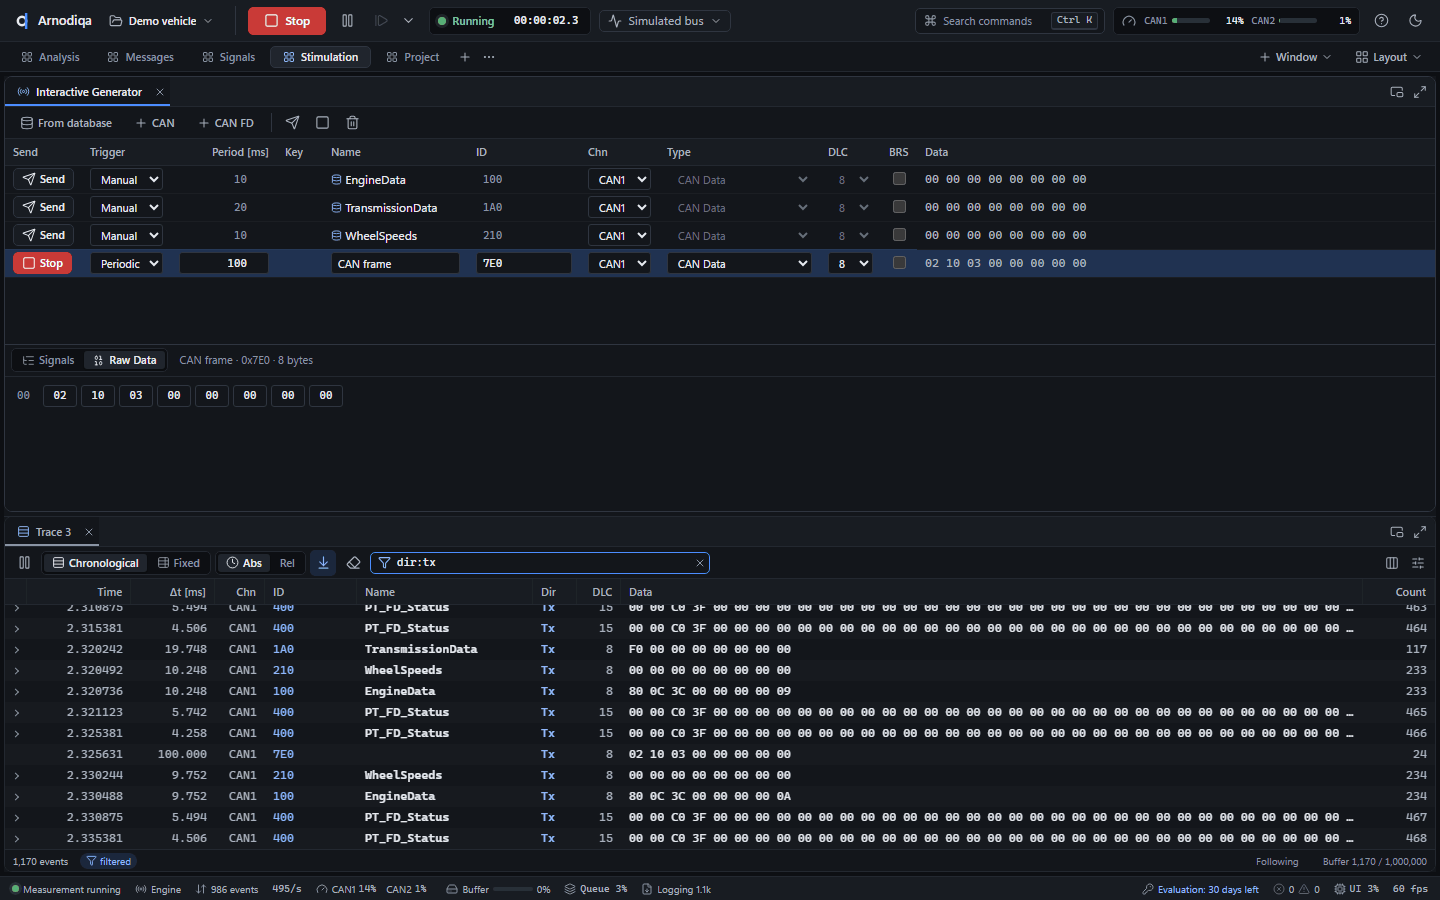
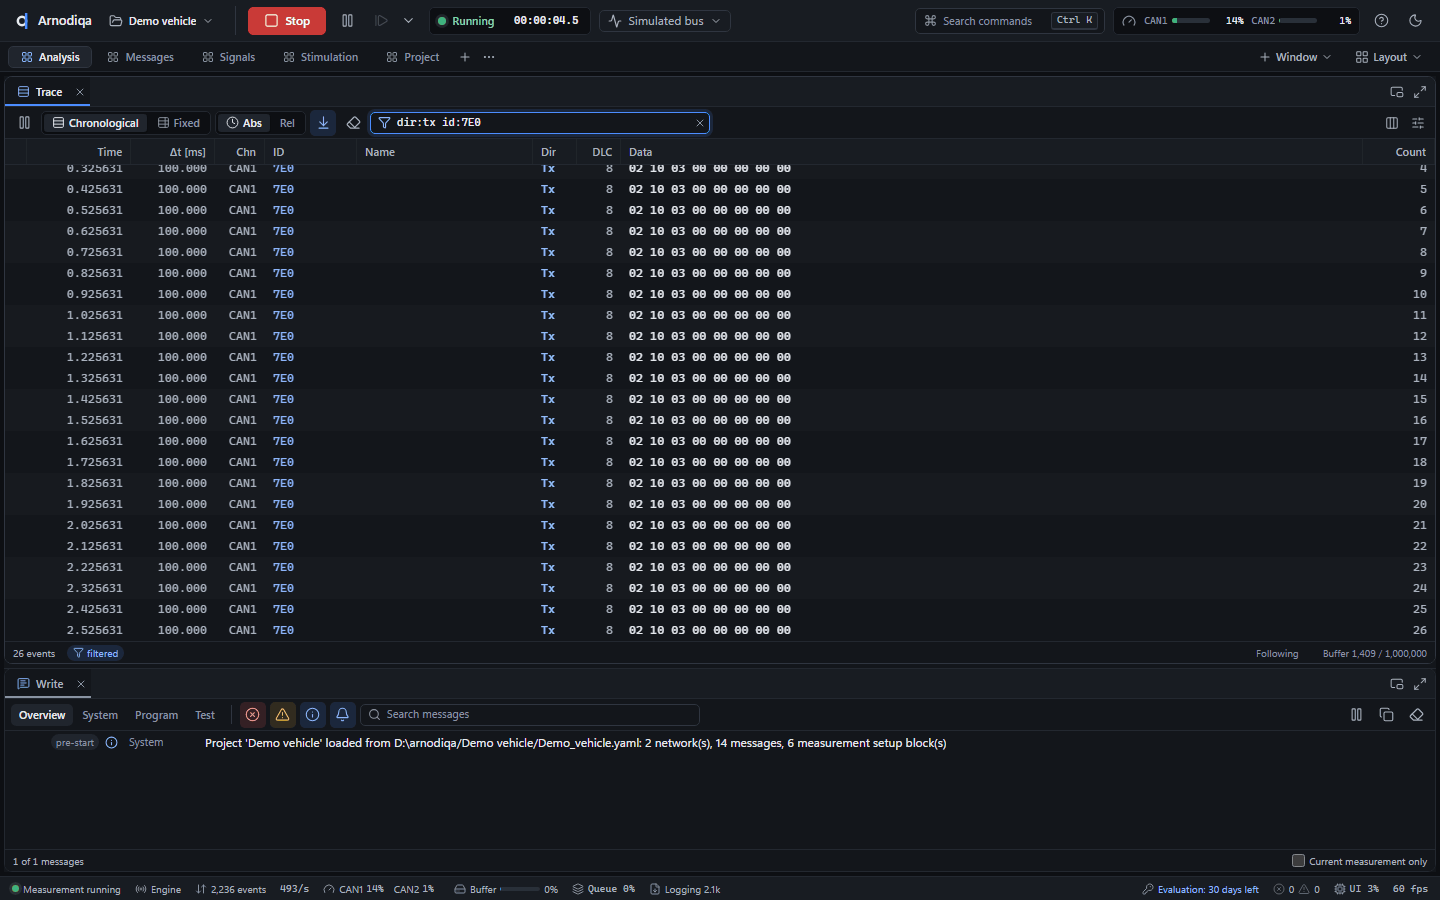
In de Trace op de desktop Analysis verschijnen de gezonden frames met richting Tx; het filter
dir:tx id:7E0toont alleen dit frame.The Trace on the Analysis desktop shows the transmitted frames with direction Tx; the filterdir:tx id:7E0shows only this frame.La Trace du desktop Analysis affiche les trames envoyées avec la direction Tx ; le filtredir:tx id:7E0n'affiche que cette trame.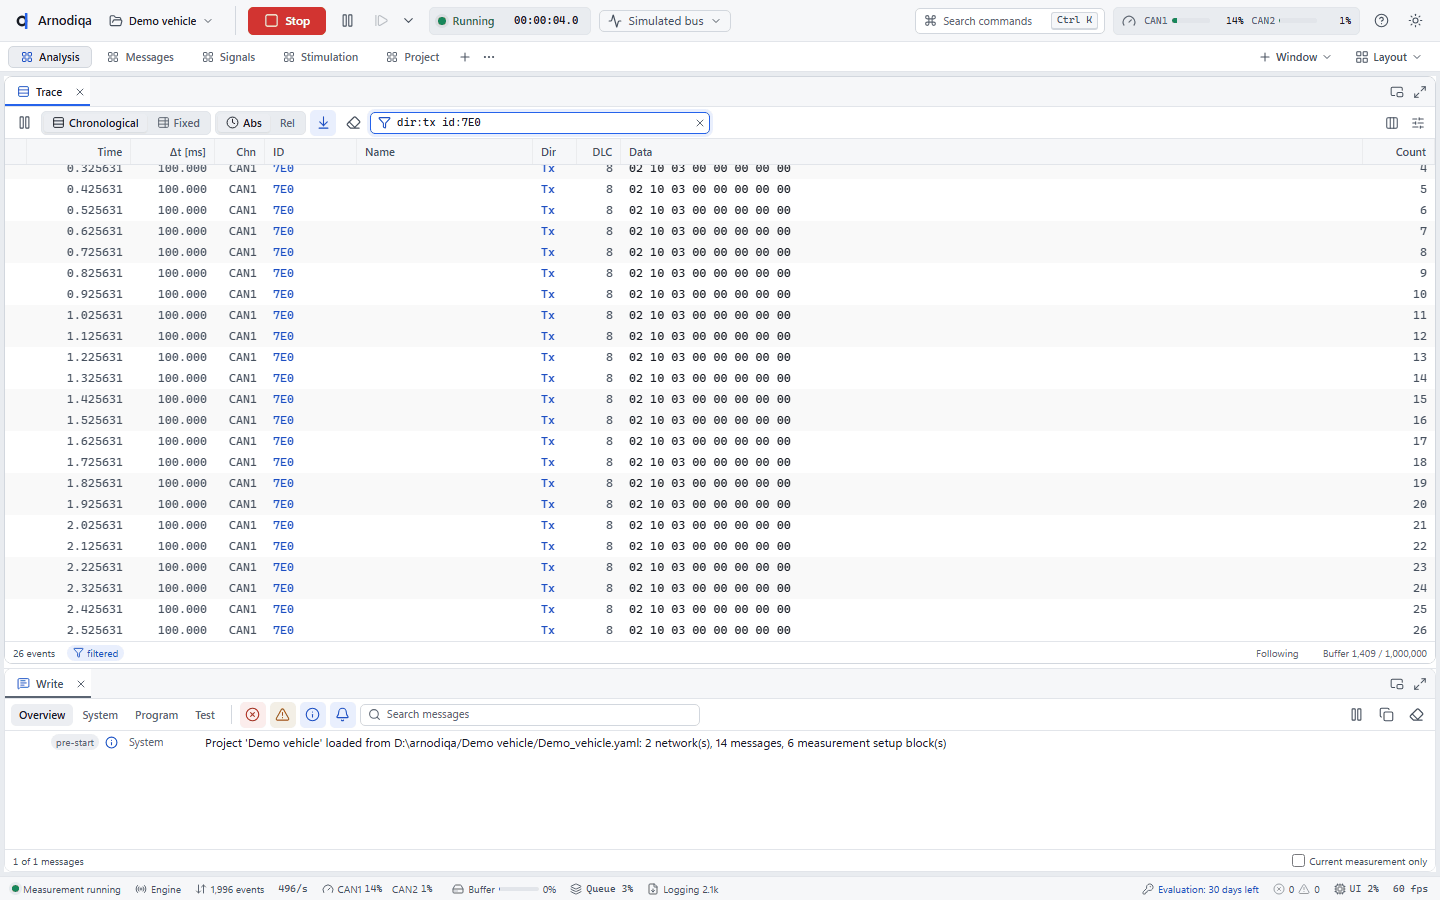
Restbussimulatie: nodes en interaction layerRest-bus simulation: nodes and interaction layerSimulation de bus résiduel : nœuds et couche d'interaction
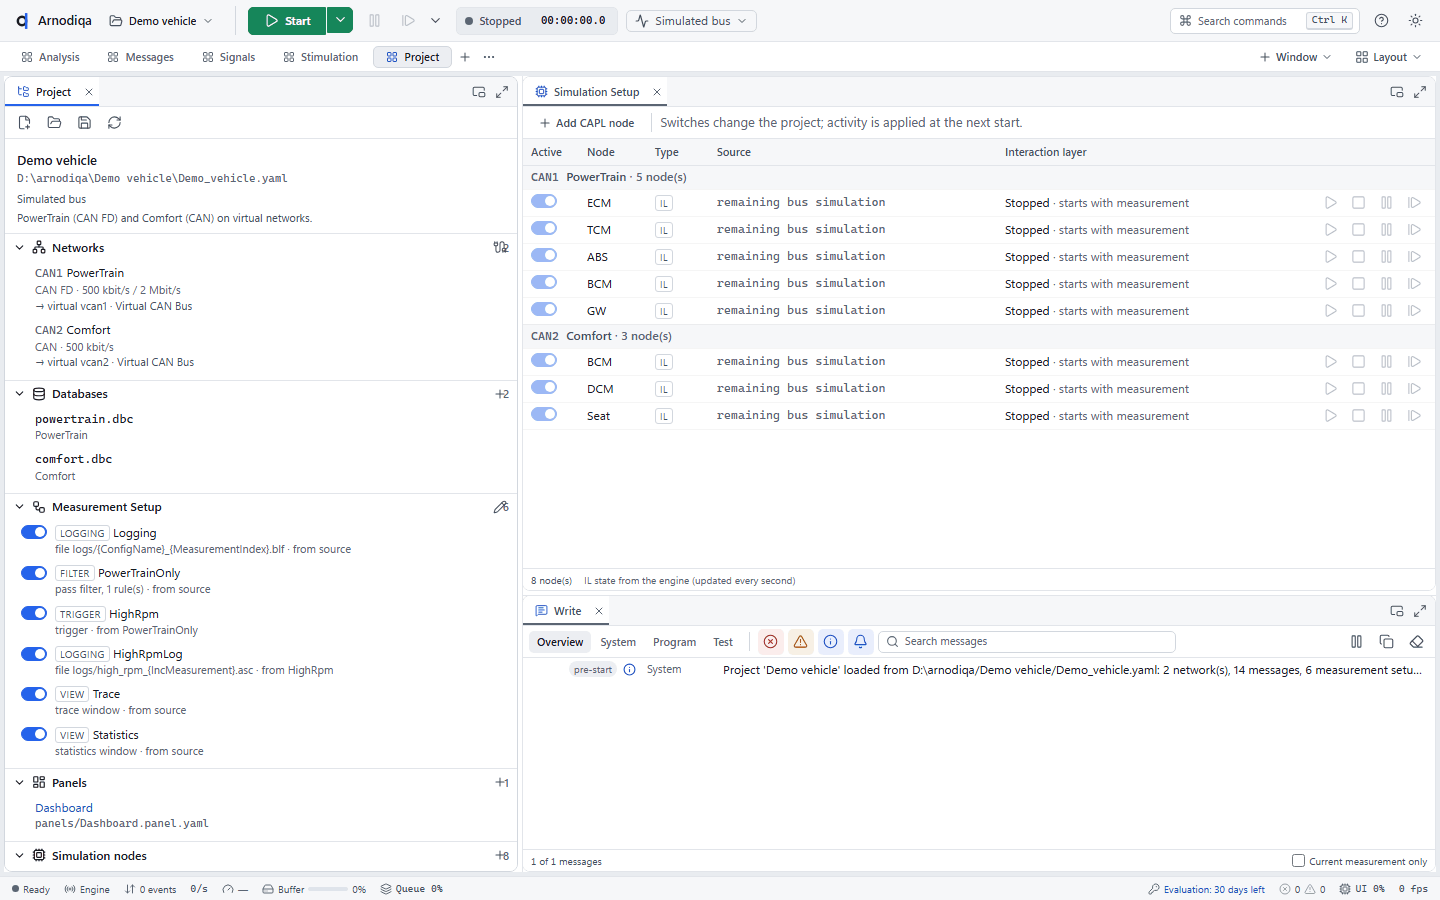
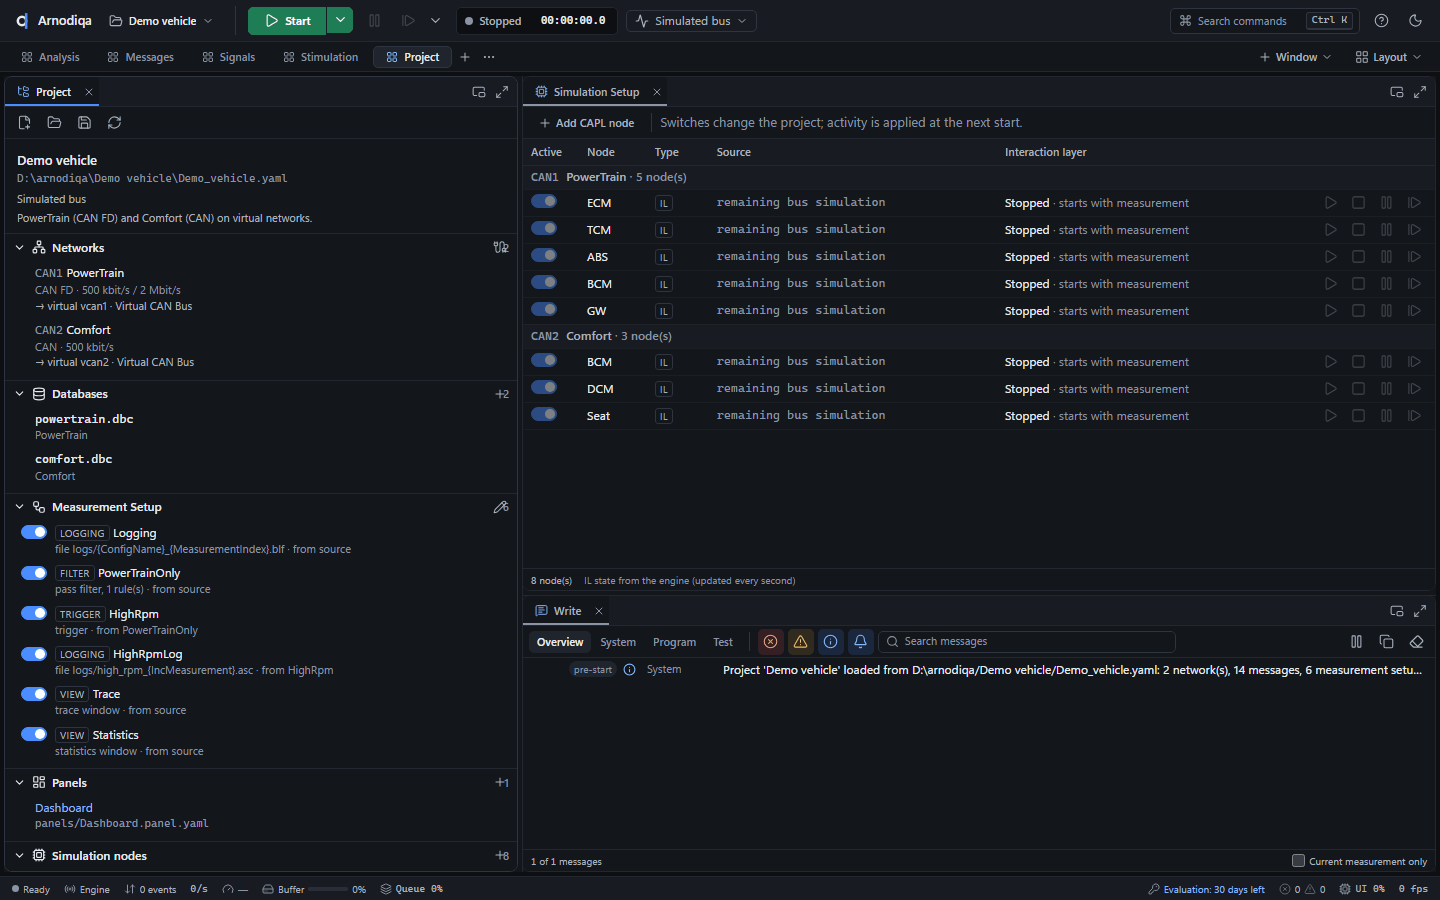
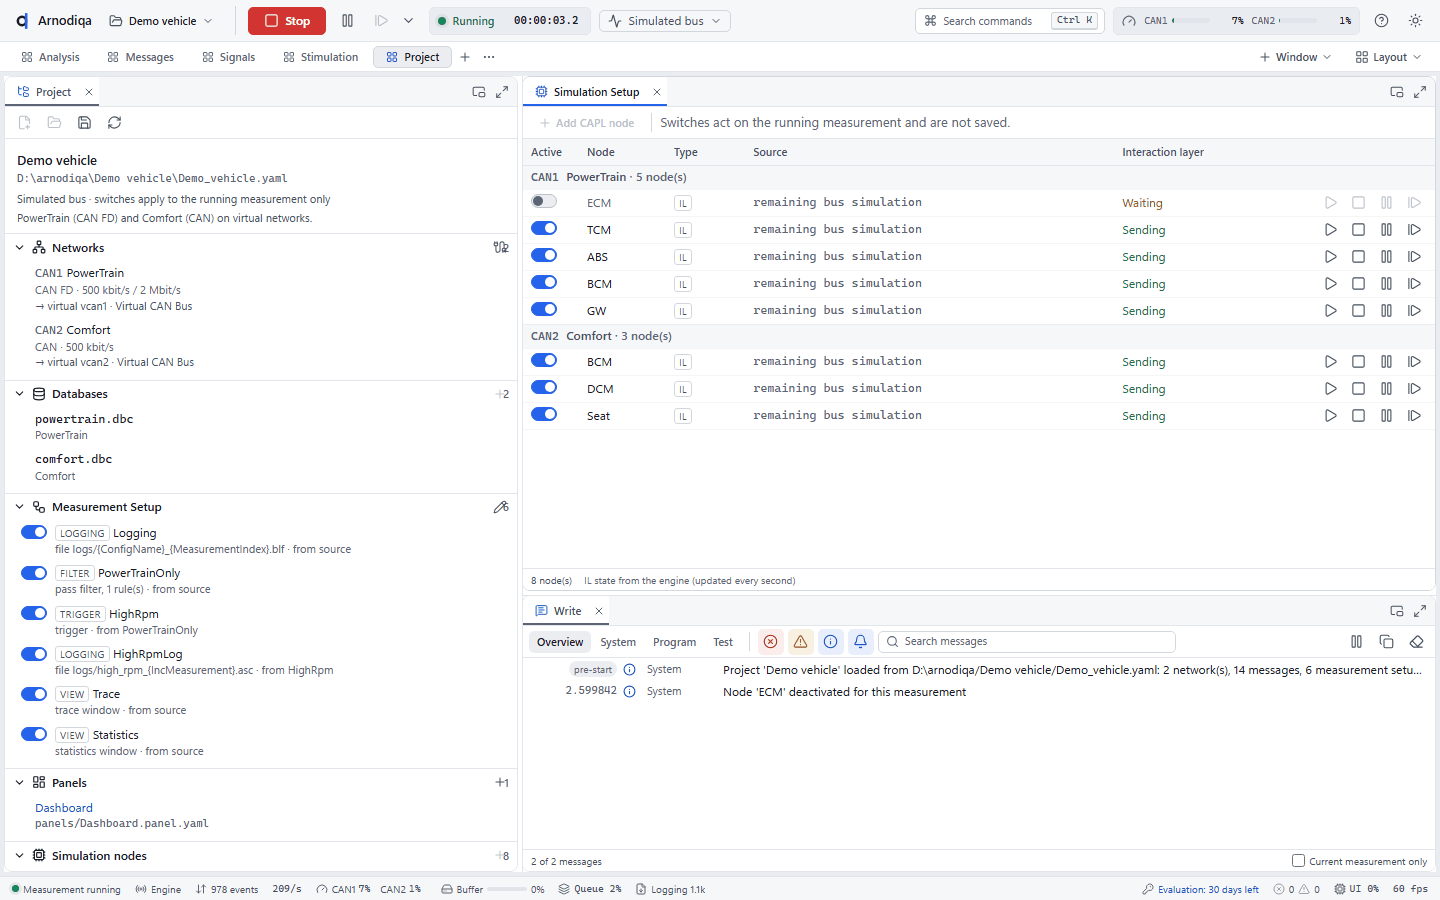
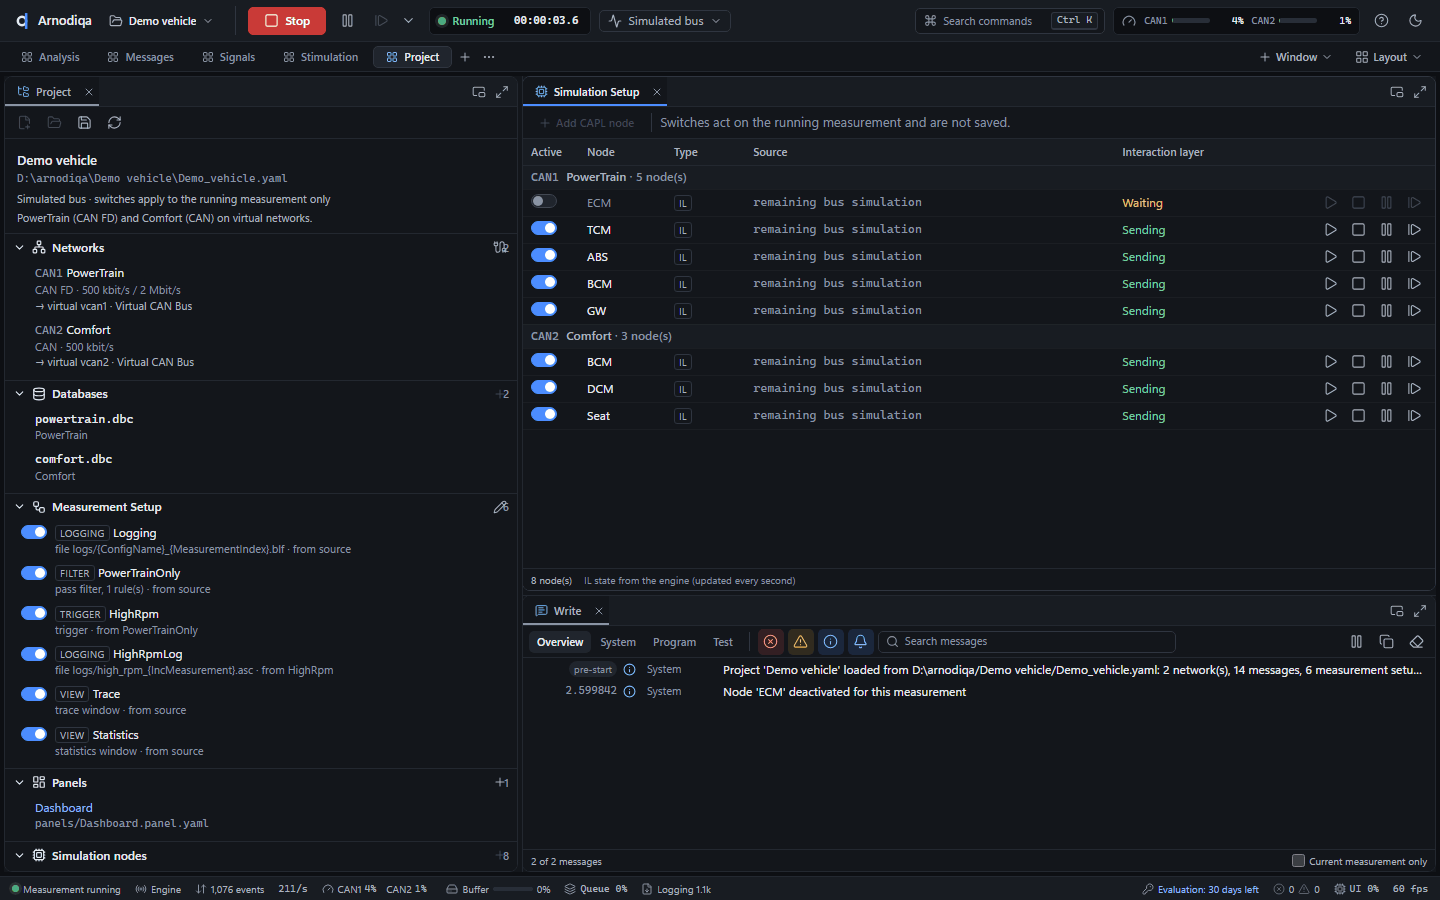
De Simulation Setup toont de gesimuleerde nodes en de toestand van hun interaction layer (IL).The simulation setup shows the simulated nodes and the state of their interaction layer (IL).Le Simulation Setup affiche les nœuds simulés et l'état de leur couche d'interaction (Interaction Layer, IL).
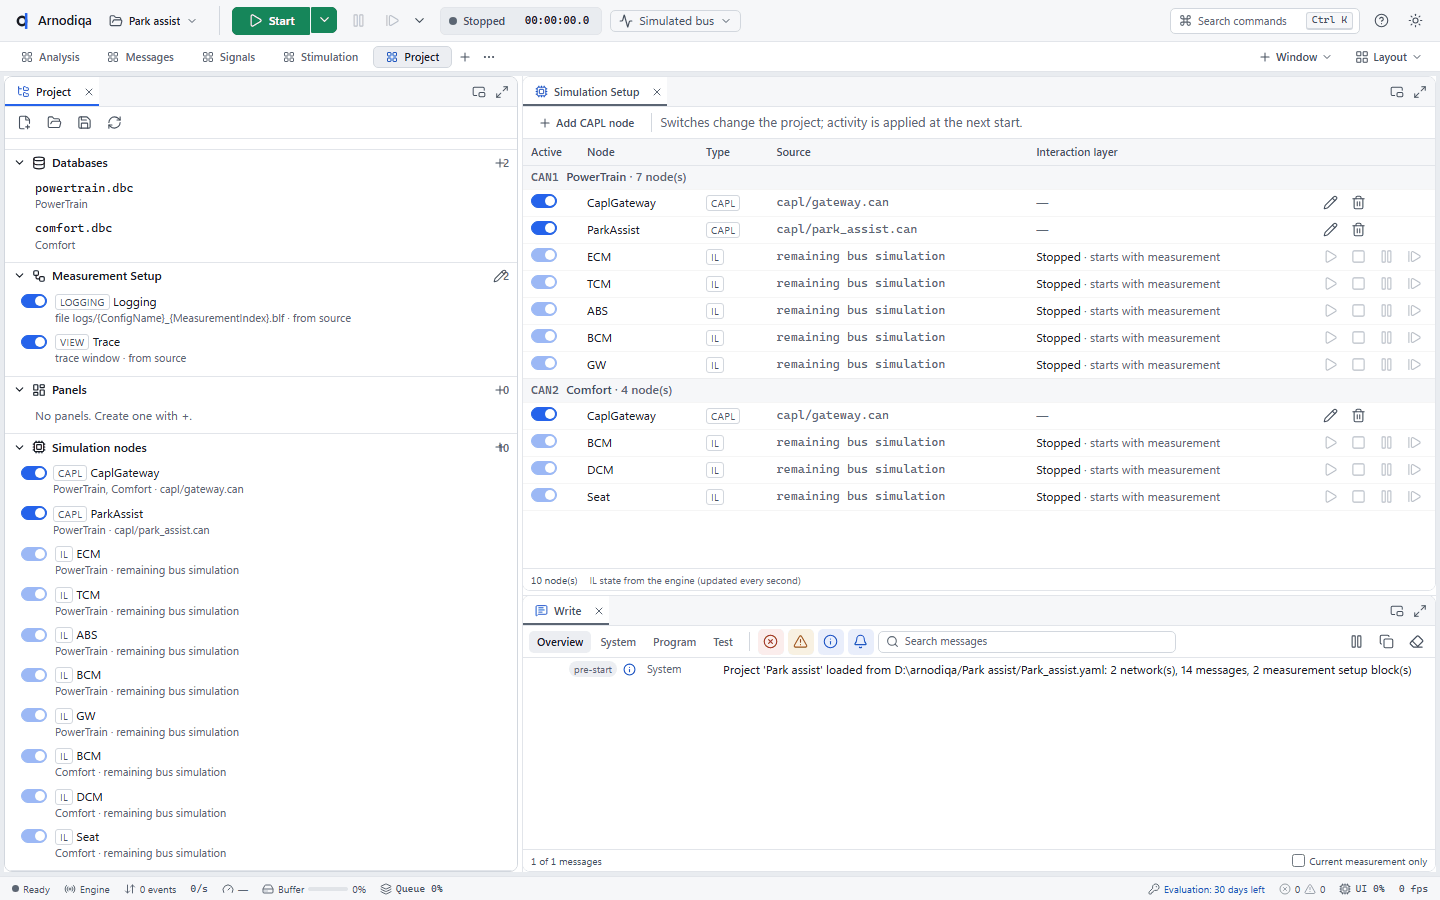
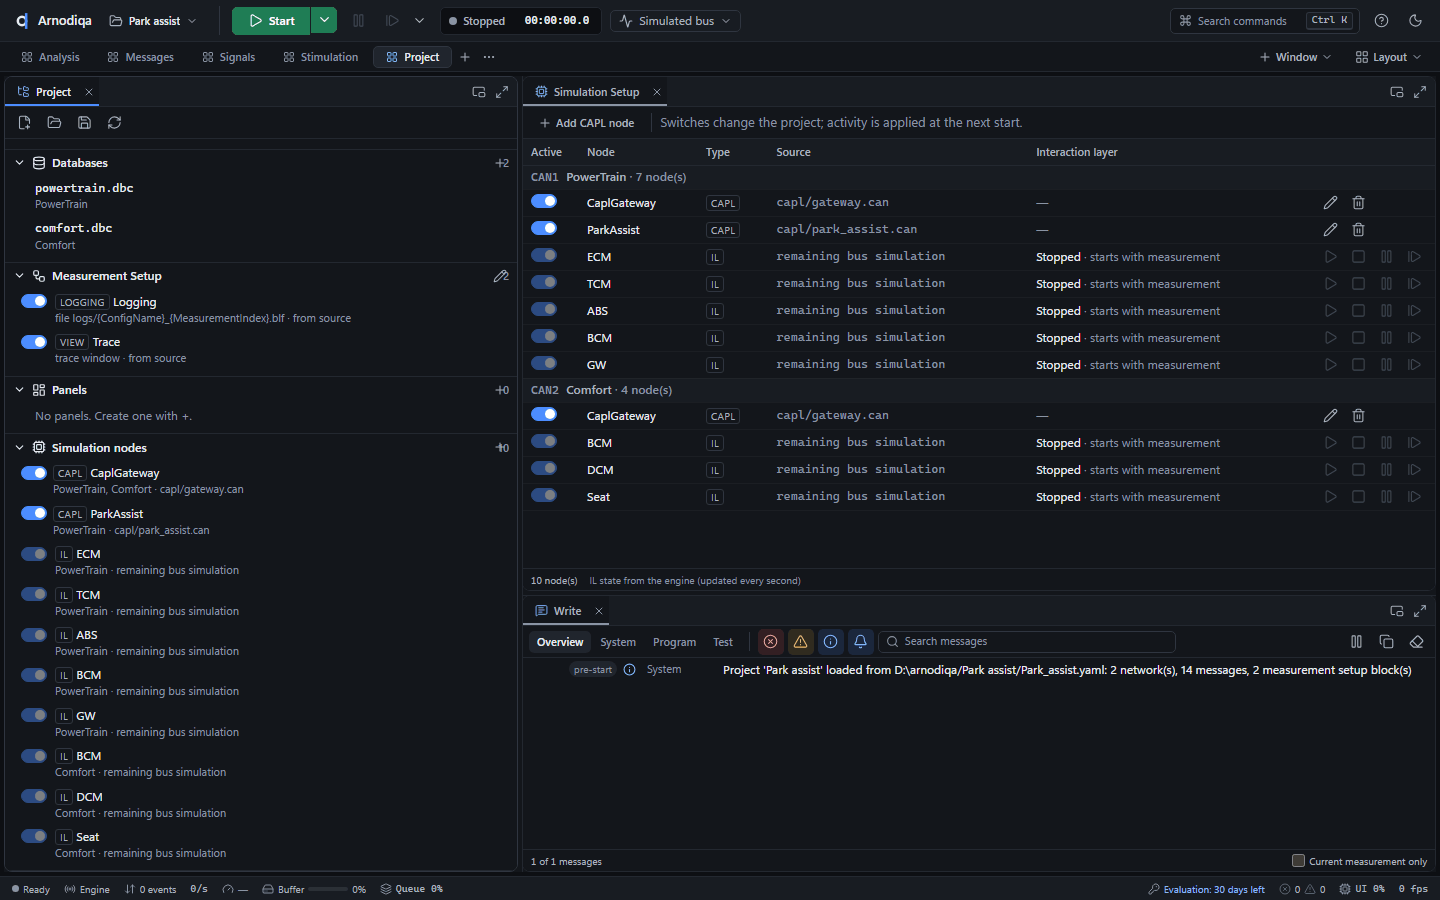
De Simulation Setup staat op de desktop Project, of open hem met Ctrl+K en New Simulation Setup window. Per netwerk zie je de nodes met type (IL = interaction layer), bron en de status van de interaction layer.The simulation setup is on the Project desktop, or open it with Ctrl+K and New Simulation Setup window. For each network you see the nodes with type (IL = interaction layer), source and the state of the interaction layer.Le Simulation Setup se trouve sur le desktop Project ; vous pouvez aussi l'ouvrir avec Ctrl+K et New Simulation Setup window. Pour chaque réseau, vous voyez les nœuds avec leur type (IL = couche d'interaction), leur source et l'état de la couche d'interaction.
Start de meting: de IL-nodes zenden hun berichten volgens de database (Sending).Start the measurement: the IL nodes send their messages according to the database (Sending).Démarrez la mesure : les nœuds IL envoient leurs messages selon la base de données (Sending).
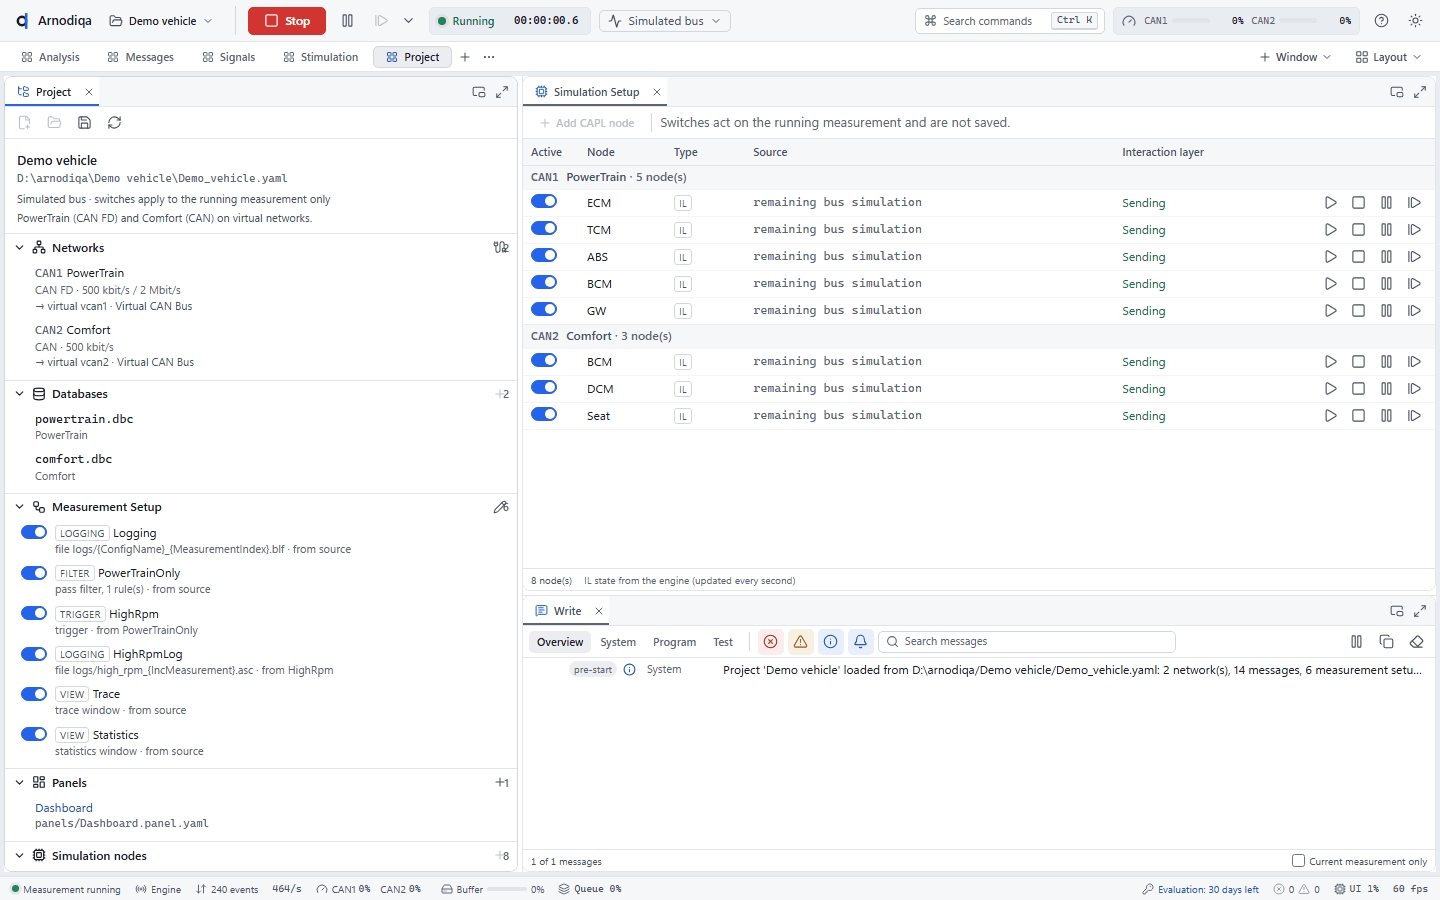
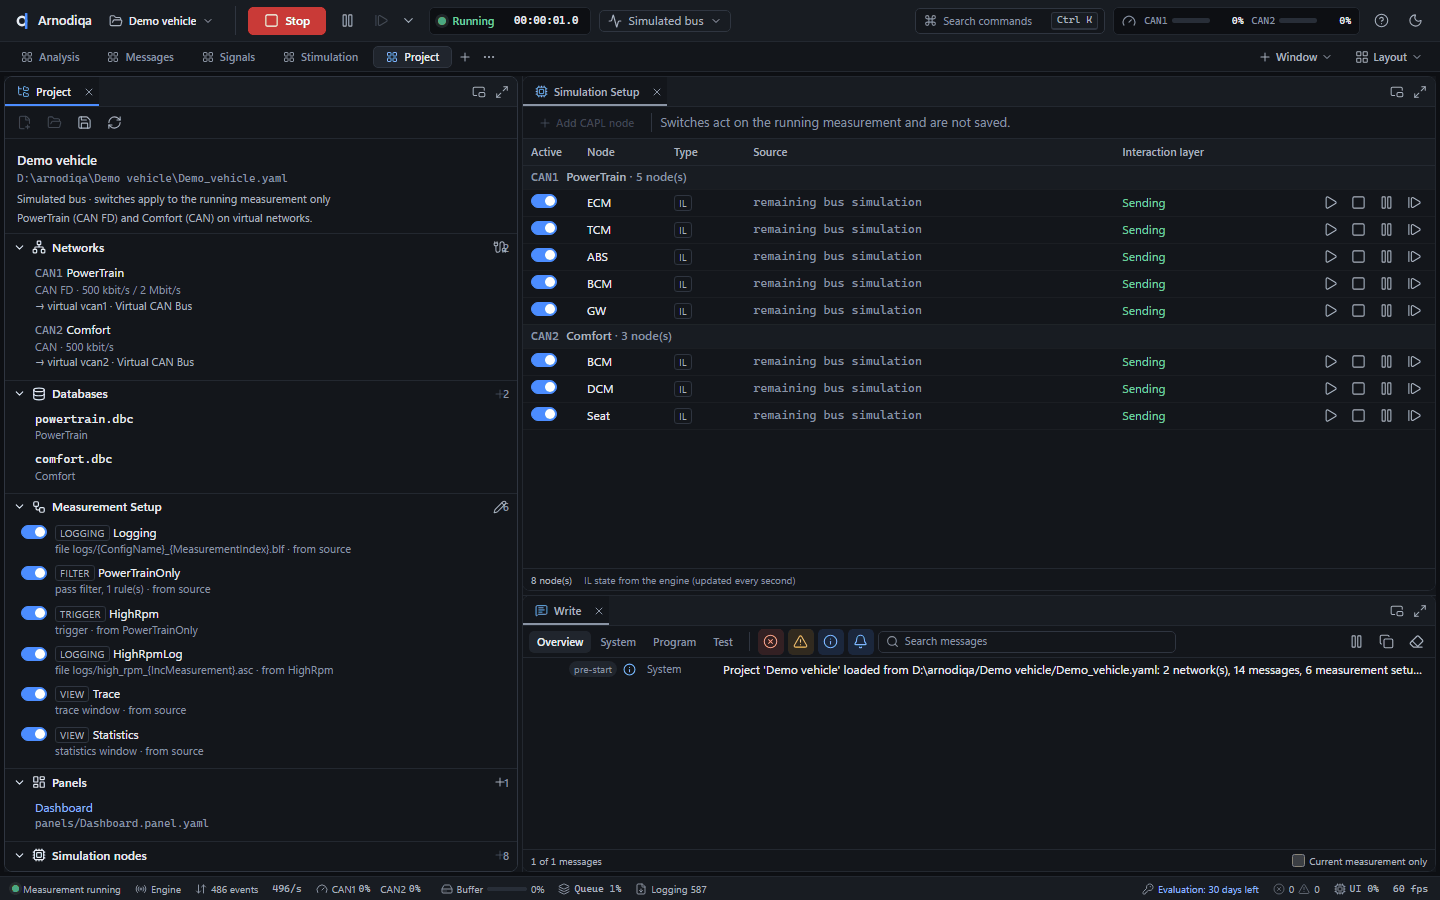
Met Stop IL en Start IL rechts op de regel zet je de interaction layer van één node stil of weer aan, terwijl de meting doorloopt.Use Stop IL and Start IL at the right of the row to stop or restart the interaction layer of one node while the measurement continues.Stop IL et Start IL, à droite de la ligne, arrêtent ou relancent la couche d'interaction d'un nœud pendant que la mesure continue.
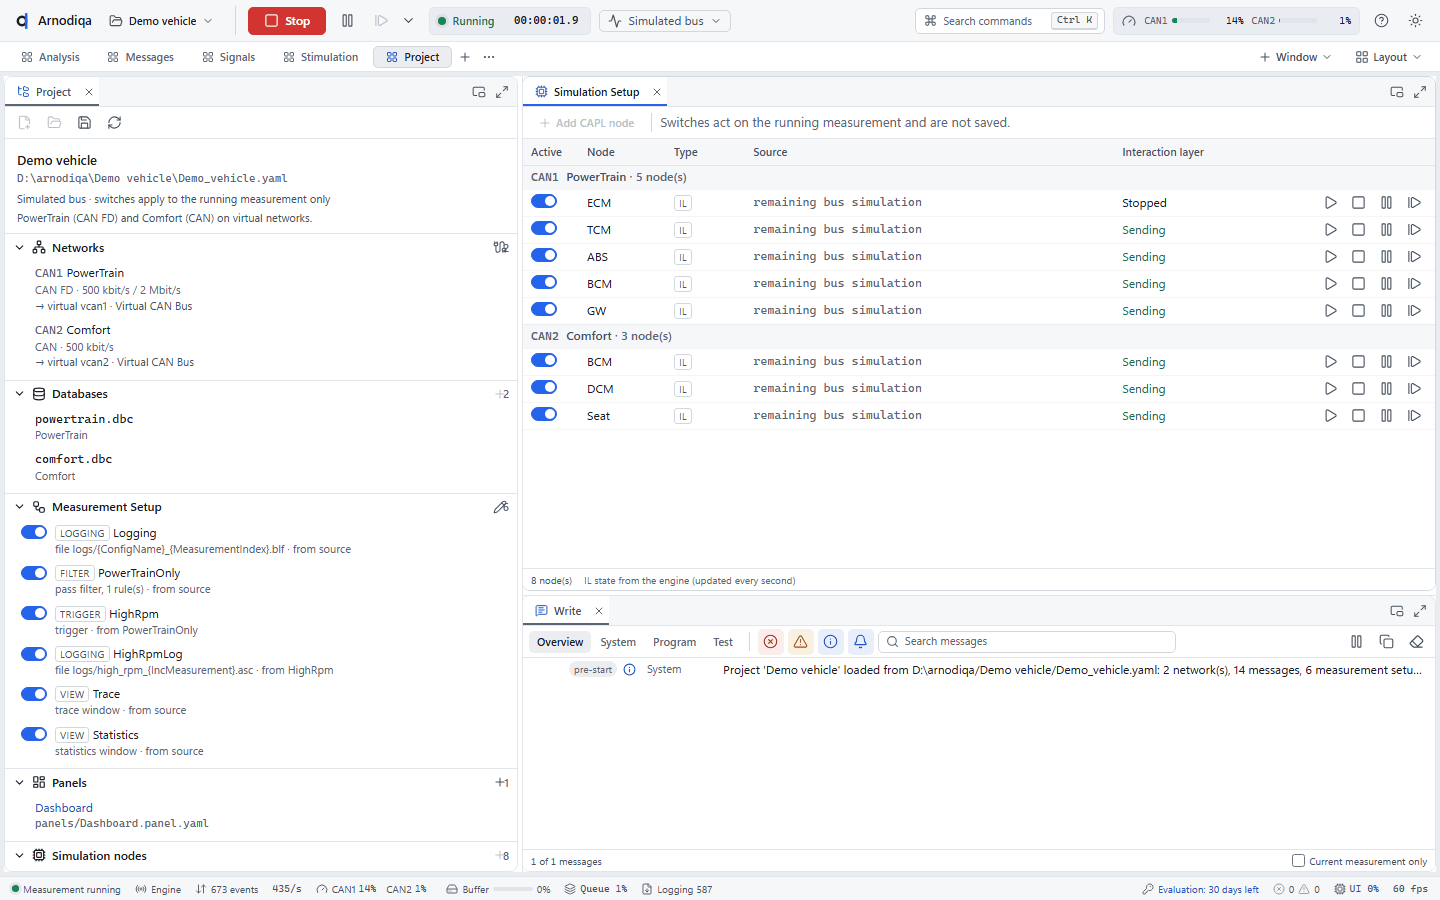
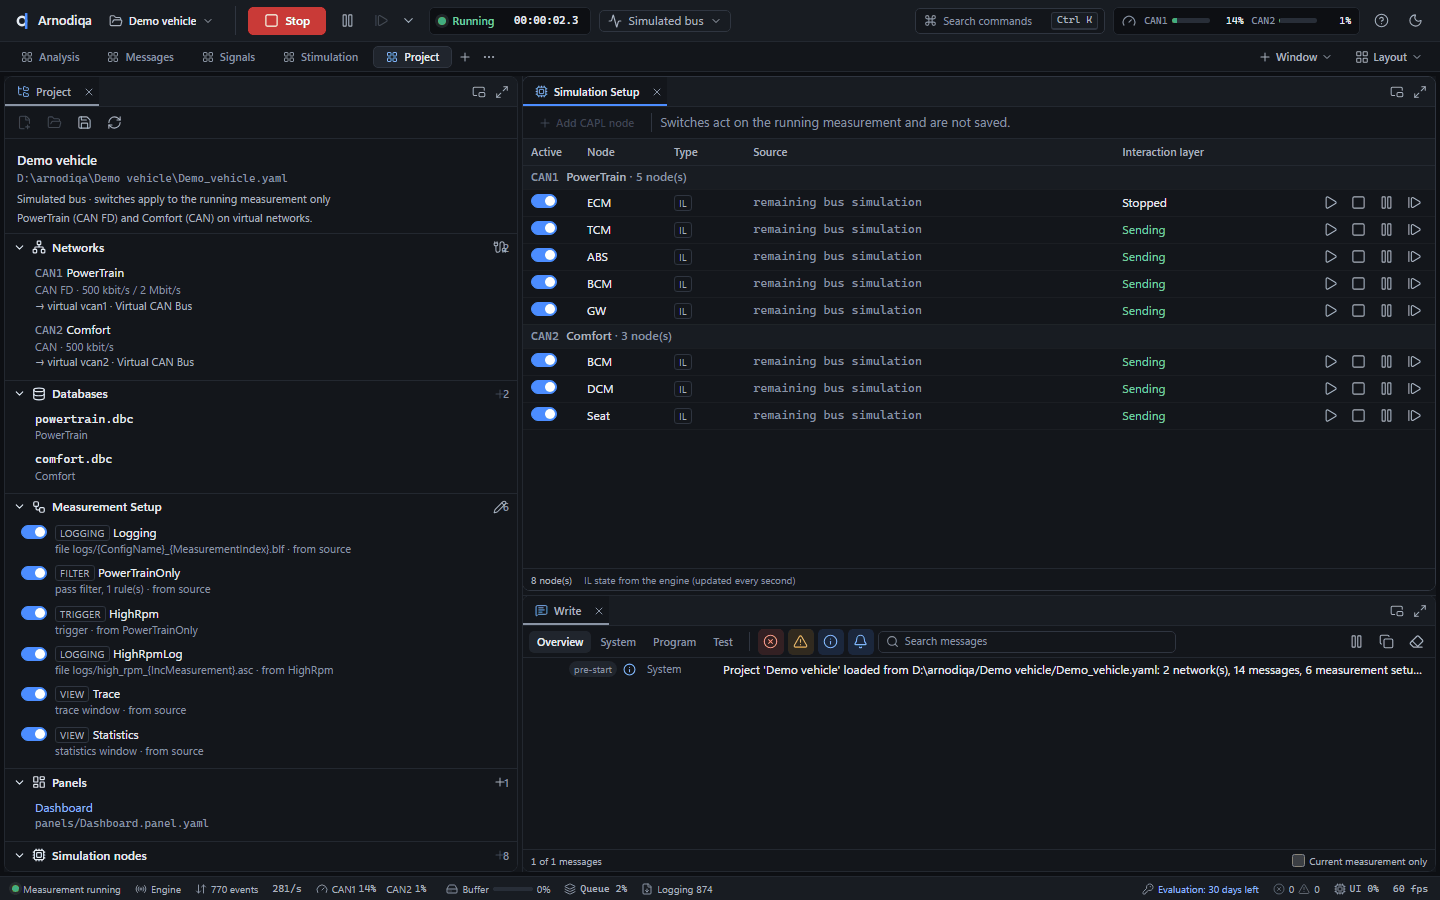
De schakelaar in de kolom Active zet een node helemaal uit, bijvoorbeeld om een echte ECU in de plaats te laten zenden. Tijdens de meting geldt dat alleen voor deze meting; bij een gestopte meting wijzigt de schakelaar het project.The switch in the Active column turns a node off completely, for example to let a real ECU transmit in its place. During a measurement this applies to that measurement only; when stopped, the switch changes the project.L'interrupteur de la colonne Active désactive complètement un nœud, par exemple pour laisser un vrai calculateur émettre à sa place. Pendant une mesure, ce réglage ne vaut que pour cette mesure ; lorsque la mesure est arrêtée, l'interrupteur modifie le projet.
Opnemen, offline afspelen en replayRecord, replay offline and replay blocksEnregistrer, relire hors ligne et rejouer sur le bus
Logging-blokken in de Measurement Setup schrijven BLF, ASC, MF4 of PCAPNG. Een opname speel je offline af door dezelfde analyse als een live meting, of zet je met een replay-blok terug op de bus.Logging blocks in the measurement setup write BLF, ASC, MF4 or PCAPNG. A recording is replayed offline through the same analysis as a live measurement, or put back on the bus with a replay block.Les blocs de journalisation du Measurement Setup écrivent en BLF, ASC, MF4 ou PCAPNG. Un enregistrement peut être relu hors ligne à travers la même analyse qu'une mesure en direct, ou renvoyé sur le bus avec un bloc de rejeu (replay).
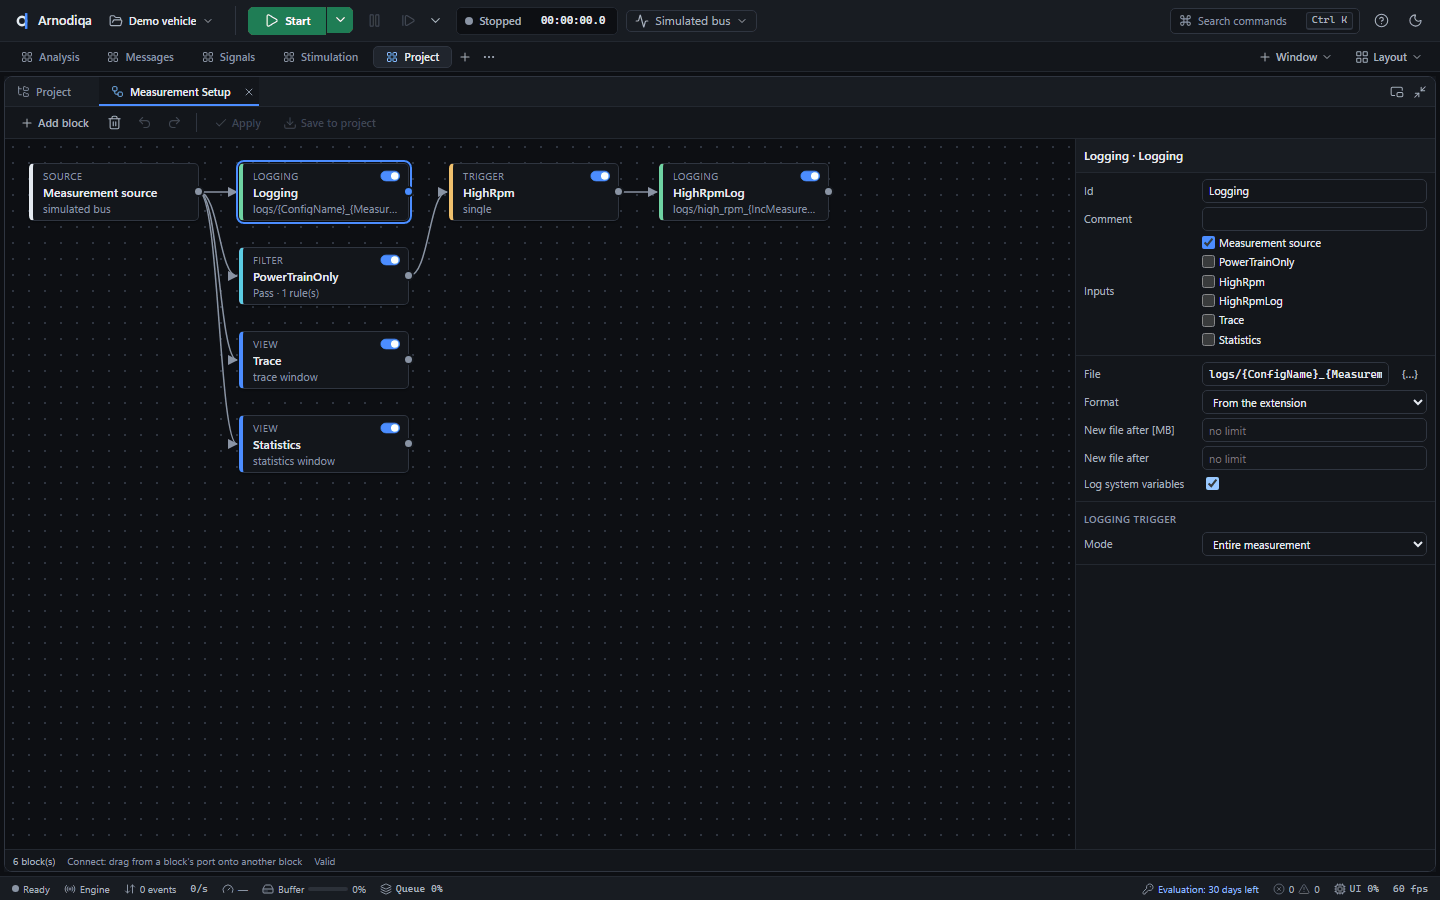
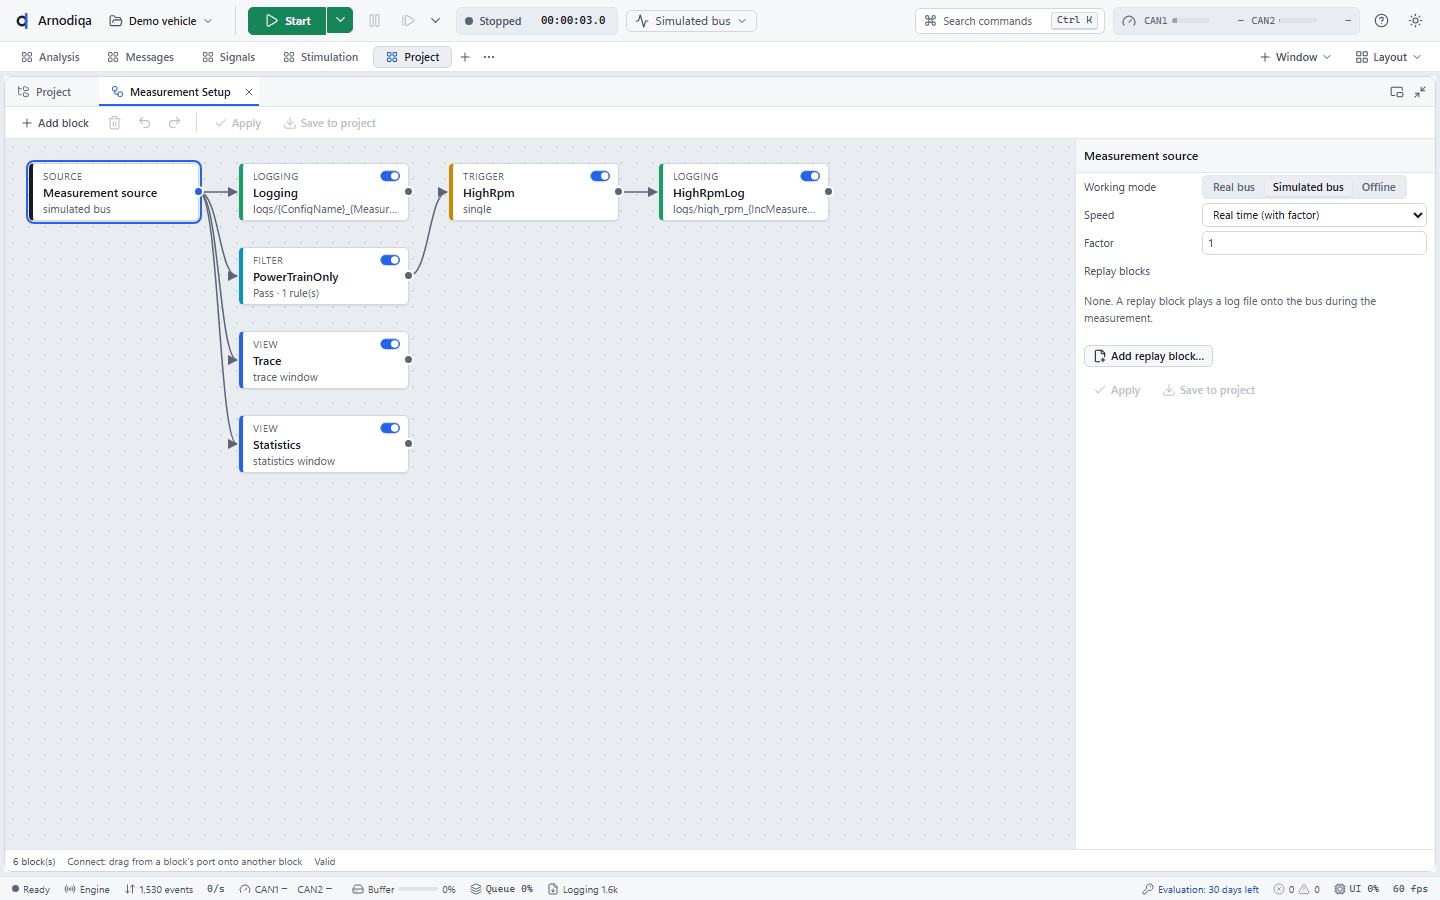
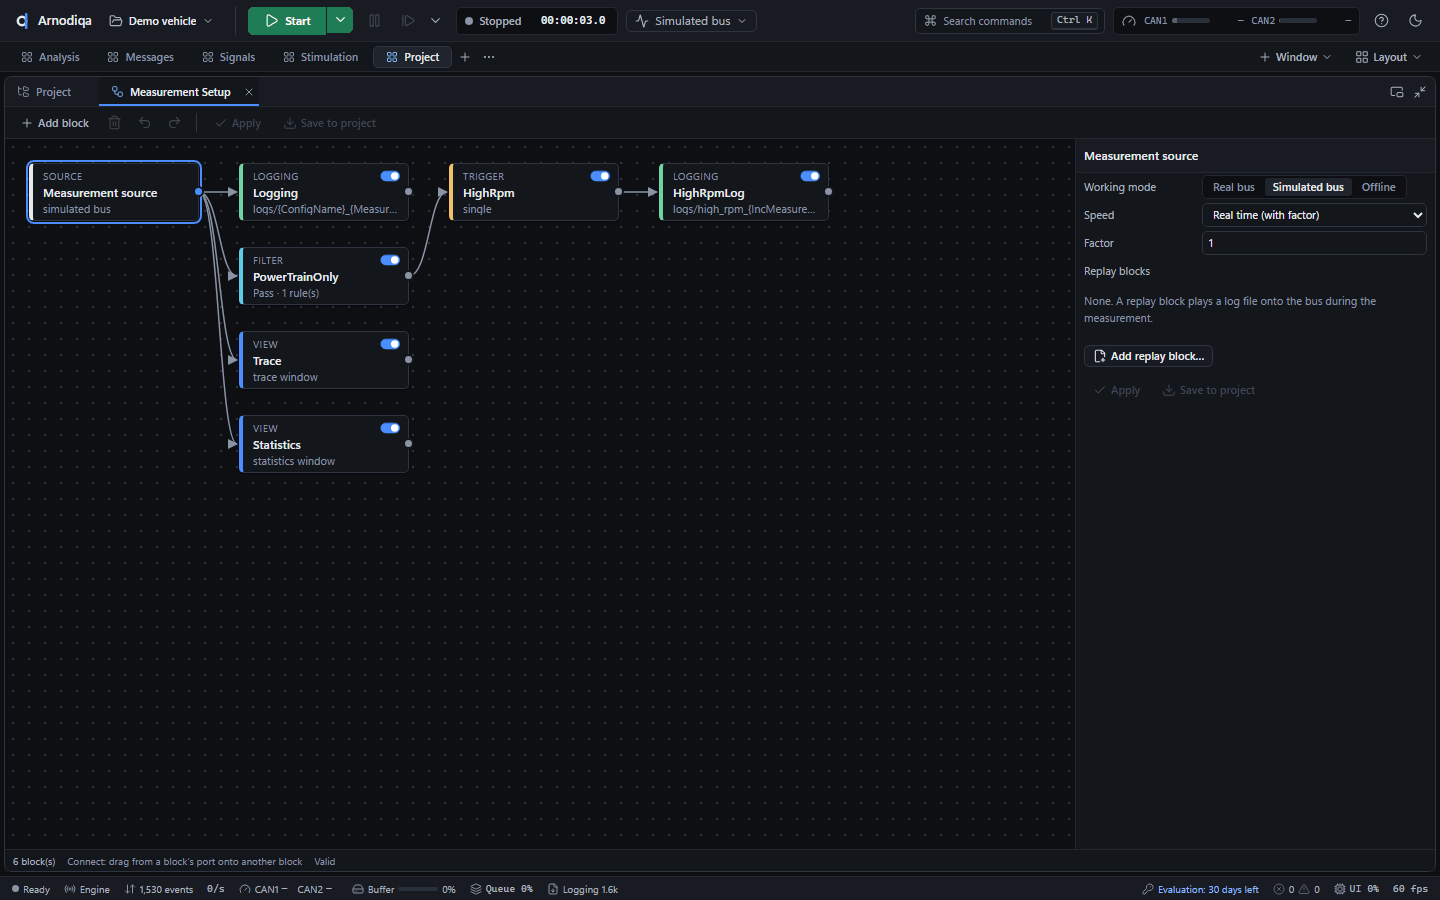
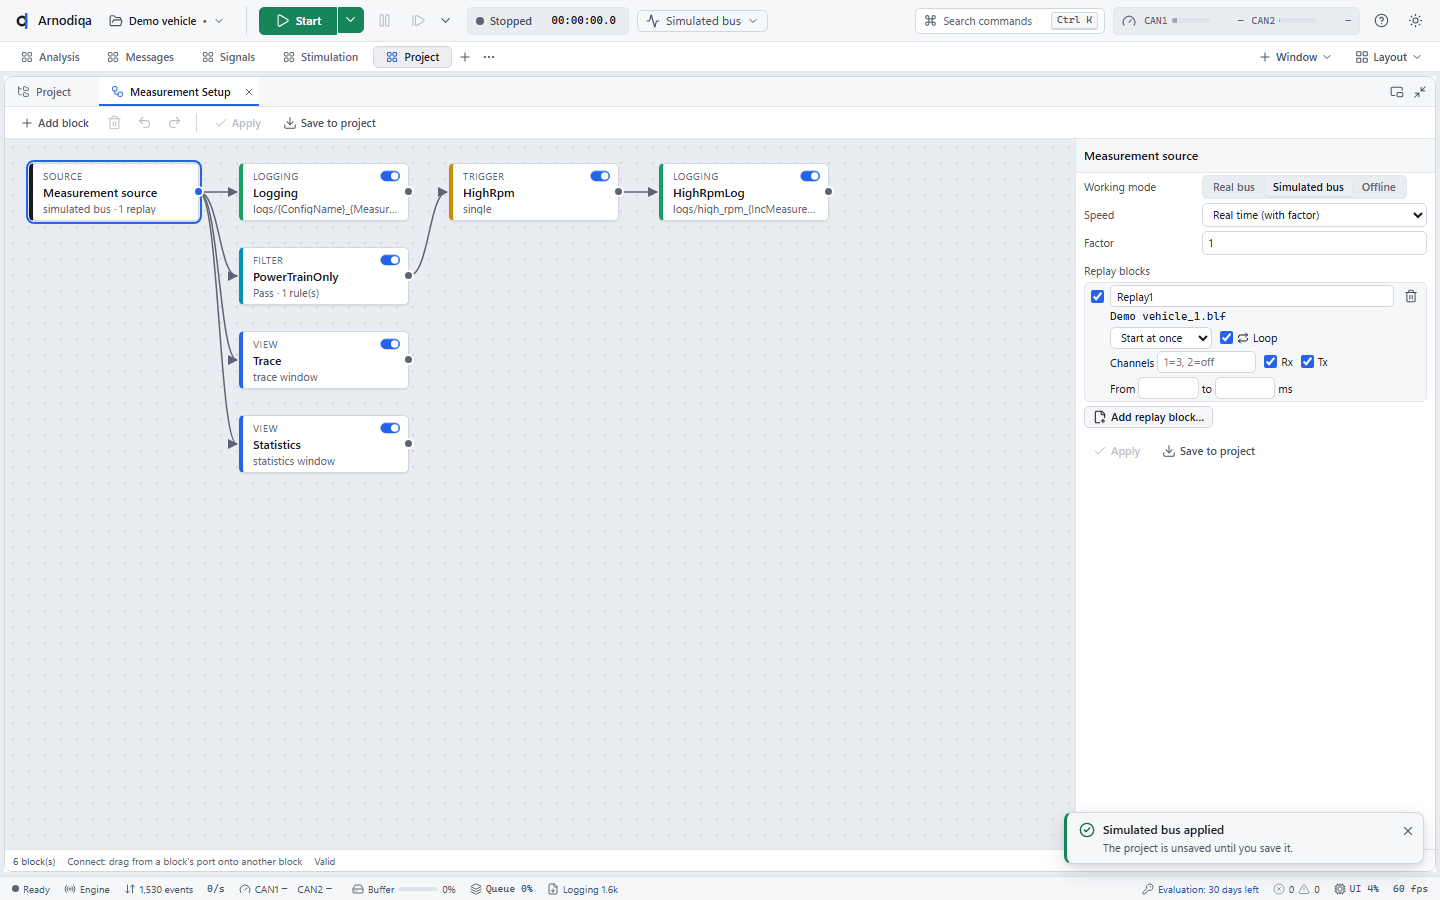
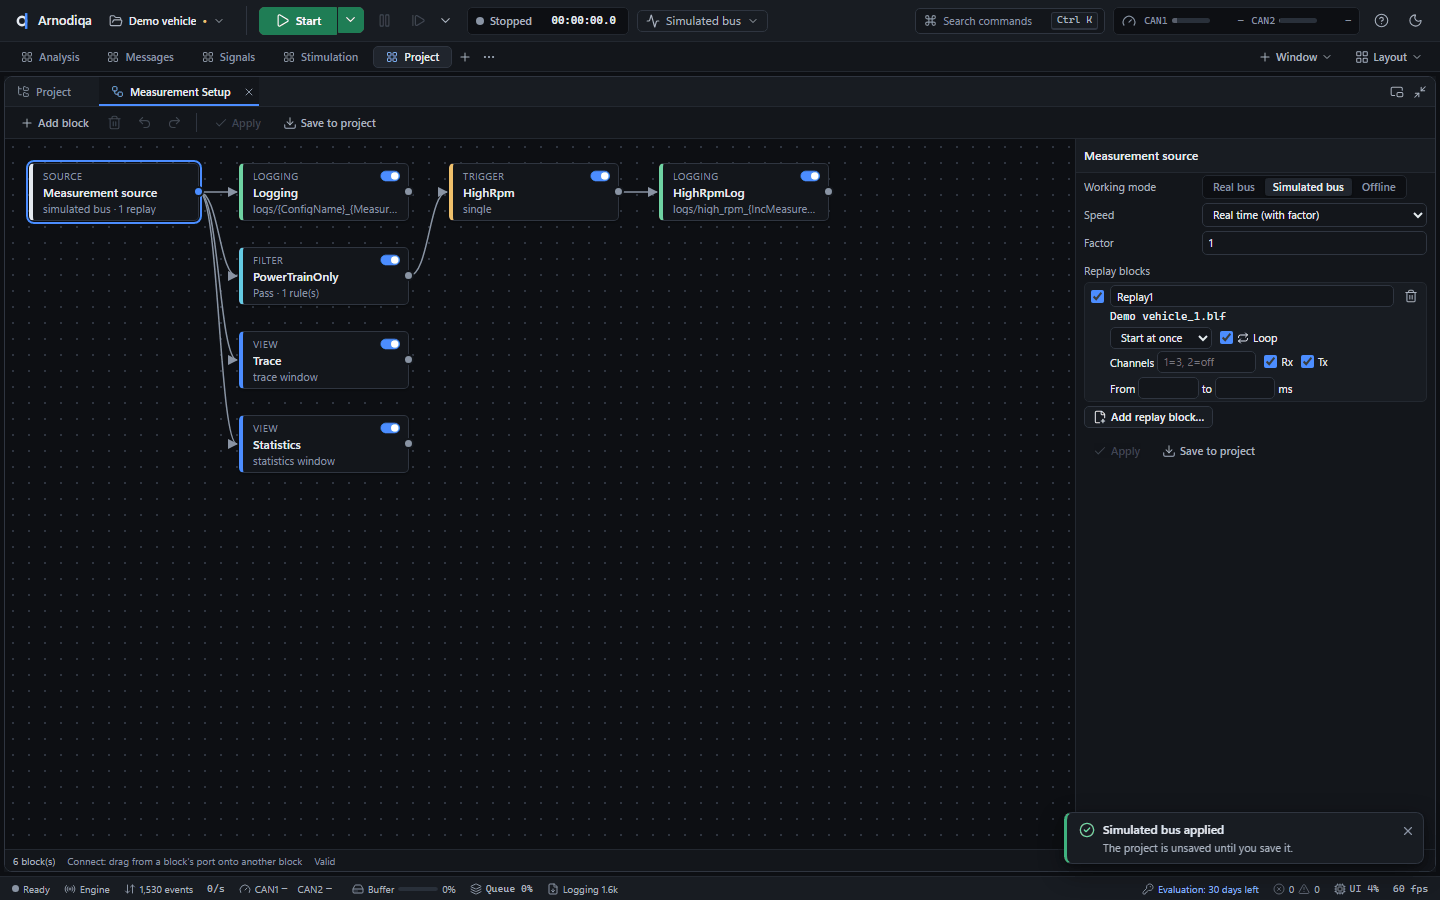
Klik in de projectverkenner op het potlood bij Measurement Setup. De editor toont de graaf van Measurement source naar filters, triggers, logging en vensters. Bij een logging-blok staan rechts File (met field codes zoals {MeasurementIndex}, knop
{…}), Format, New file after [MB] en de Logging trigger. Add block voegt een blok toe; Apply en Save to project bewaren de wijziging.In the project explorer, click the pencil next to Measurement Setup. The editor shows the graph from Measurement source to filters, triggers, logging and windows. For a logging block, the right side shows File (with field codes such as {MeasurementIndex}, button{…}), Format, New file after [MB] and the Logging trigger. Add block adds a block; Apply and Save to project keep the change.Dans l'explorateur de projet, cliquez sur le crayon à côté de Measurement Setup. L'éditeur affiche le graphe qui va de Measurement source aux filtres, déclencheurs, blocs de journalisation et fenêtres. Pour un bloc de journalisation, la partie droite affiche File (avec des codes de champ tels que {MeasurementIndex}, bouton{…}), Format, New file after [MB] et le Logging trigger. Add block ajoute un bloc ; Apply et Save to project conservent la modification.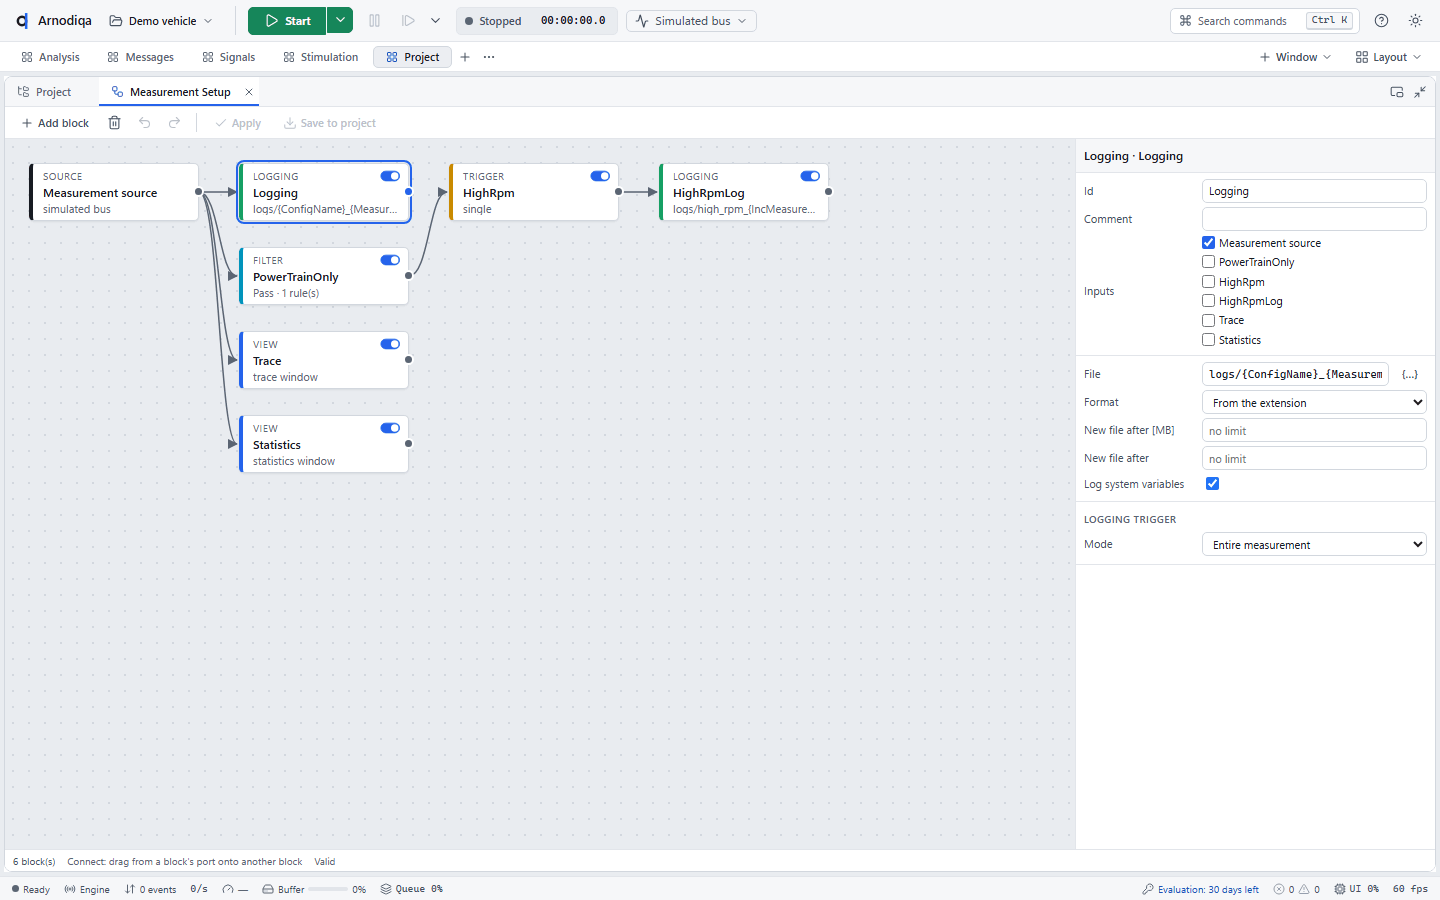
Start en stop de meting. Elk ingeschakeld logging-blok schrijft zijn bestand in de projectmap, hier logs/Demo vehicle_1.blf en voor het trigger-blok HighRpm logs/high_rpm_001.asc. De statusbalk toont tijdens de meting Logging met het aantal events. De schakelaar bij een blok in de projectverkenner zet logging aan of uit; Start measurement without logging slaat logging één keer over.Start and stop the measurement. Each enabled logging block writes its file in the project folder, here logs/Demo vehicle_1.blf and, for the trigger block HighRpm, logs/high_rpm_001.asc. During the measurement the status bar shows Logging with the number of events. The switch next to a block in the project explorer turns logging on or off; Start measurement without logging skips logging once.Démarrez puis arrêtez la mesure. Chaque bloc de journalisation actif écrit son fichier dans le dossier du projet, ici logs/Demo vehicle_1.blf et, pour le bloc déclenché HighRpm, logs/high_rpm_001.asc. Pendant la mesure, la barre d'état affiche Logging avec le nombre d'événements. L'interrupteur à côté d'un bloc dans l'explorateur de projet active ou désactive la journalisation ; Start measurement without logging l'ignore pour une seule mesure.
Klik in de Measurement Setup op het blok Measurement source. Rechts kies je de werkmodus: Real bus (de hardware van de netwerken), Simulated bus (alle netwerken gesimuleerd, virtuele tijd) of Offline (logbestanden afspelen). Daaronder staan de replay-blokken.In the measurement setup, click the Measurement source block. On the right, choose the working mode: Real bus (the networks' hardware), Simulated bus (all networks simulated, virtual time) or Offline (replay log files). The replay blocks are listed below.Dans le Measurement Setup, cliquez sur le bloc Measurement source. À droite, choisissez le mode de travail : Real bus (le matériel des réseaux), Simulated bus (tous les réseaux simulés, temps virtuel) ou Offline (relecture de fichiers journaux). Les blocs de rejeu figurent en dessous.
Kies Offline, klik op Add log file… en kies een of meer BLF-, ASC-, MF4- of PCAPNG-bestanden, hier de opname van stap 2.Choose Offline, click Add log file… and select one or more BLF, ASC, MF4 or PCAPNG files, here the recording from step 2.Choisissez Offline, cliquez sur Add log file… et sélectionnez un ou plusieurs fichiers BLF, ASC, MF4 ou PCAPNG, ici l'enregistrement de l'étape 2.
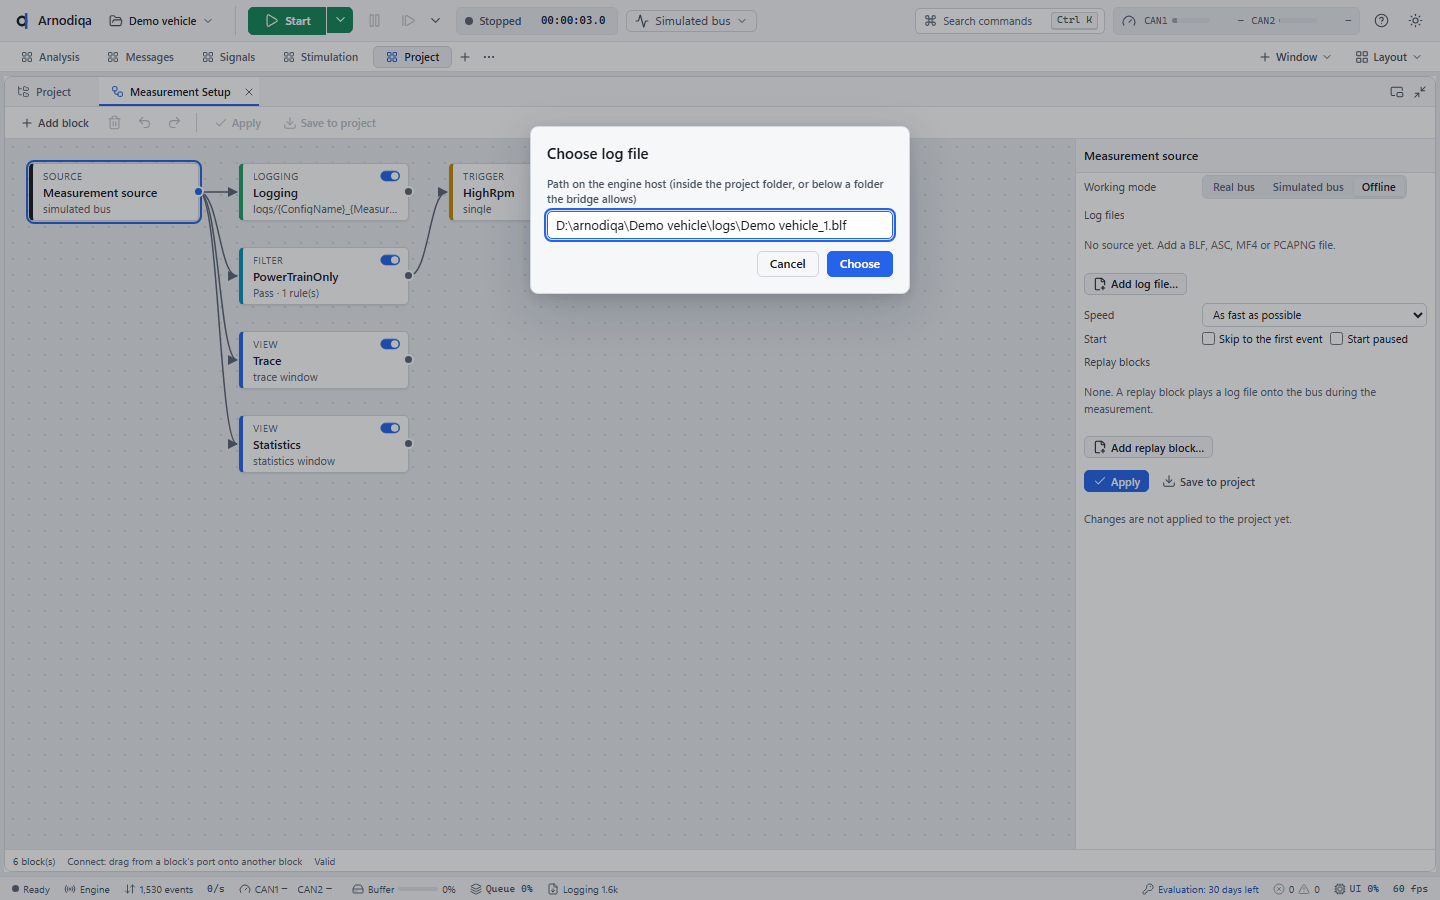
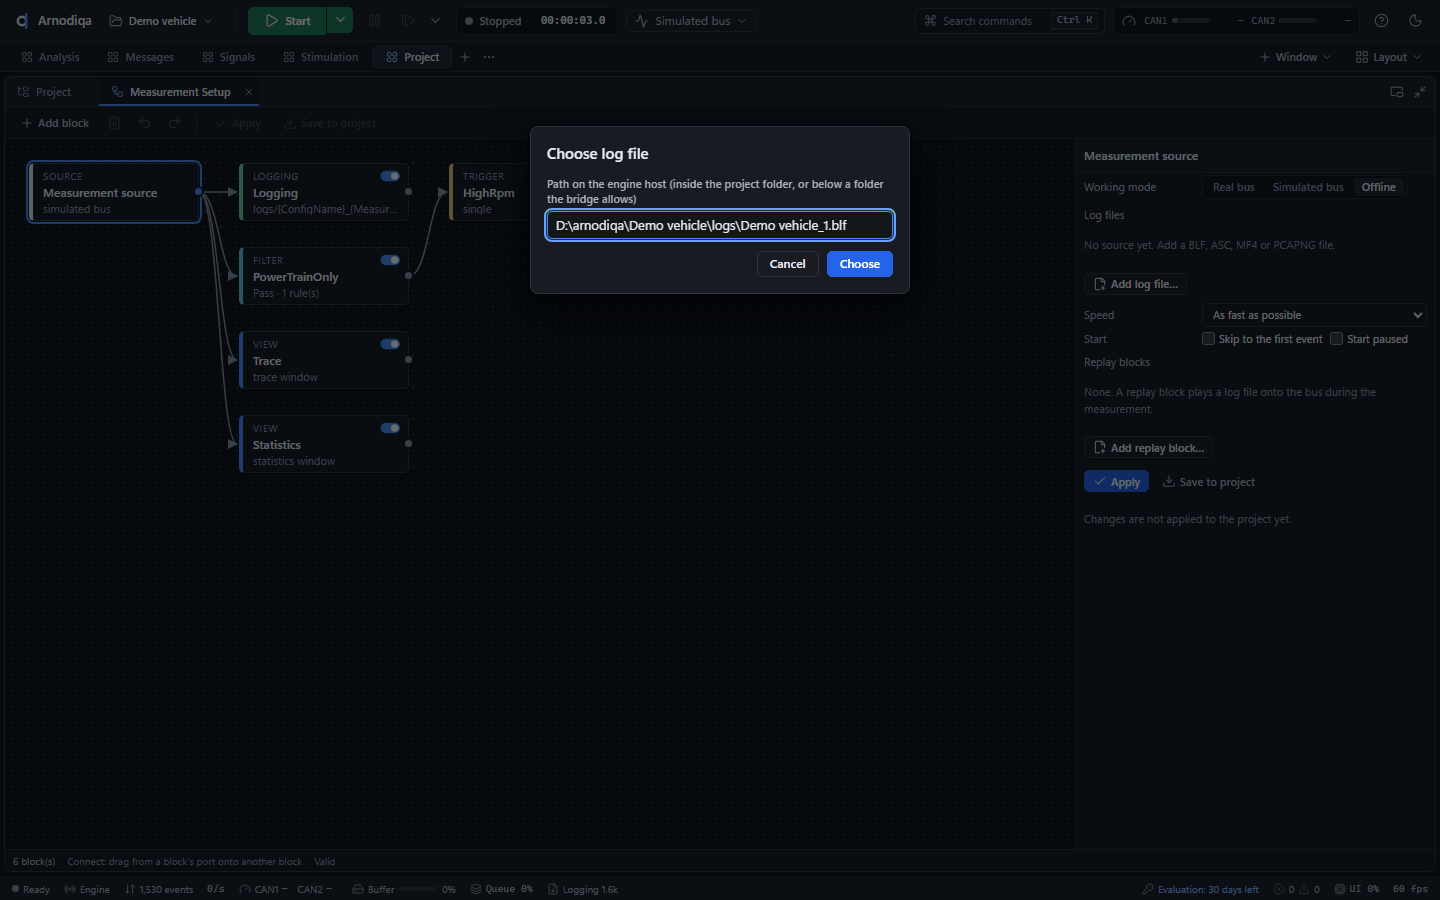
Het logbestand staat onder Log files; het vinkje zet een bron tijdelijk uit, de prullenbak haalt hem weg. Kies bij Speed As fast as possible, Real time (with factor) (2 = half zo snel) of Animate (één event per vertraging). Bij meerdere bestanden bepaalt Order hoe ze samengevoegd worden; Skip to the first event en Start paused staan onder Start.The log file is listed under Log files; the tick disables a source temporarily, the bin removes it. Under Speed, choose As fast as possible, Real time (with factor) (2 = half speed) or Animate (one event per delay). With several files, Order determines how they are merged; Skip to the first event and Start paused are under Start.Le fichier journal apparaît sous Log files ; la case à cocher désactive temporairement une source, la corbeille la retire. Sous Speed, choisissez As fast as possible, Real time (with factor) (2 = deux fois plus lent) ou Animate (un événement par intervalle). Avec plusieurs fichiers, Order détermine leur fusion ; Skip to the first event et Start paused se trouvent sous Start.
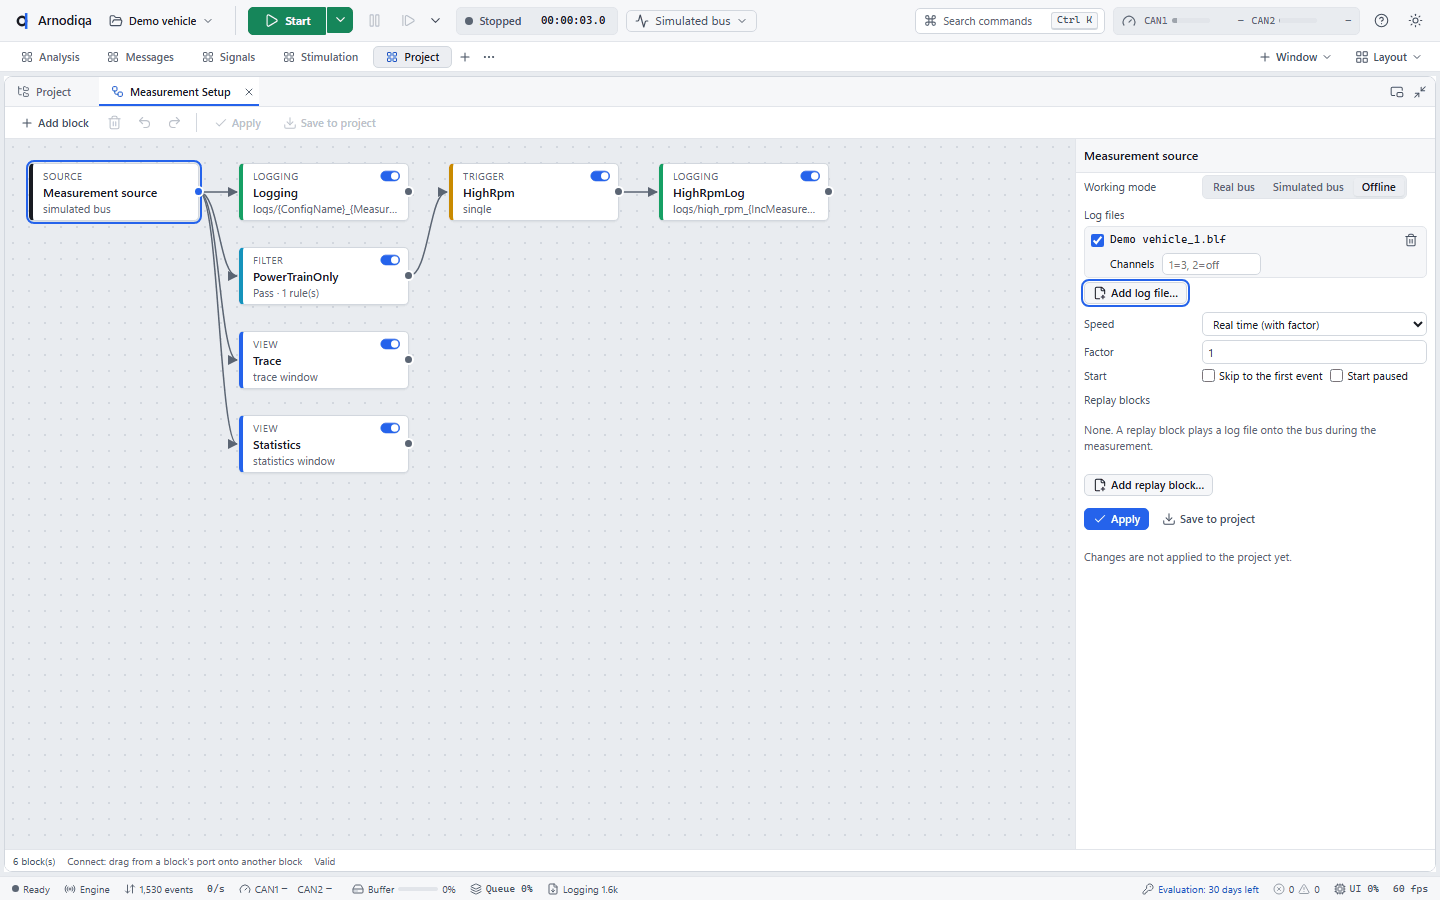
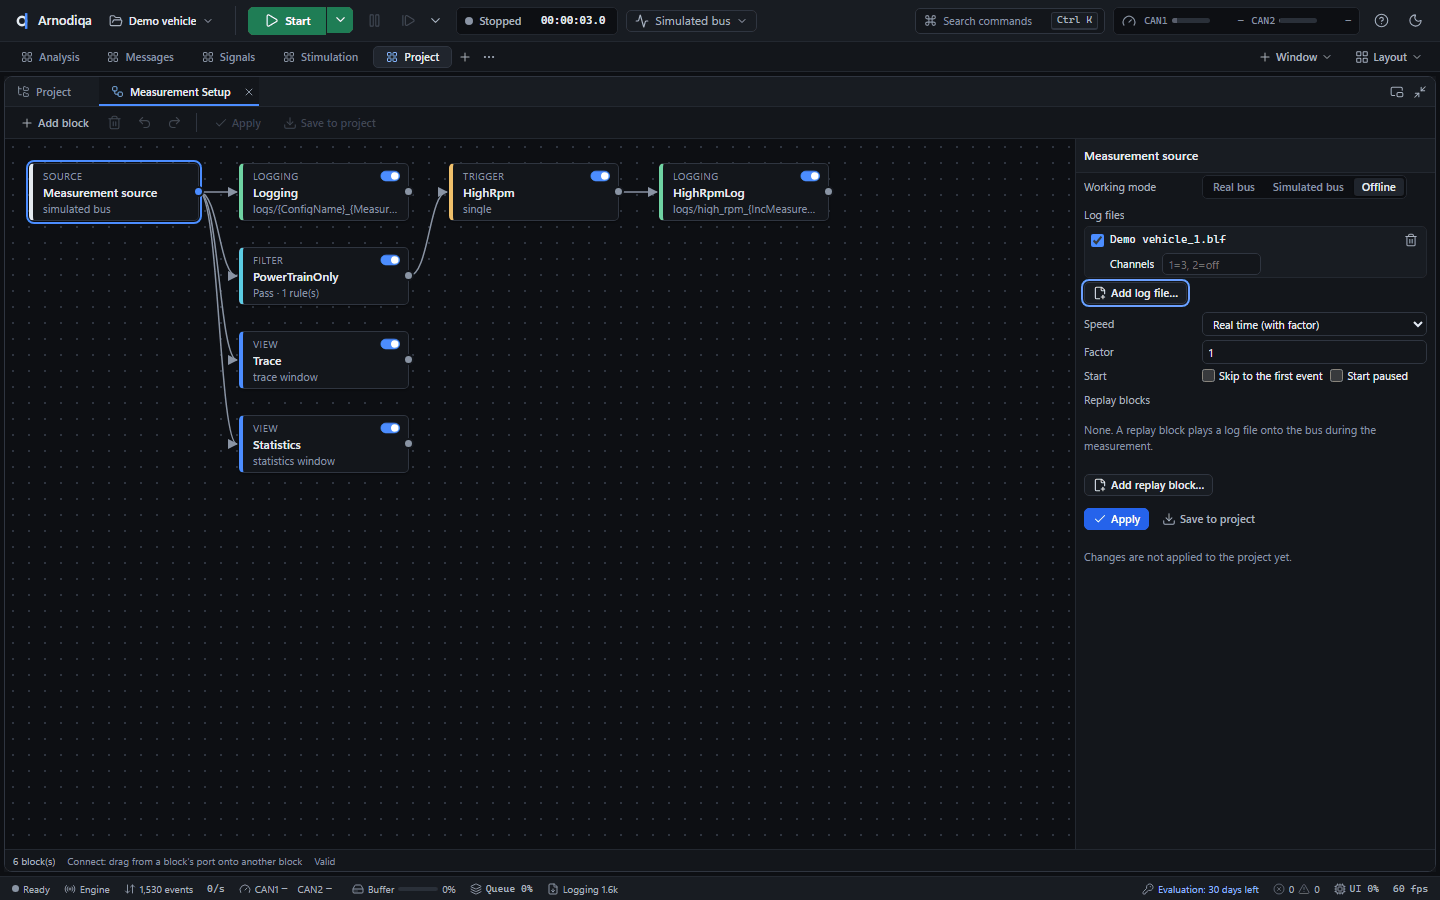
Klik op Save to project (Apply past de wijziging toe zonder op te slaan). De toolbar toont nu Offline en het bronblok offline · 1 file. Hetzelfde kan via Ctrl+K met Working mode: Offline (log files).Click Save to project (Apply applies the change without saving). The toolbar now shows Offline and the source block offline · 1 file. The same is available via Ctrl+K with Working mode: Offline (log files).Cliquez sur Save to project (Apply applique la modification sans l'enregistrer). La barre d'outils affiche maintenant Offline et le bloc source offline · 1 file. Le même réglage est accessible via Ctrl+K avec Working mode: Offline (log files).
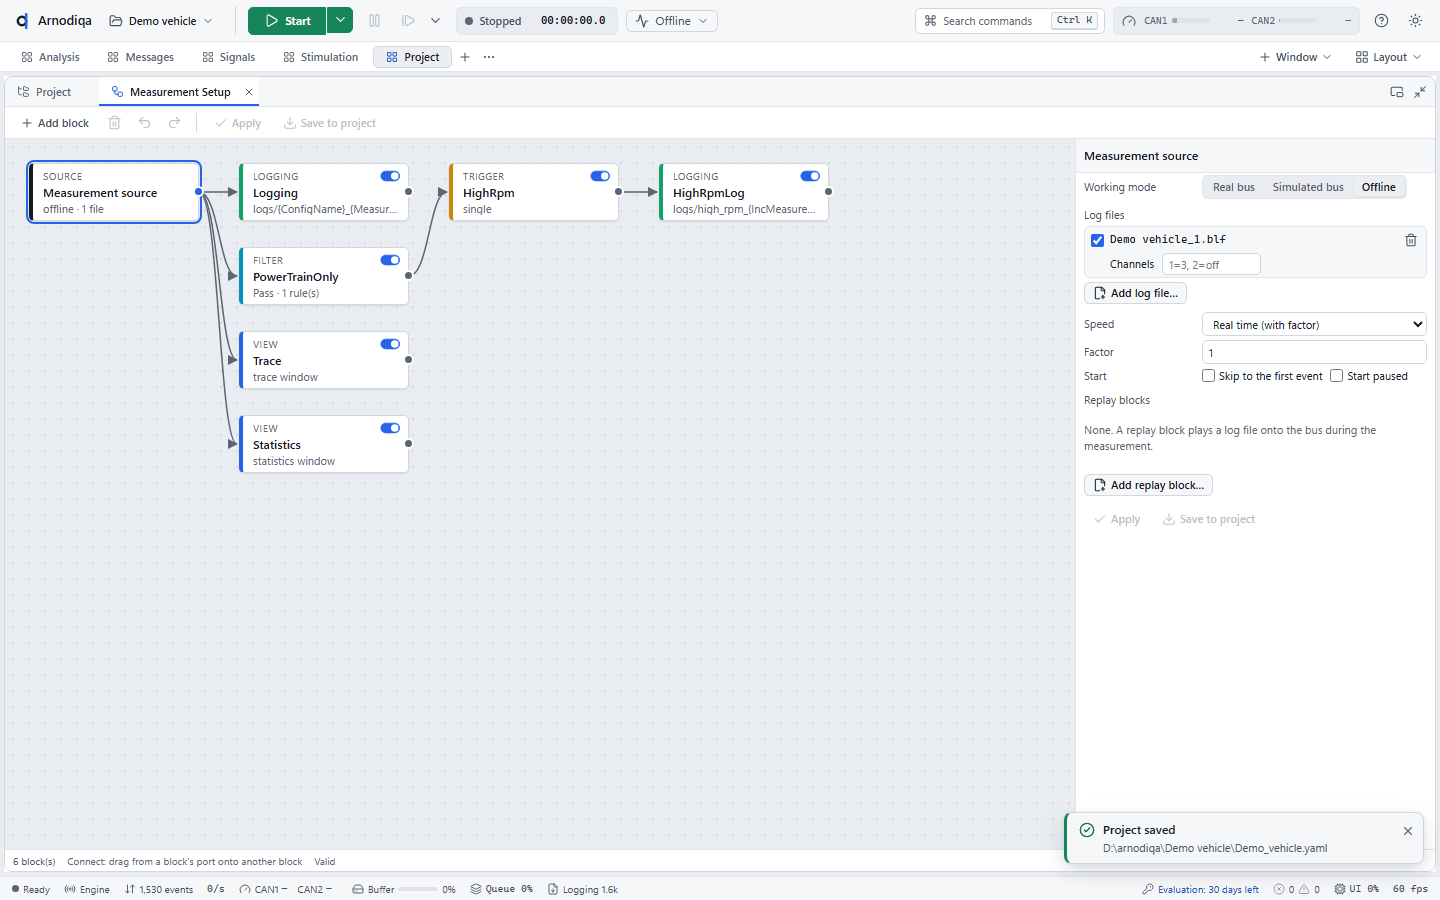
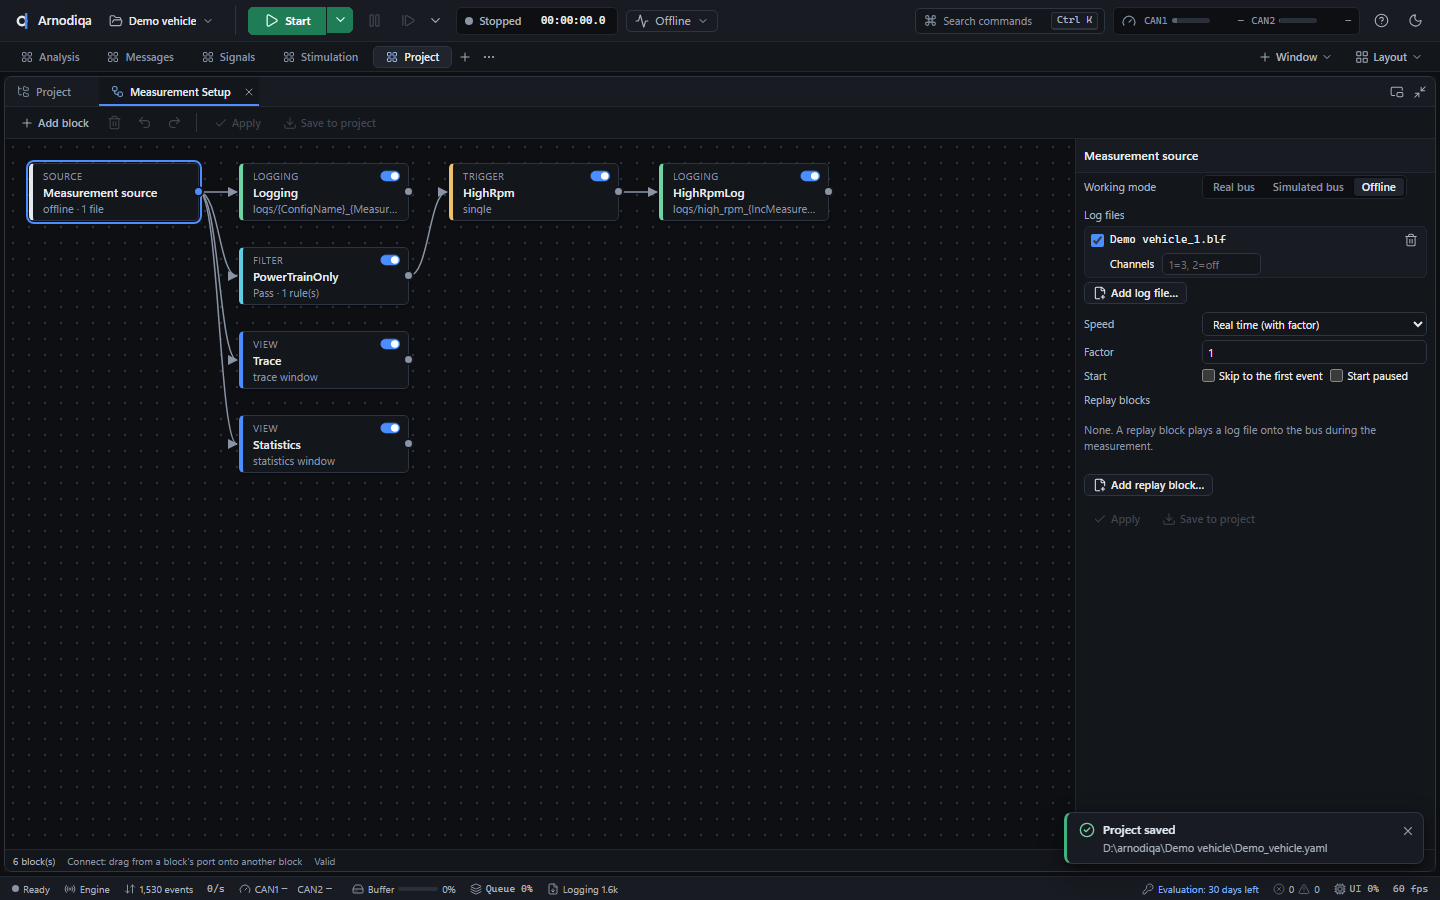
Klik op Start (F9): Arnodiqa speelt het logbestand af door dezelfde analyse als een live meting (Trace, Graphics, Statistics). Aan het einde van het bestand stopt de meting vanzelf; met Real time duurt dat zo lang als de opname.Click Start (F9): Arnodiqa replays the log file through the same analysis as a live measurement (Trace, Graphics, Statistics). At the end of the file the measurement stops automatically; with Real time this takes as long as the recording.Cliquez sur Start (F9) : Arnodiqa relit le fichier journal à travers la même analyse qu'une mesure en direct (Trace, Graphics, Statistics). À la fin du fichier, la mesure s'arrête d'elle-même ; en Real time, cela dure aussi longtemps que l'enregistrement.
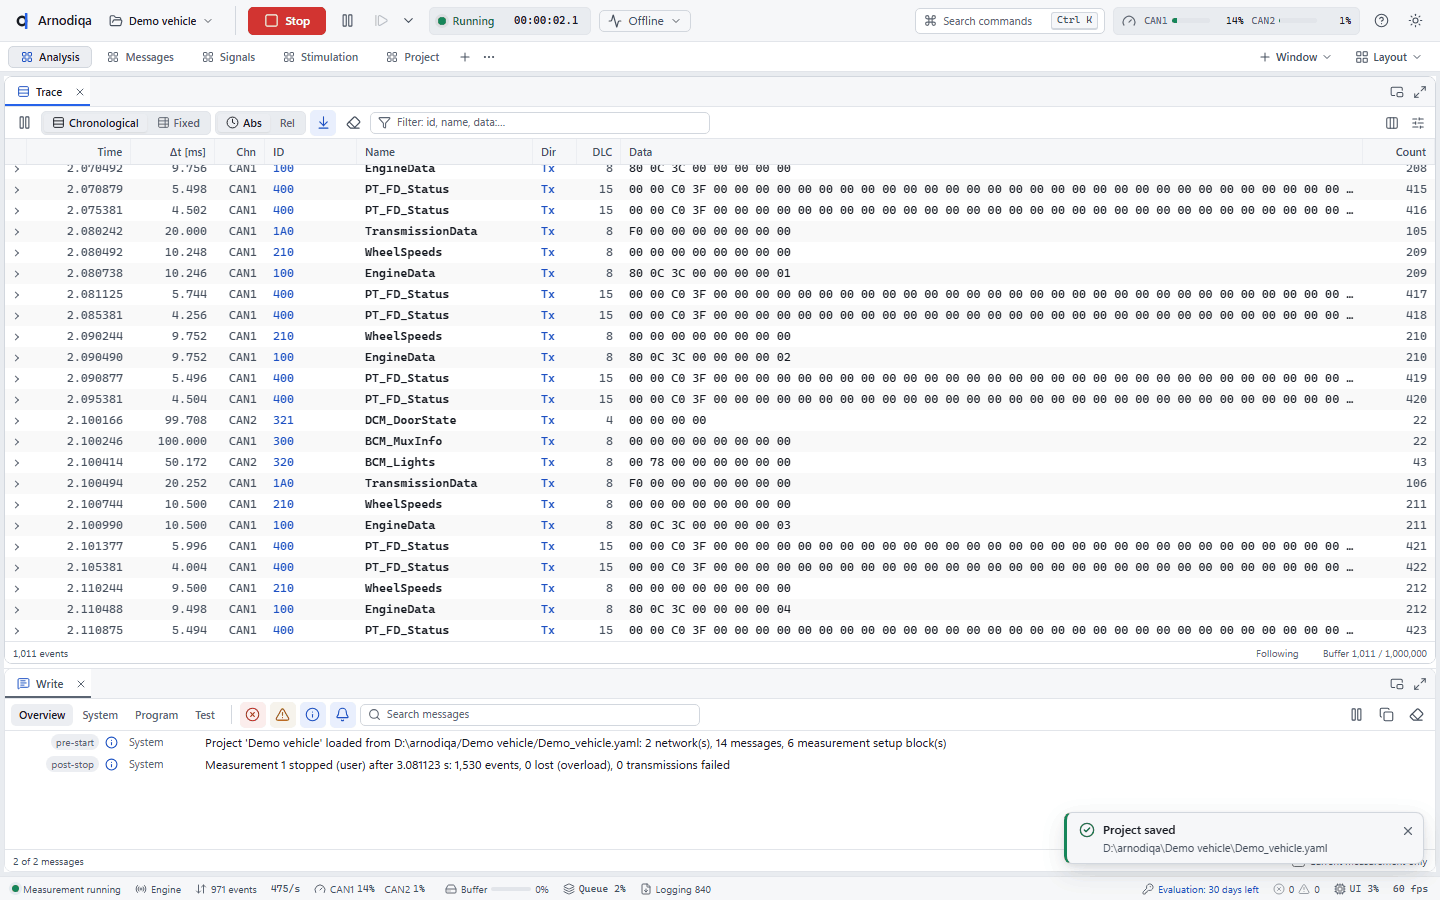
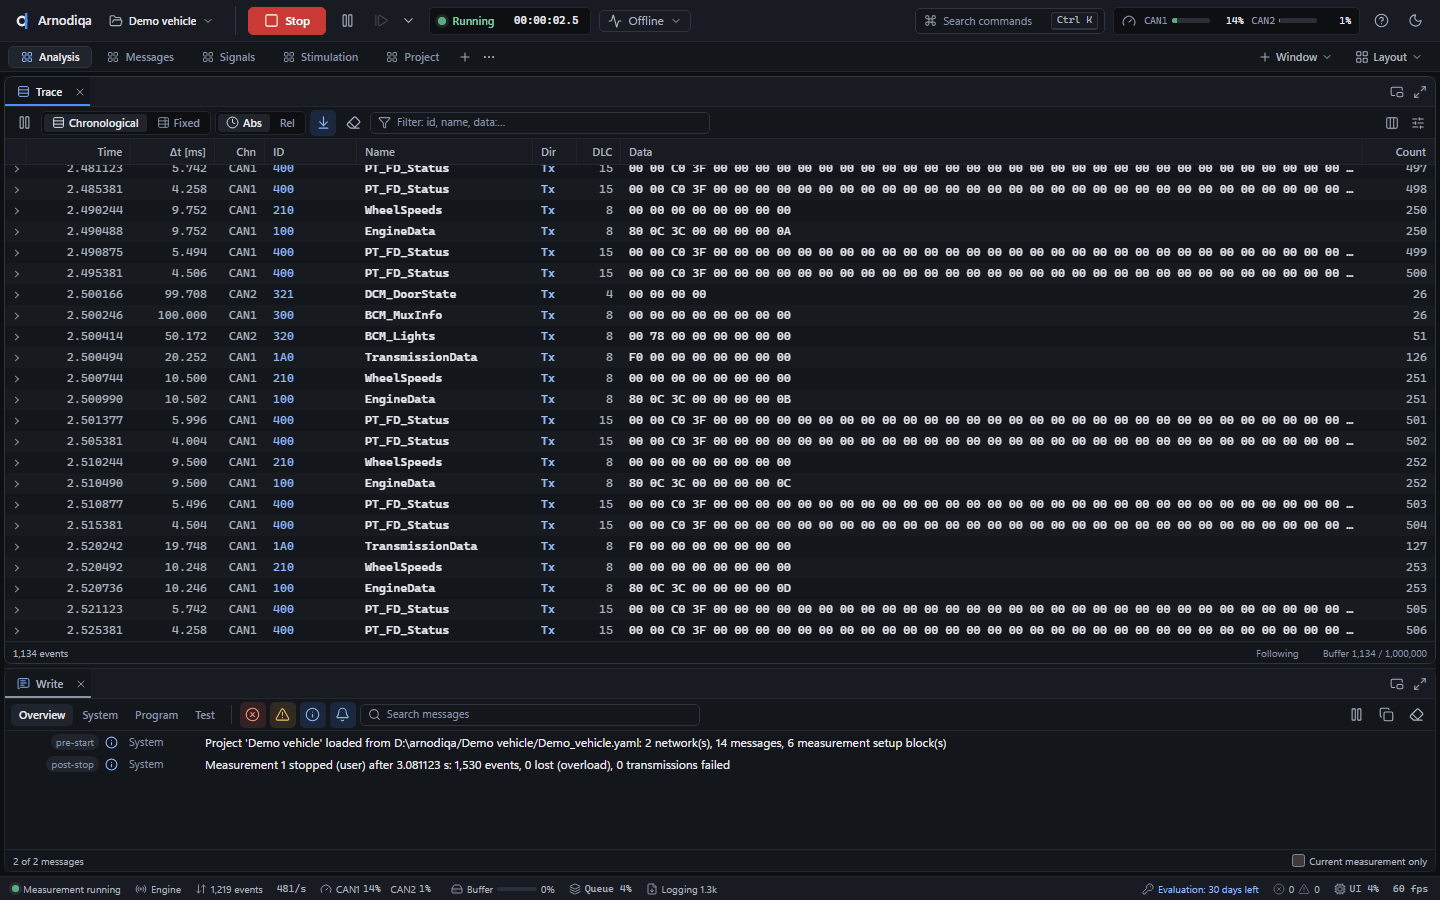
Een opname terug op de bus zetten tijdens een online meting: kies Simulated bus of Real bus en klik bij Replay blocks op Add replay block…. Per blok kies je de naam, Start at once, Original times of Delayed, en Loop. Bij de volgende start zendt het blok de frames van het bestand. In de offline-modus zijn replay-blokken inactief.To put a recording back on the bus during an online measurement, choose Simulated bus or Real bus and click Add replay block… under Replay blocks. For each block, choose the name, Start at once, Original times or Delayed, and Loop. At the next start the block sends the frames from the file. In offline mode, replay blocks are inactive.Pour renvoyer un enregistrement sur le bus pendant une mesure en ligne, choisissez Simulated bus ou Real bus et cliquez sur Add replay block… sous Replay blocks. Pour chaque bloc, choisissez le nom, Start at once, Original times ou Delayed, et Loop. Au démarrage suivant, le bloc envoie les trames du fichier. En mode hors ligne, les blocs de rejeu sont inactifs.
Diagnose: UDS-console en foutgeheugenDiagnostics: UDS console and fault memoryDiagnostic : console UDS et mémoire de défauts
Diagnostic Console en Fault Memory werken met de diagnostische ECU's van het project, gesimuleerd of echt.Diagnostic Console and Fault Memory work with the project's diagnostic ECUs, simulated or real.Diagnostic Console et Fault Memory travaillent avec les calculateurs de diagnostic du projet, simulés ou réels.
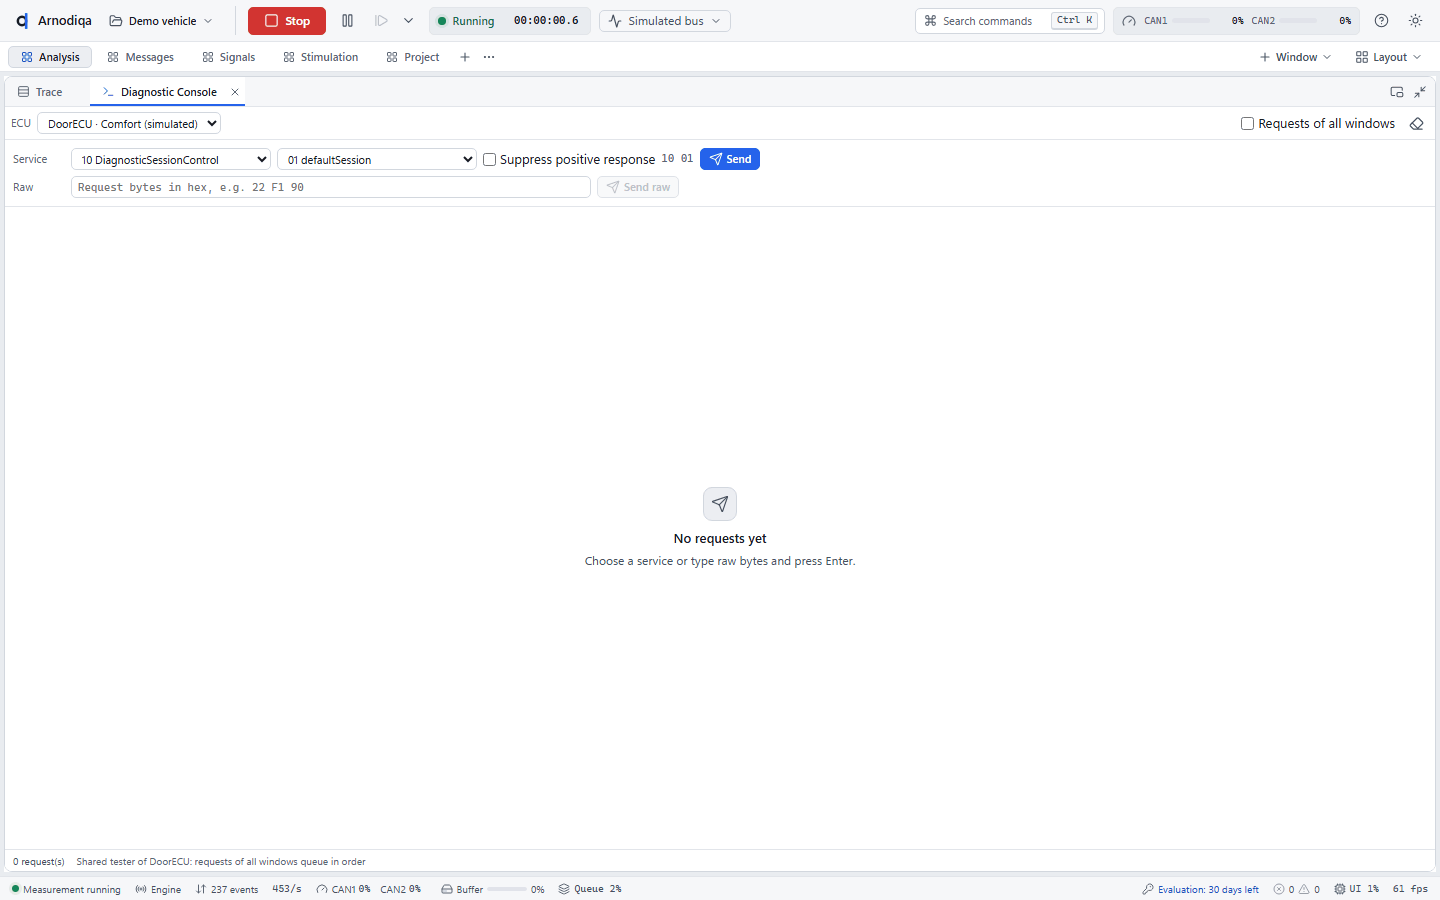
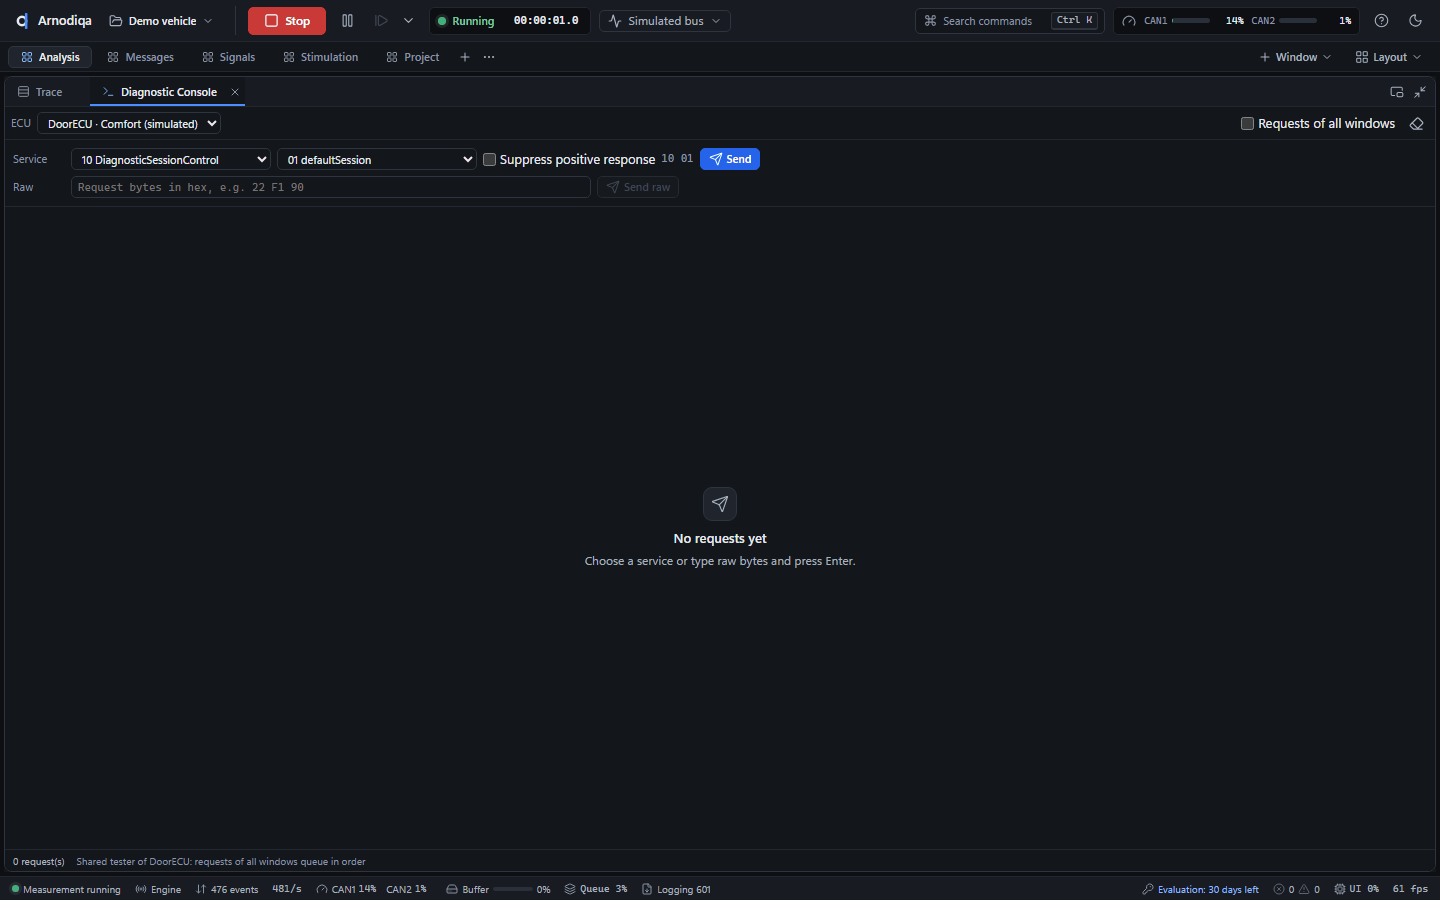
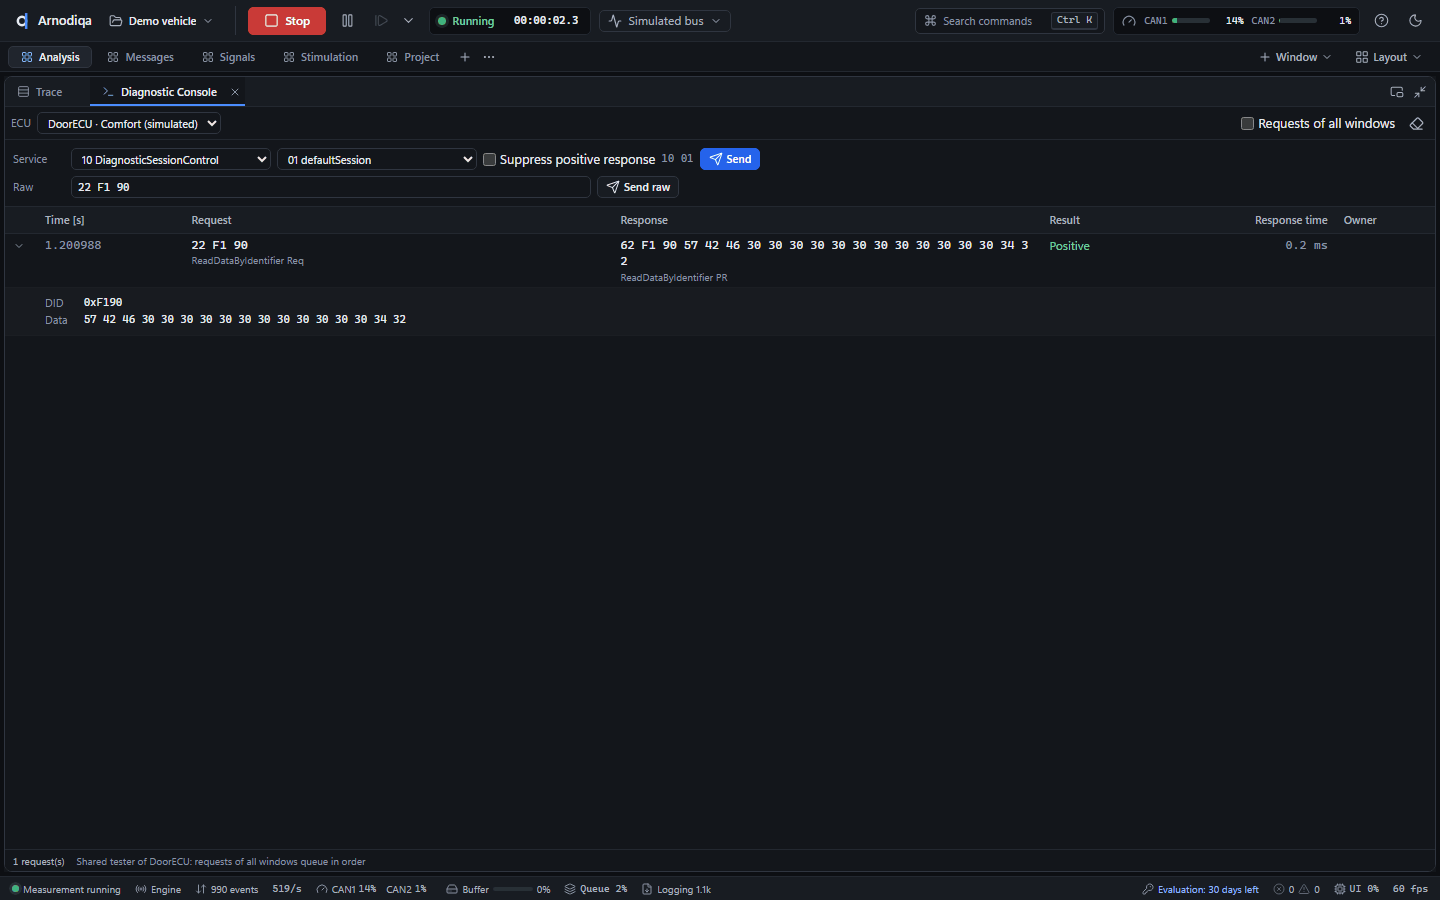
Open de Diagnostic Console met Ctrl+K en New Diagnostic Console window en start de meting. Kies bij ECU de ECU (hier DoorECU). Kies bij Service een dienst en subfunctie en klik op Send, of typ bij Raw een request in hex.Open the Diagnostic Console with Ctrl+K and New Diagnostic Console window and start the measurement. Select the ECU under ECU (here DoorECU). Choose a service and subfunction under Service and click Send, or type a request in hex under Raw.Ouvrez la Diagnostic Console avec Ctrl+K et New Diagnostic Console window, puis démarrez la mesure. Sélectionnez le calculateur sous ECU (ici DoorECU). Choisissez un service et une sous-fonction sous Service et cliquez sur Send, ou saisissez une requête en hexadécimal sous Raw.
Typ bij Raw bijvoorbeeld
22 F1 90(ReadDataByIdentifier, VIN) en druk op Enter of klik op Send raw. De historie toont request, response, resultaat en responstijd; klik op een regel voor de gedecodeerde parameters. Een negatieve response toont de NRC met naam.Type for example22 F1 90(ReadDataByIdentifier, VIN) under Raw and press Enter or click Send raw. The history shows request, response, result and response time; click a row for the decoded parameters. A negative response shows the NRC with its name.Saisissez par exemple22 F1 90(ReadDataByIdentifier, VIN) sous Raw et appuyez sur Entrée ou cliquez sur Send raw. L'historique affiche la requête, la réponse, le résultat et le temps de réponse ; cliquez sur une ligne pour voir les paramètres décodés. Une réponse négative affiche le NRC avec son nom.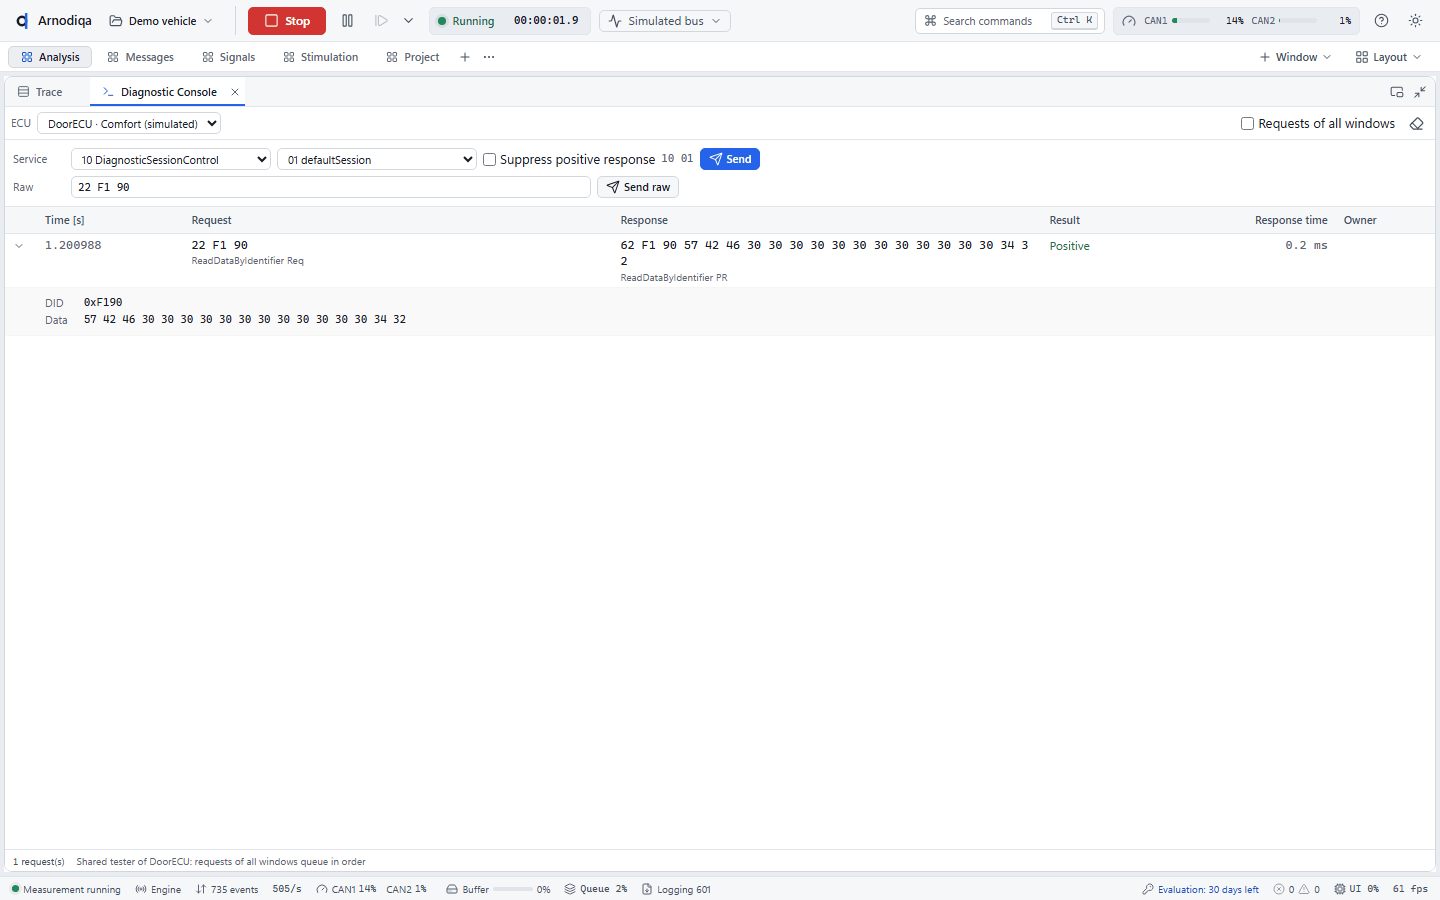
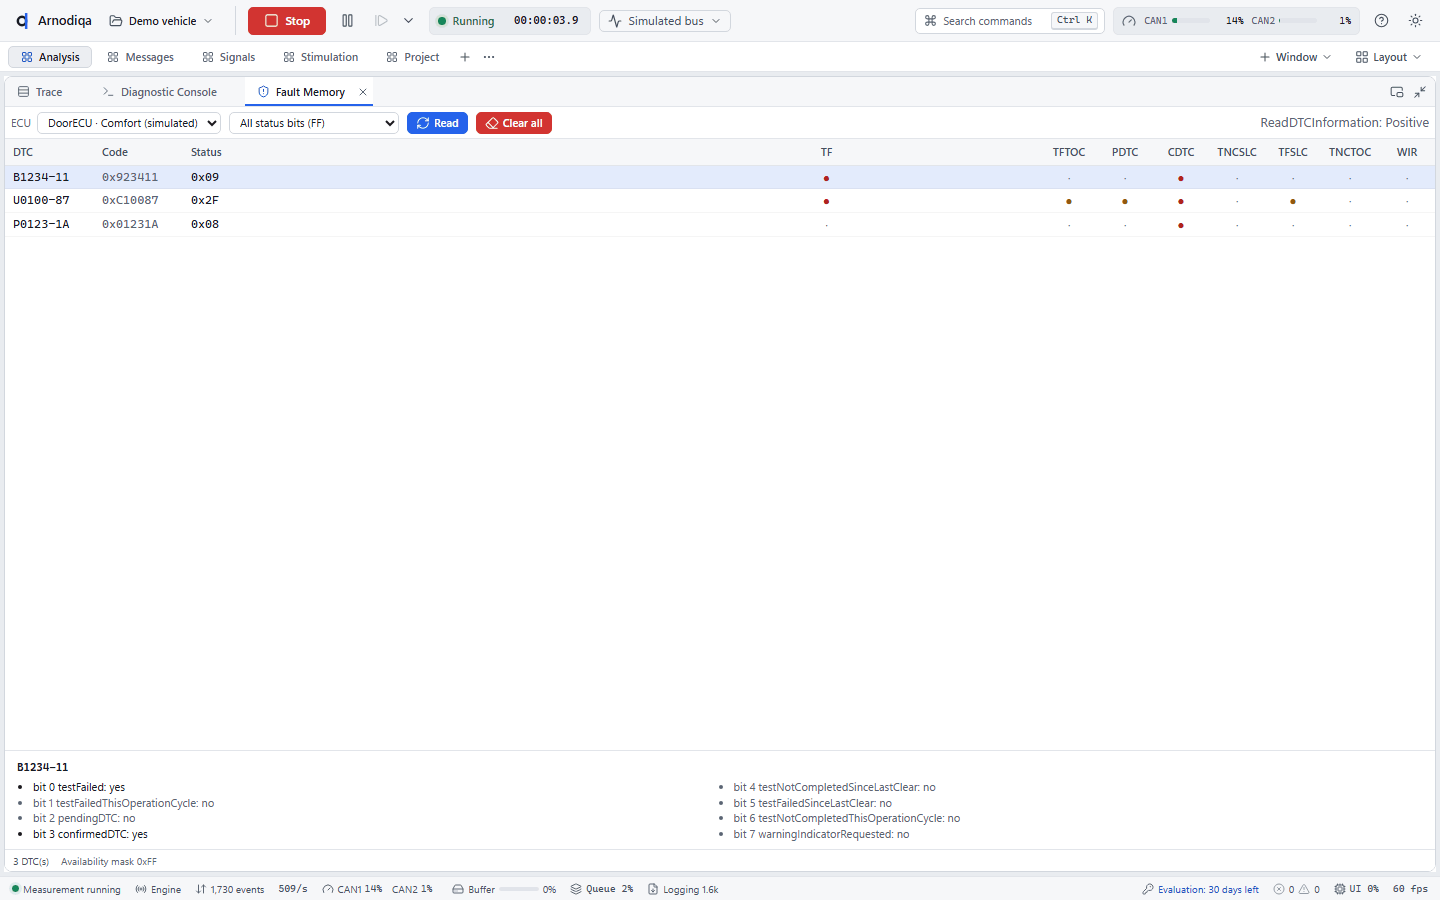
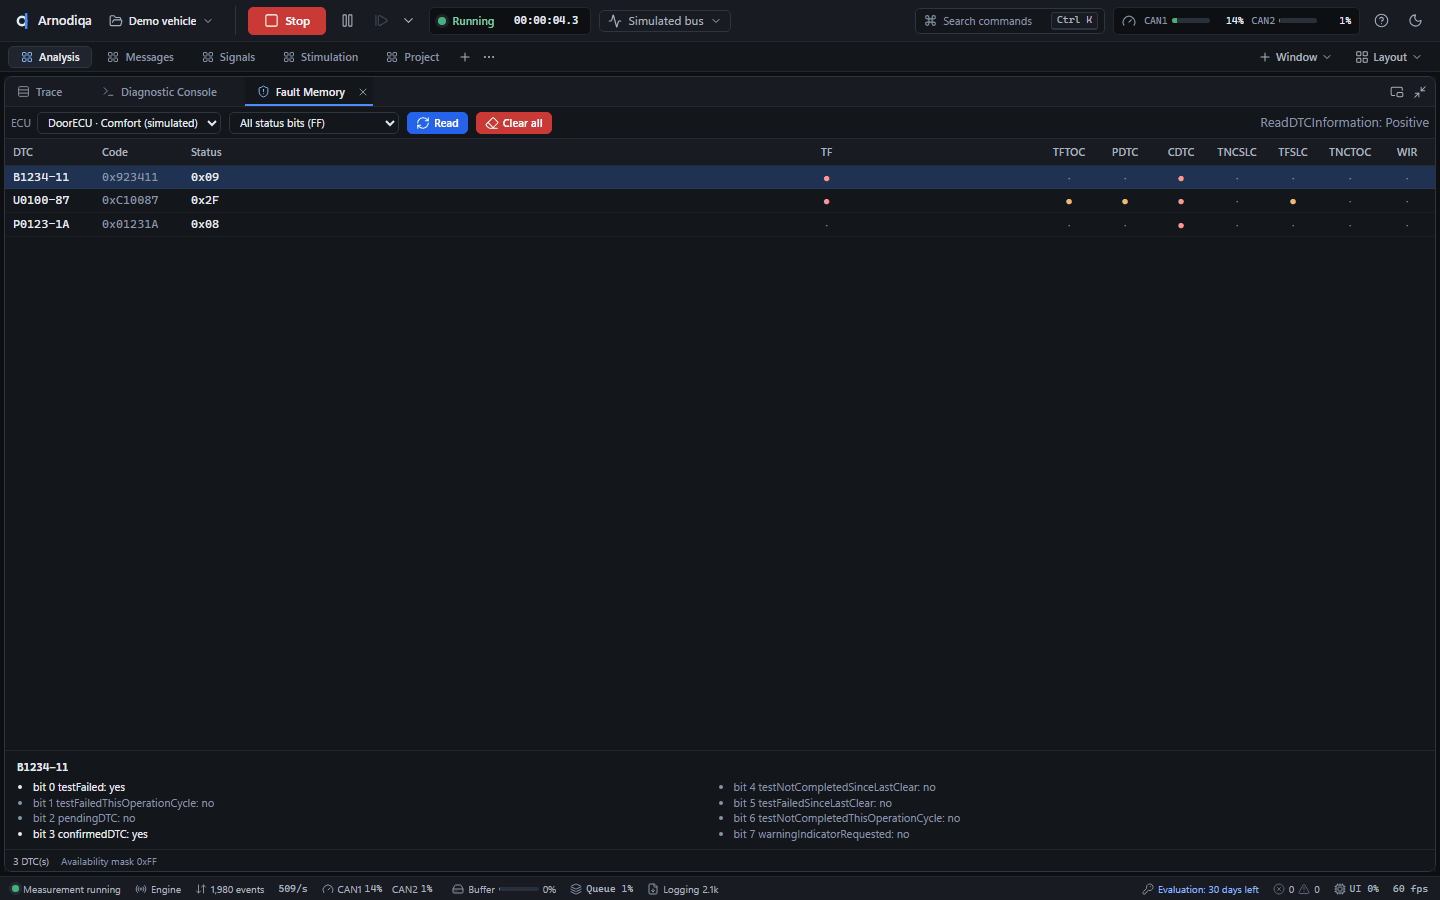
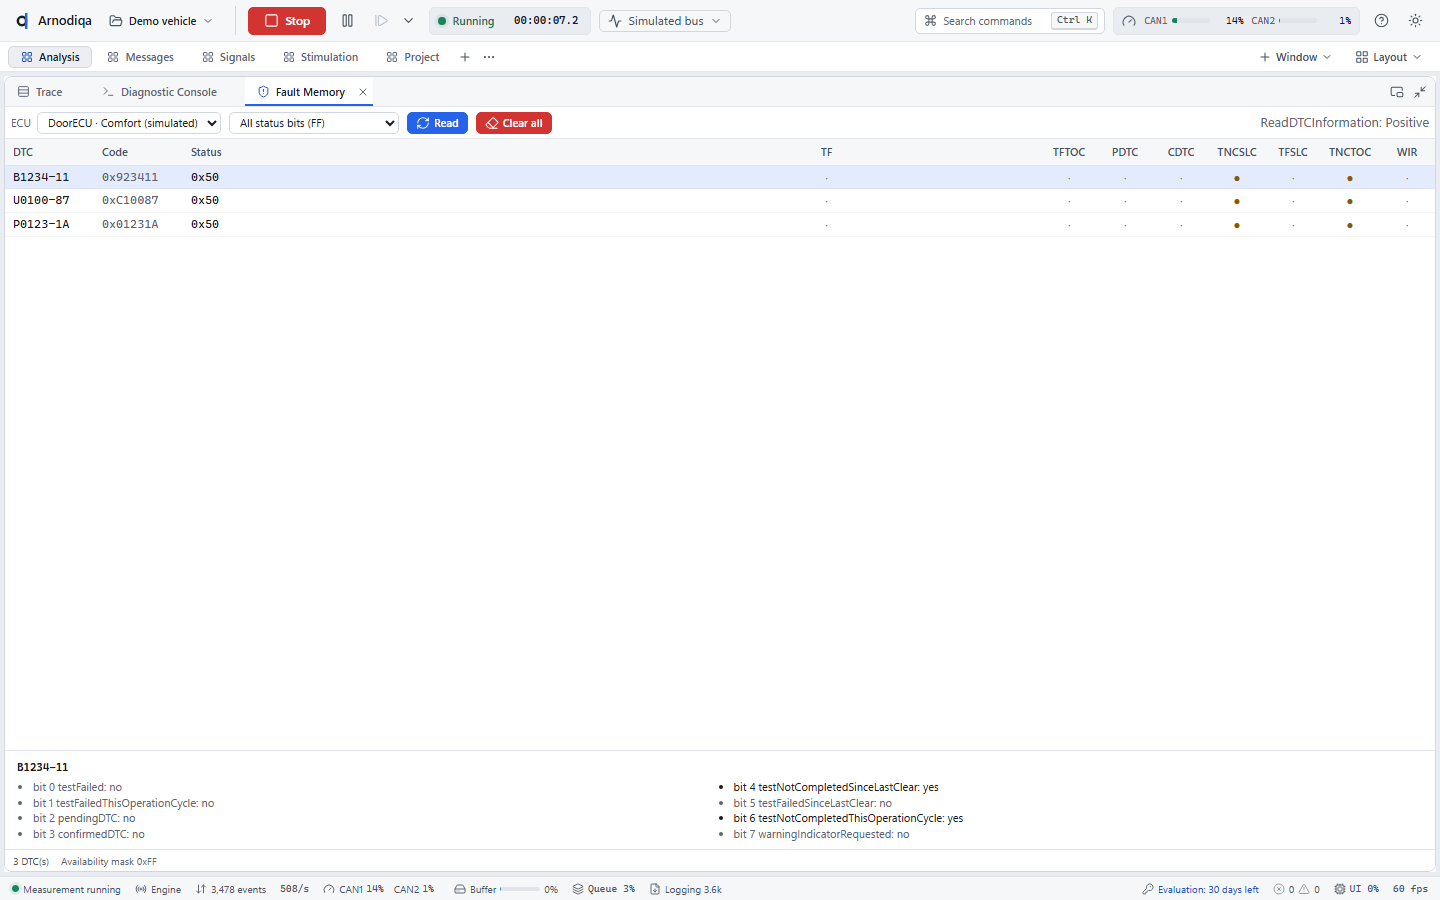
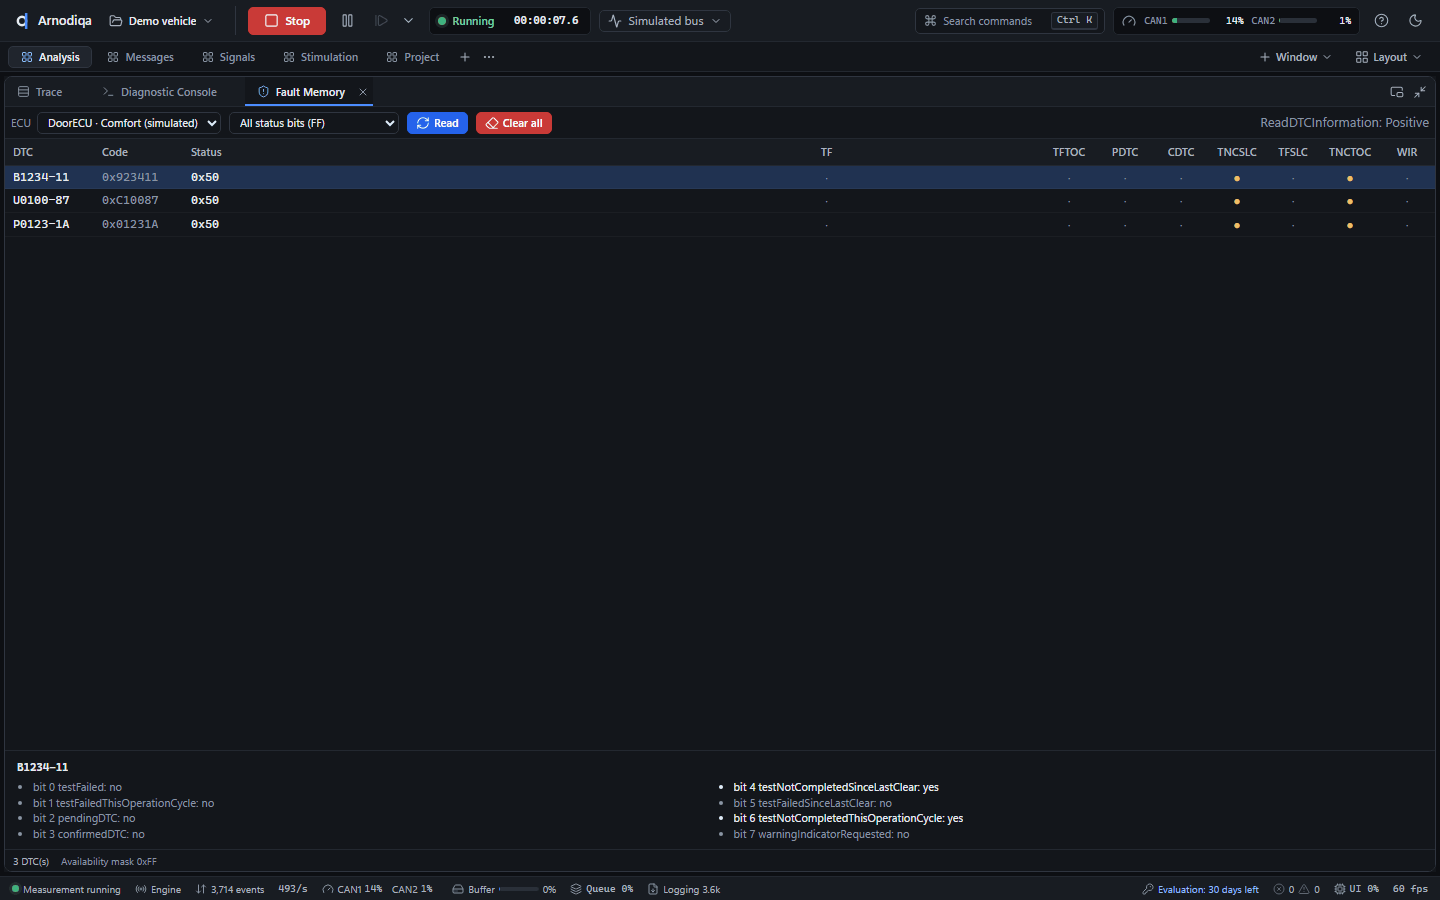
Open Fault Memory (Ctrl+K, New Fault Memory window) en klik op Read (dienst 19 02 met het statusmasker uit de keuzelijst, standaard All status bits (FF)). Per DTC zie je SAE-code, code, status en de statusbits als kolommen; onderaan de acht bits van de geselecteerde DTC uitgeschreven.Open Fault Memory (Ctrl+K, New Fault Memory window) and click Read (service 19 02 with the status mask from the list, default All status bits (FF)). For each DTC you see the SAE code, code, status and the status bits as columns; at the bottom the eight bits of the selected DTC are written out.Ouvrez Fault Memory (Ctrl+K, New Fault Memory window) et cliquez sur Read (service 19 02 avec le masque d'état choisi dans la liste, par défaut All status bits (FF)). Pour chaque DTC, vous voyez le code SAE, le code, l'état et les bits d'état en colonnes ; en bas, les huit bits du DTC sélectionné sont détaillés.
Clear all wist het foutgeheugen (ClearDiagnosticInformation, 14 FF FF FF); bevestig met Clear.Clear all clears the fault memory (ClearDiagnosticInformation, 14 FF FF FF); confirm with Clear.Clear all efface la mémoire de défauts (ClearDiagnosticInformation, 14 FF FF FF) ; confirmez avec Clear.
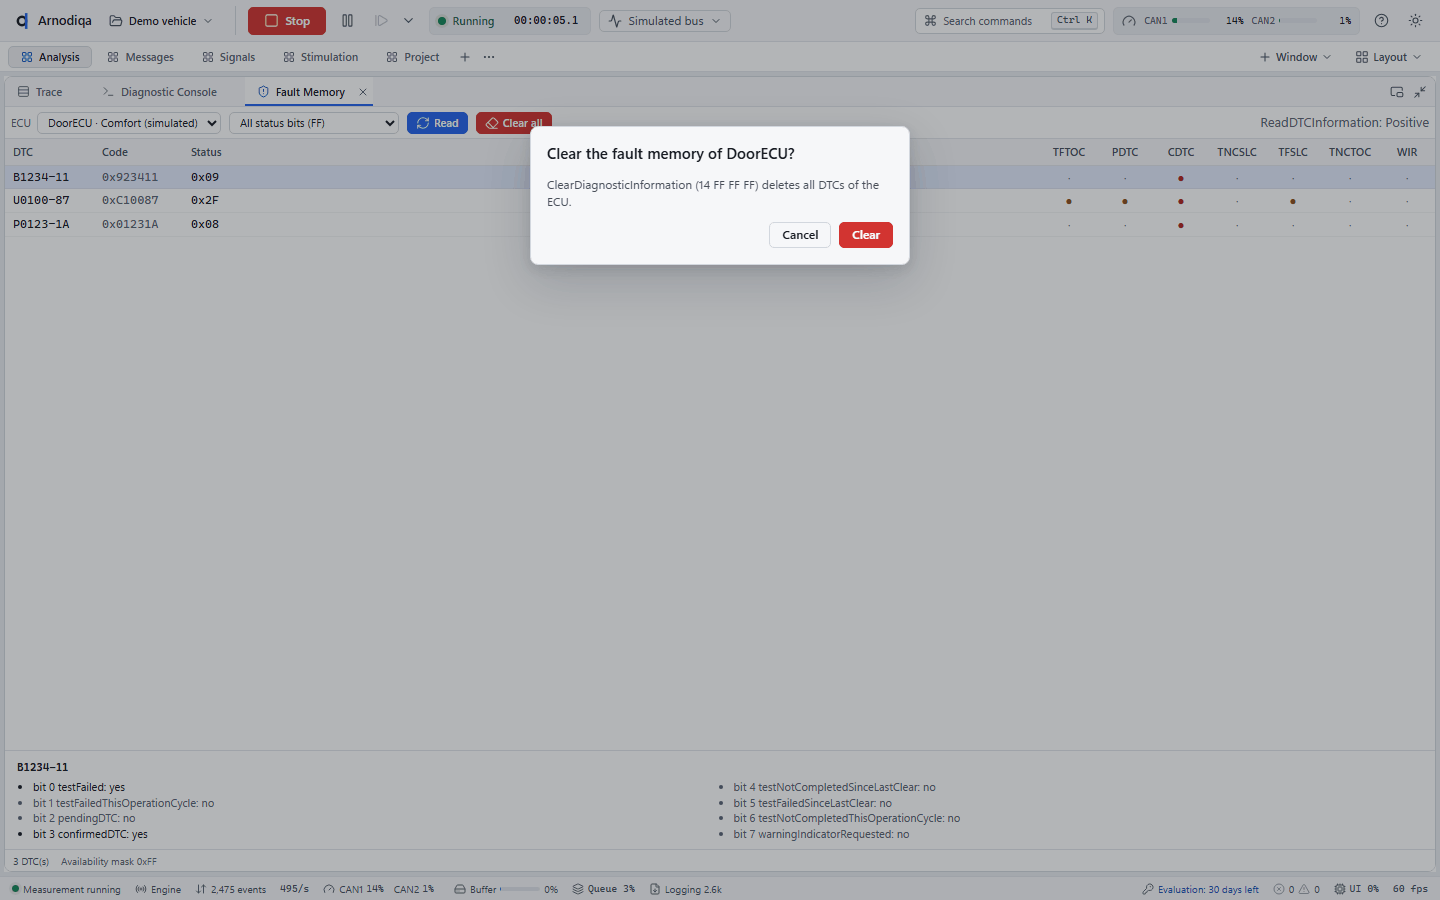
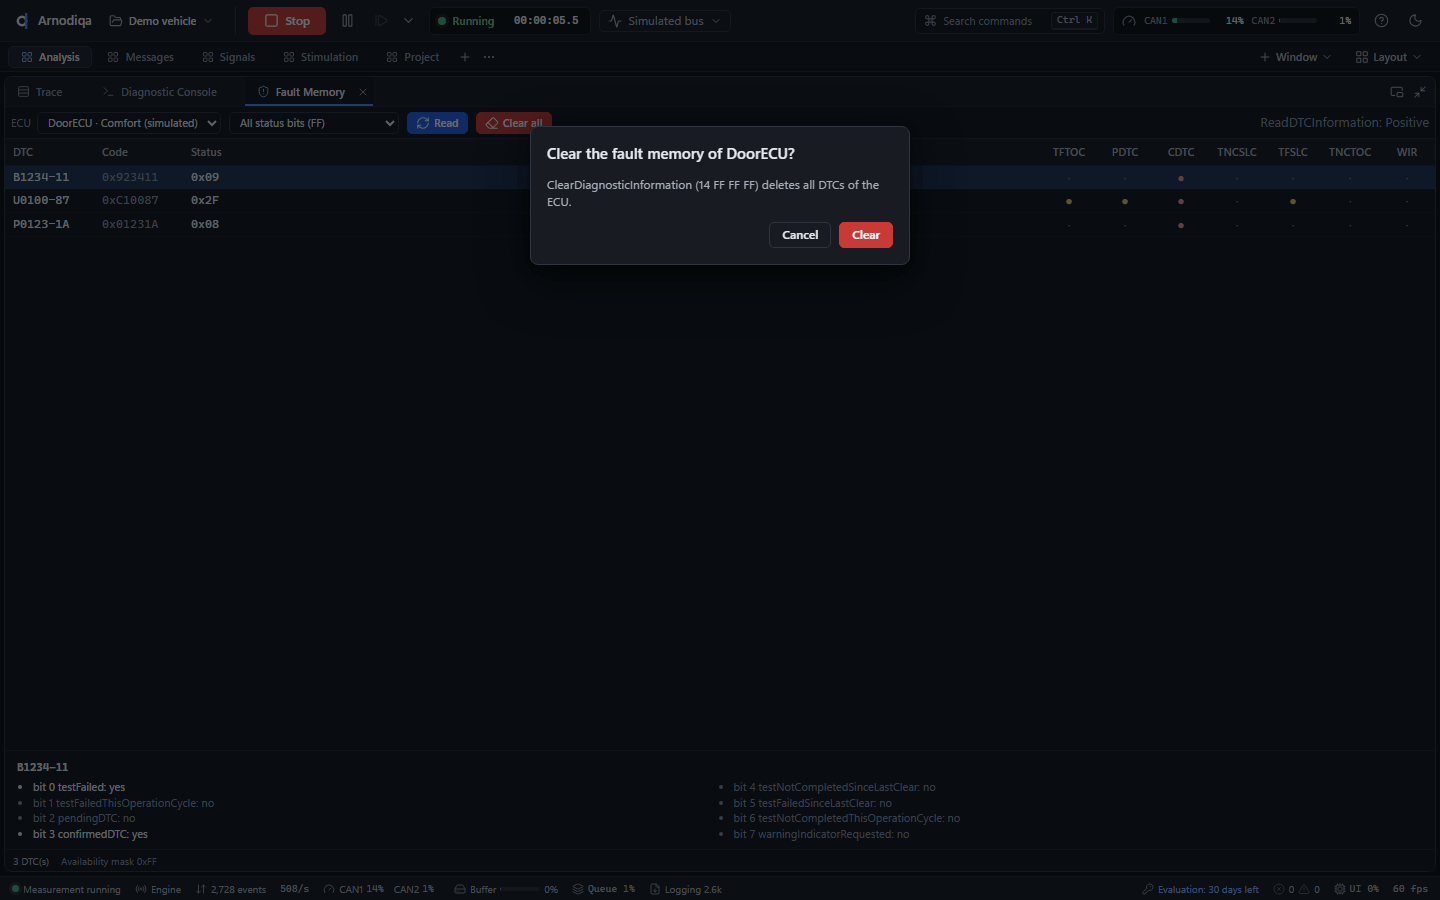
Na het wissen leest Read de DTC's opnieuw: hun status is teruggezet.After clearing, Read reads the DTCs again: their status has been reset.Après l'effacement, Read relit les DTC : leur état a été réinitialisé.
Een ECU flashenFlash an ECUFlasher un calculateur (ECU)
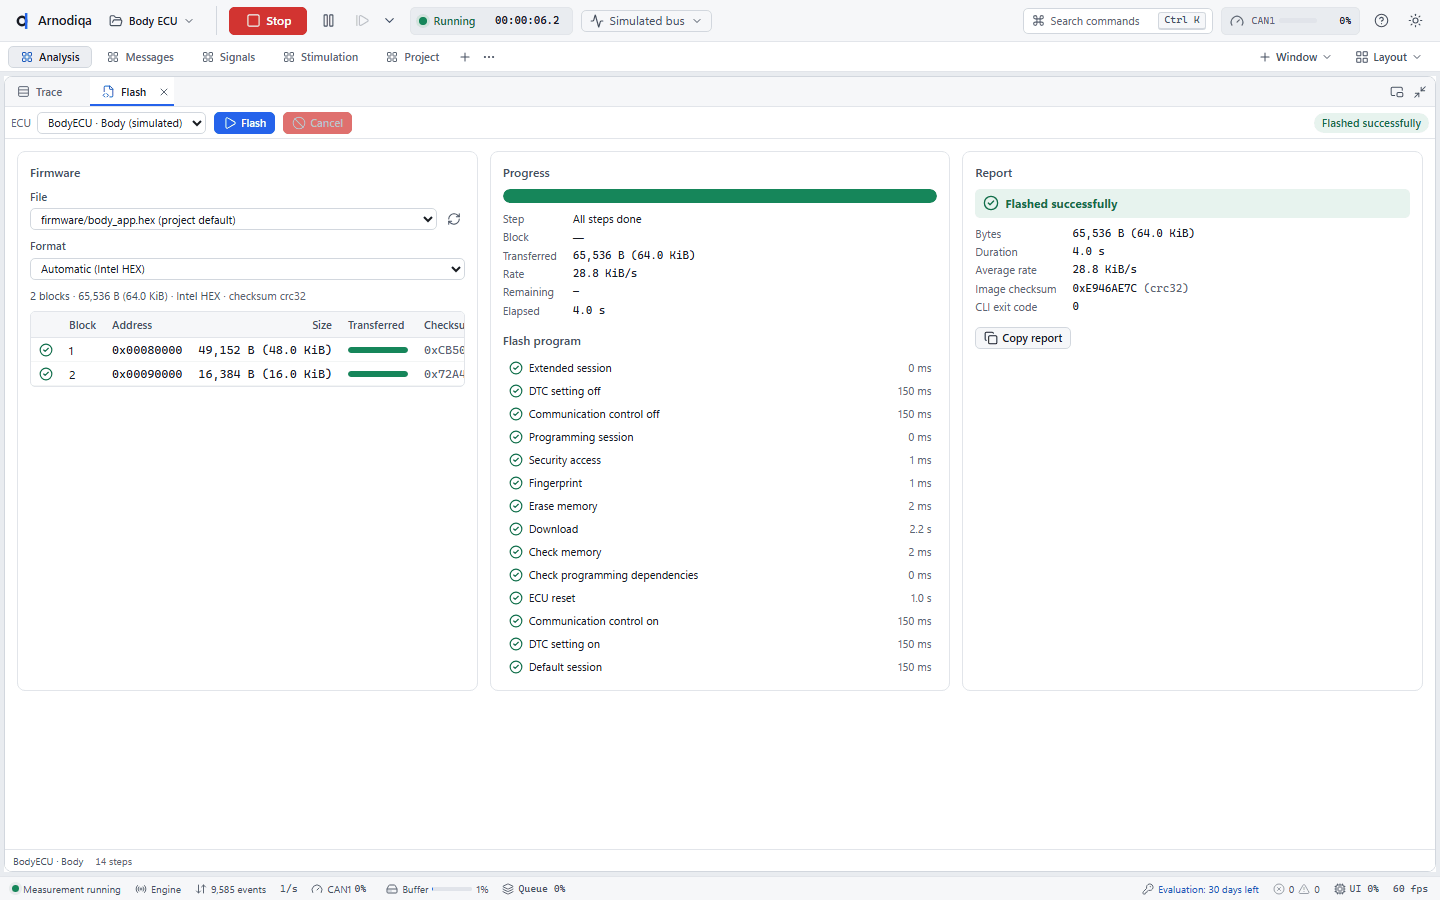
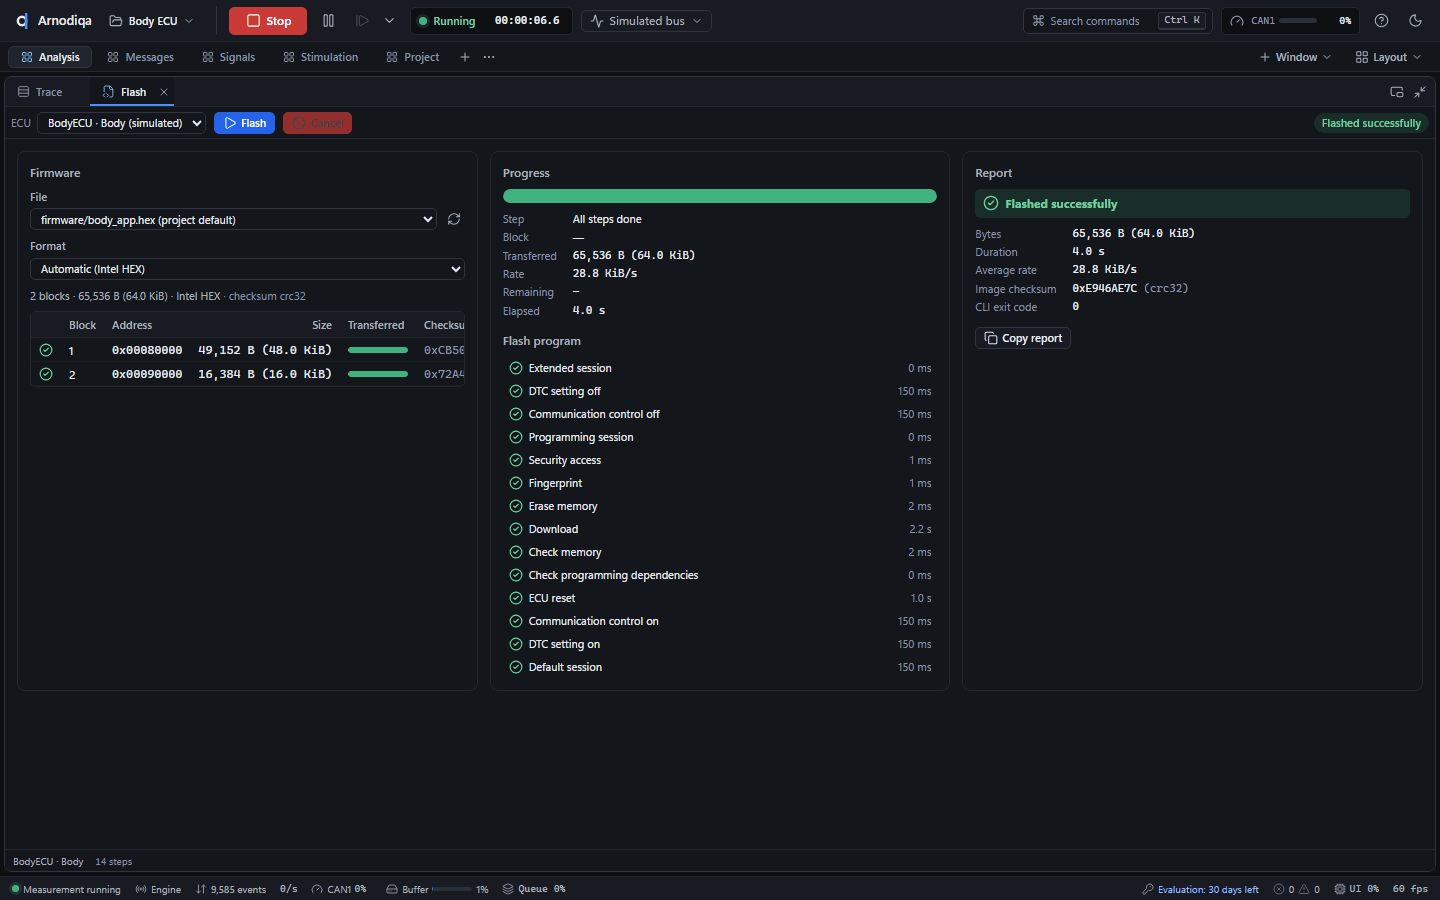
Het Flash-venster voert het flashprogramma van een ECU uit, met voortgang per stap en per blok.The Flash window runs an ECU's flash program, with progress per step and per block.La fenêtre Flash exécute le programme de flashage d'un calculateur, avec la progression par étape et par bloc.
Open het Flash-venster (Ctrl+K, New Flash window) en start de meting. Kies de ECU, het firmwarebestand (standaard dat uit het project, of via Browse…) en het formaat. Het venster toont vooraf de blokken van het bestand.Open the Flash window (Ctrl+K, New Flash window) and start the measurement. Choose the ECU, the firmware file (by default the one from the project, or via Browse…) and the format. The window shows the blocks of the file in advance.Ouvrez la fenêtre Flash (Ctrl+K, New Flash window) et démarrez la mesure. Choisissez le calculateur, le fichier de firmware (par défaut celui du projet, ou via Browse…) et le format. La fenêtre affiche d'avance les blocs du fichier.
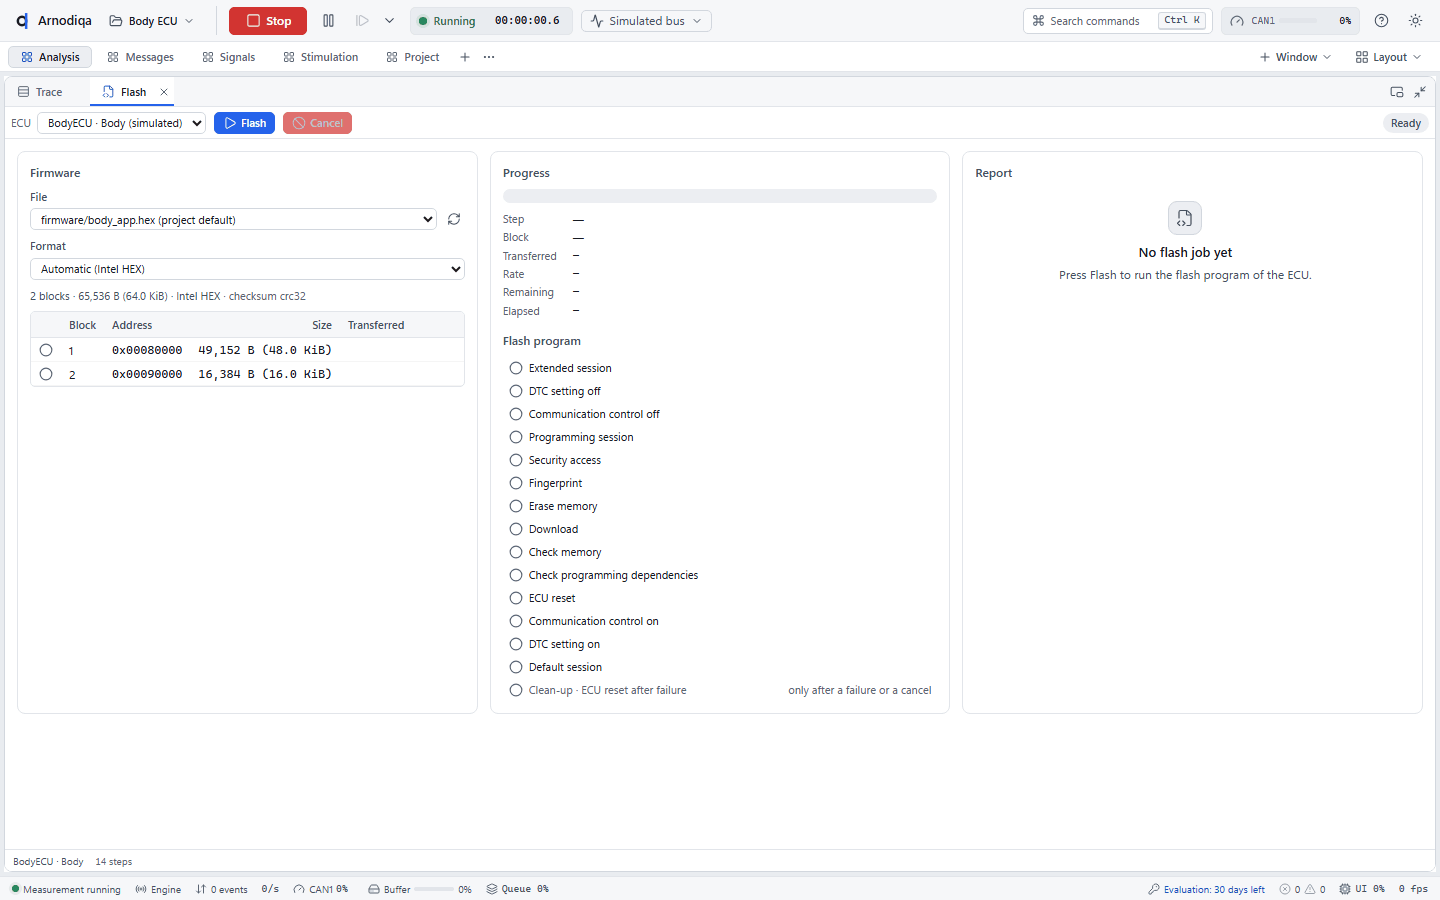
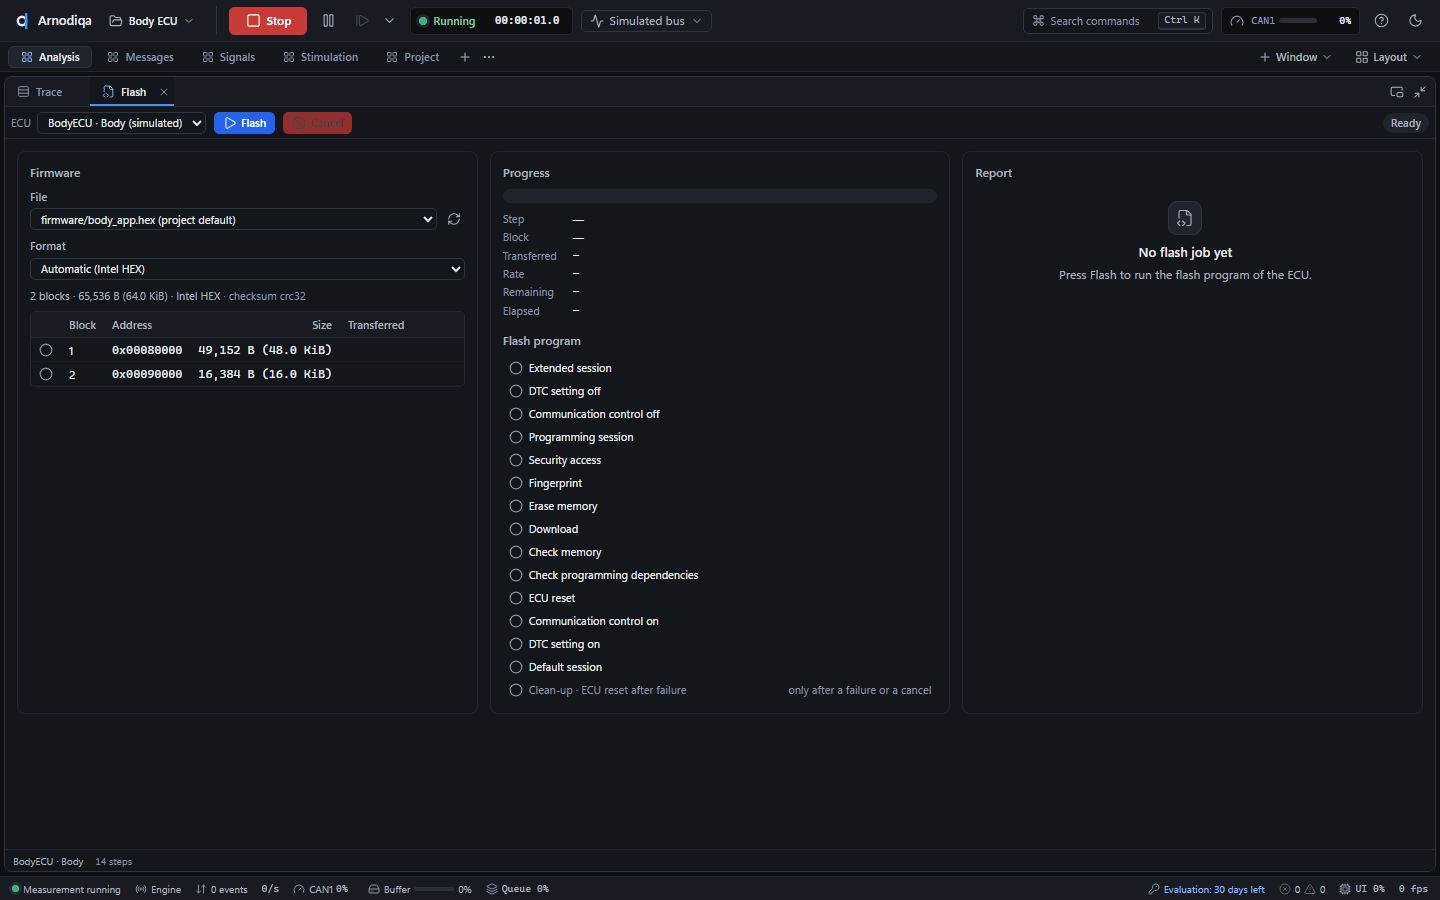
Klik op Flash (Ctrl+Enter). De voortgangsbalk, de lopende stap, het blok, de snelheid en de resterende tijd lopen mee. Cancel breekt af; de clean-up-stappen lopen dan nog.Click Flash (Ctrl+Enter). The progress bar, current step, block, rate and remaining time are updated. Cancel aborts; the clean-up steps still run.Cliquez sur Flash (Ctrl+Entrée). La barre de progression, l'étape en cours, le bloc, le débit et le temps restant se mettent à jour. Cancel interrompt l'opération ; les étapes de nettoyage (clean-up) s'exécutent quand même.
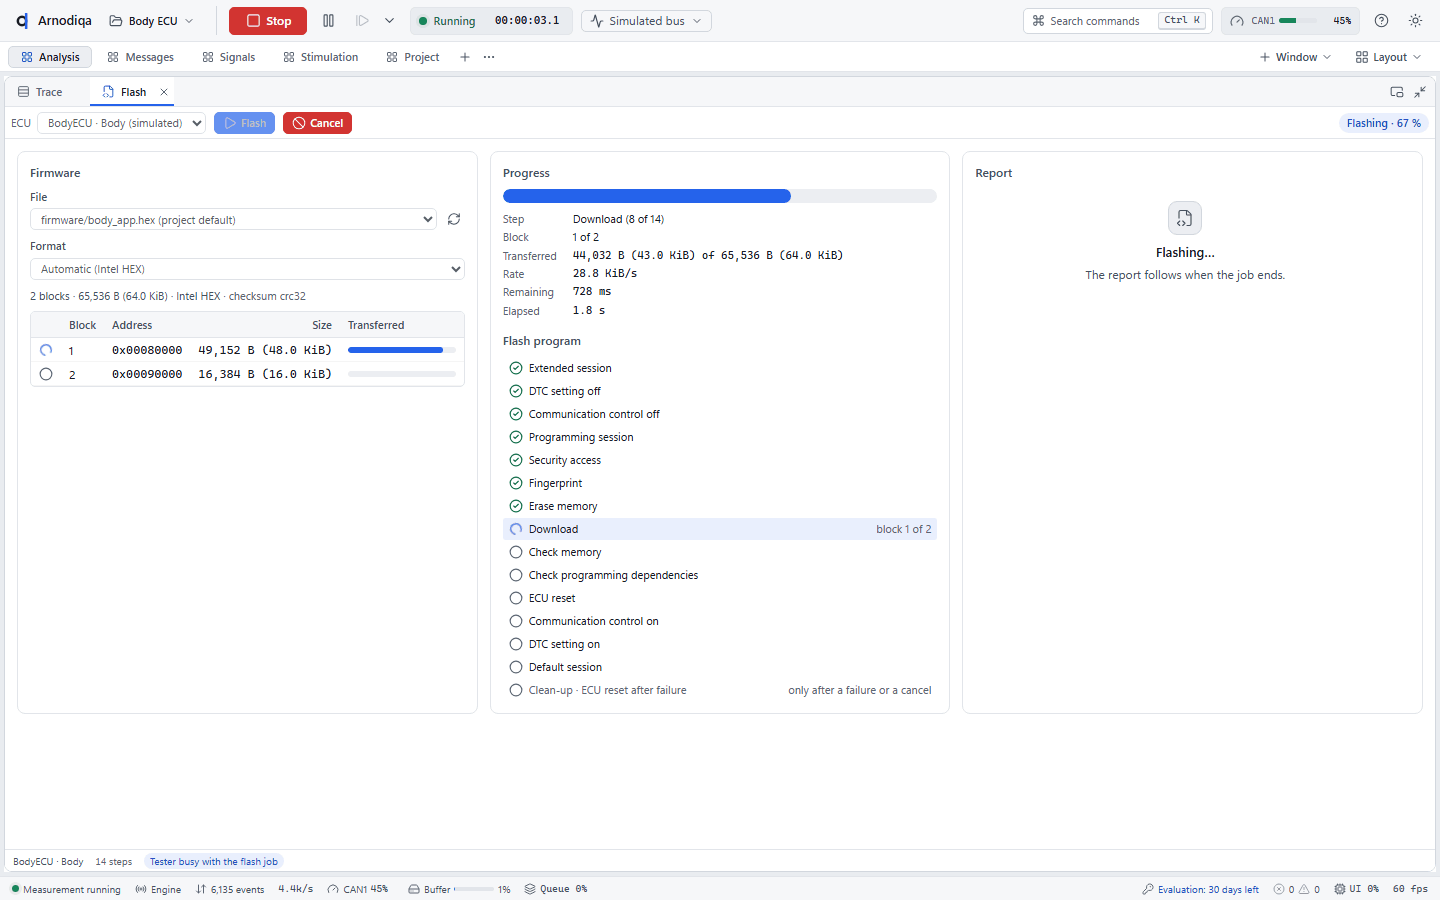
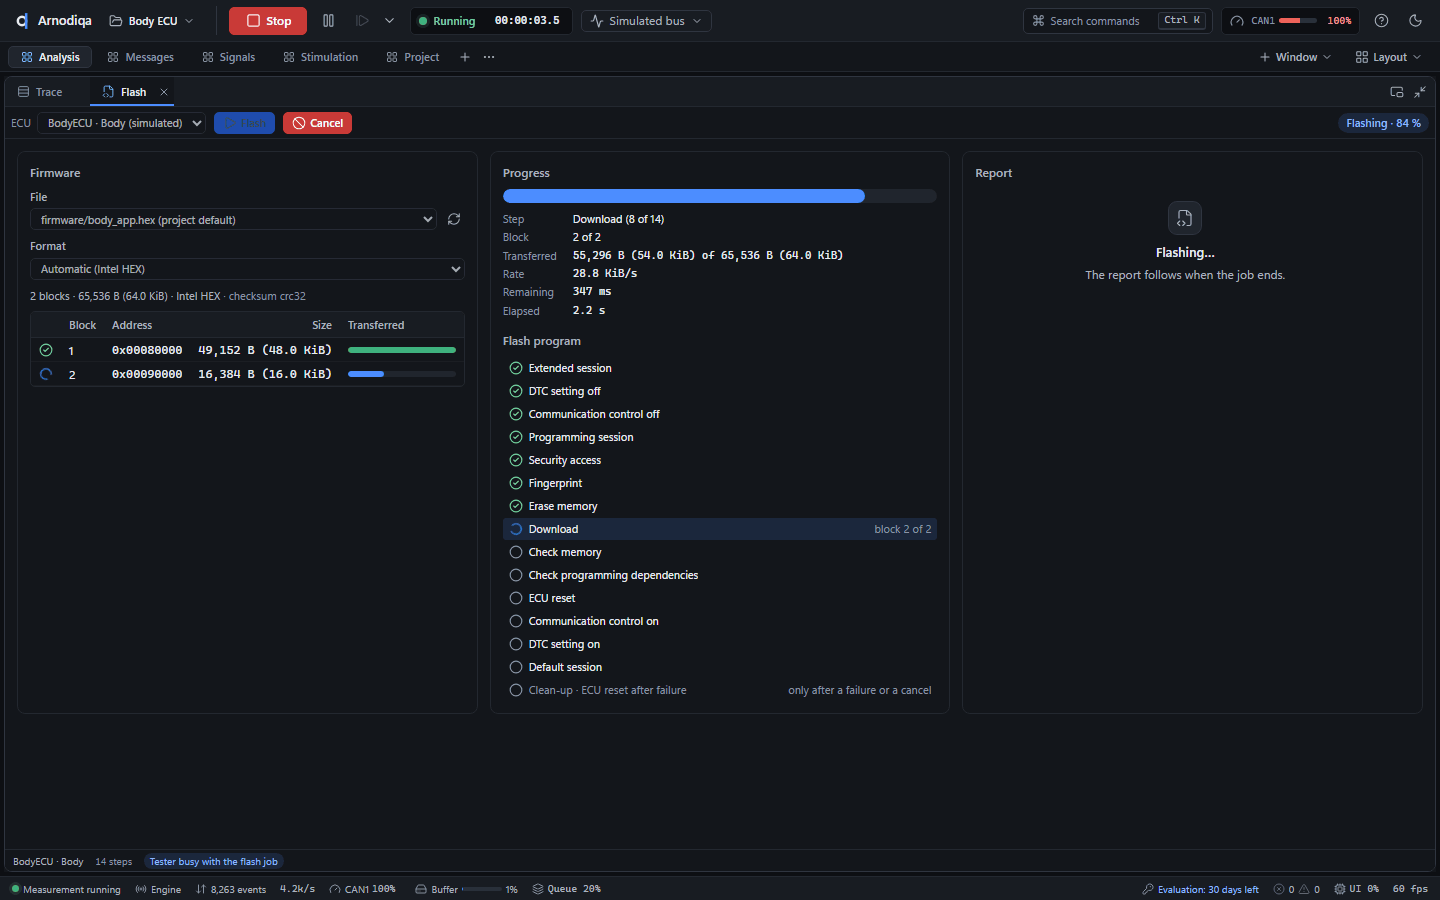
Het eindrapport toont de uitkomst, duur, snelheid en checksums. Copy report kopieert het rapport; bij een fout staan de falende stap en de NRC erbij.The final report shows the outcome, duration, rate and checksums. Copy report copies the report; on a failure it includes the failing step and the NRC.Le rapport final indique le résultat, la durée, le débit et les sommes de contrôle. Copy report copie le rapport ; en cas d'échec, il contient l'étape en échec et le NRC.
CAPL-nodes toevoegen en bewerkenAdd and edit CAPL nodesAjouter et modifier des nœuds CAPL
Bestaande CAPL-programma's draaien als simulatienode naast de restbussimulatie. De ingebouwde CAPL Editor controleert het programma tijdens het typen.Existing CAPL programs run as simulation nodes alongside the rest-bus simulation. The built-in CAPL Editor checks the program while you type.Les programmes CAPL existants s'exécutent comme nœuds de simulation, à côté de la simulation de bus résiduel. Le CAPL Editor intégré vérifie le programme pendant la saisie.
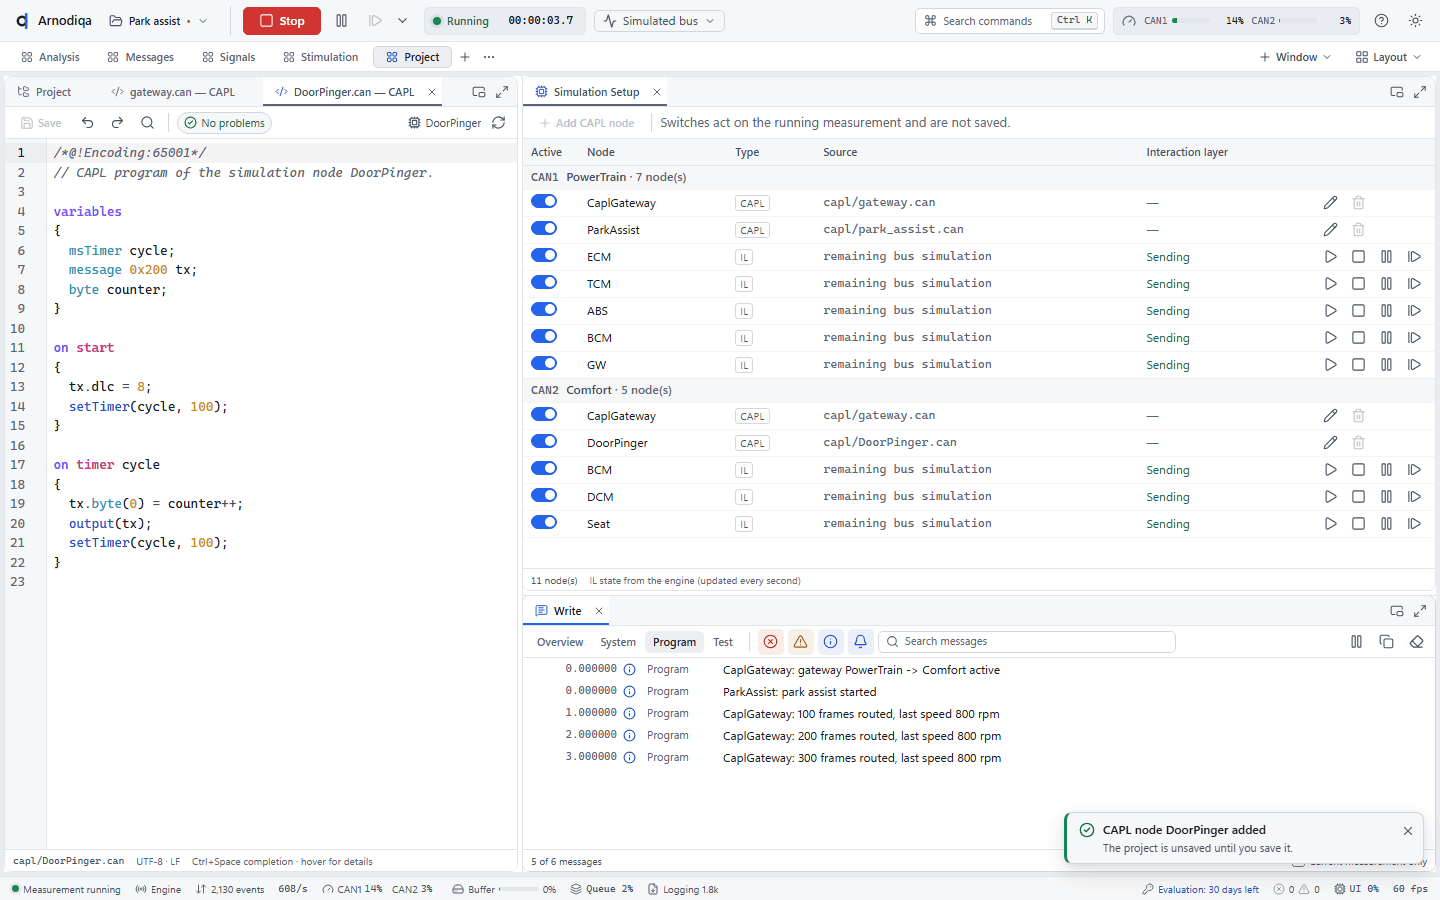
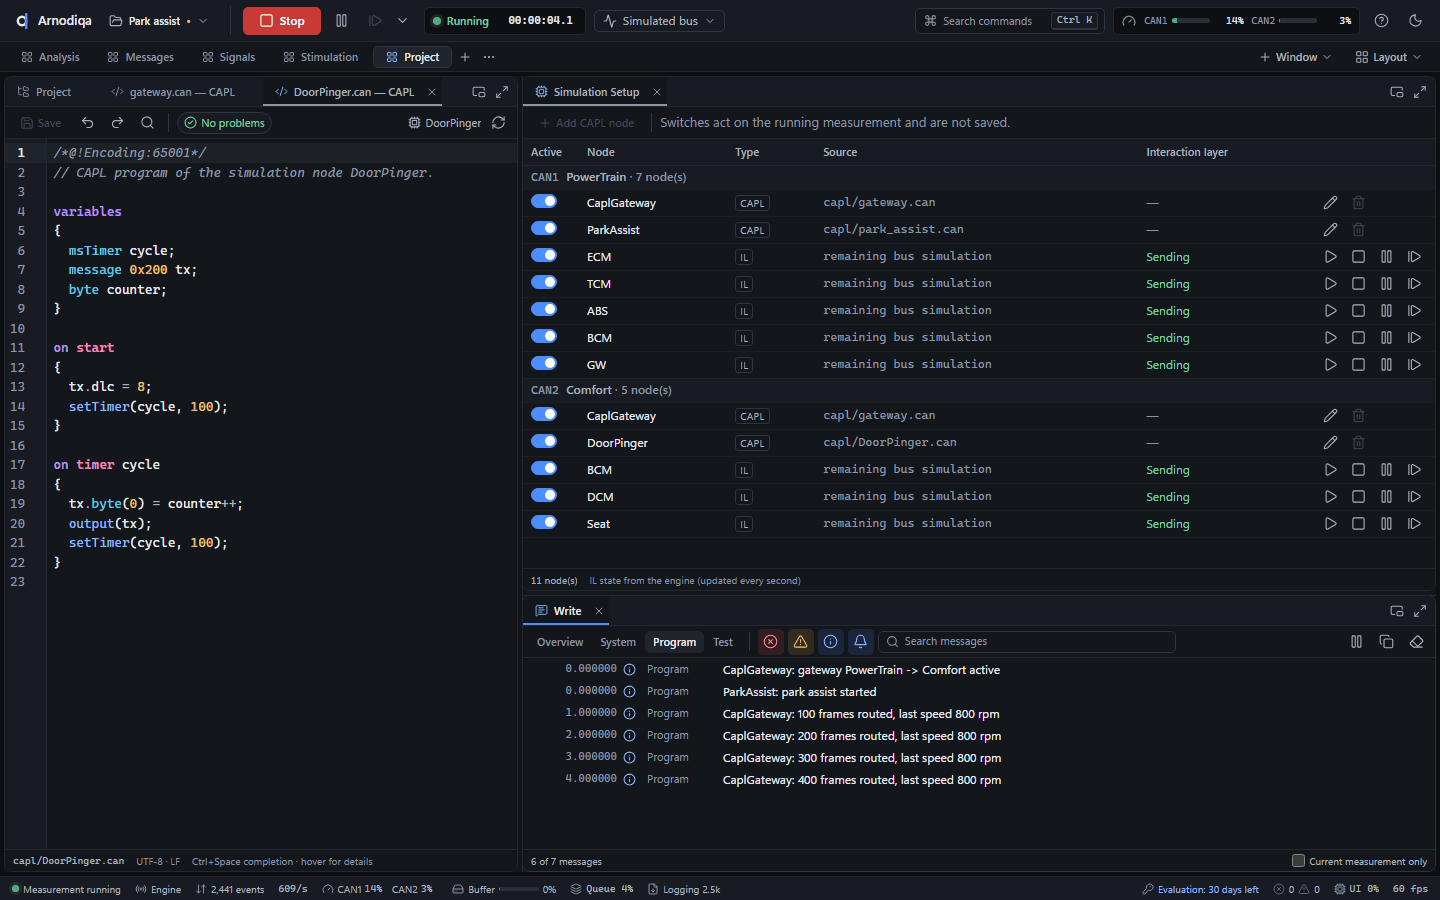
Op de desktop Project staan de CAPL-nodes onder Simulation nodes, met hun bronbestand (.can) en netwerken. In de Simulation Setup hebben ze het type CAPL; het potlood opent het programma in de CAPL Editor, de prullenbak haalt de node uit het project en Add CAPL node voegt er een toe.On the Project desktop, the CAPL nodes are listed under Simulation nodes with their source file (.can) and networks. In the simulation setup their type is CAPL; the pencil opens the program in the CAPL Editor, the bin removes the node from the project and Add CAPL node adds one.Sur le desktop Project, les nœuds CAPL figurent sous Simulation nodes, avec leur fichier source (.can) et leurs réseaux. Dans le Simulation Setup, leur type est CAPL ; le crayon ouvre le programme dans le CAPL Editor, la corbeille retire le nœud du projet et Add CAPL node en ajoute un.
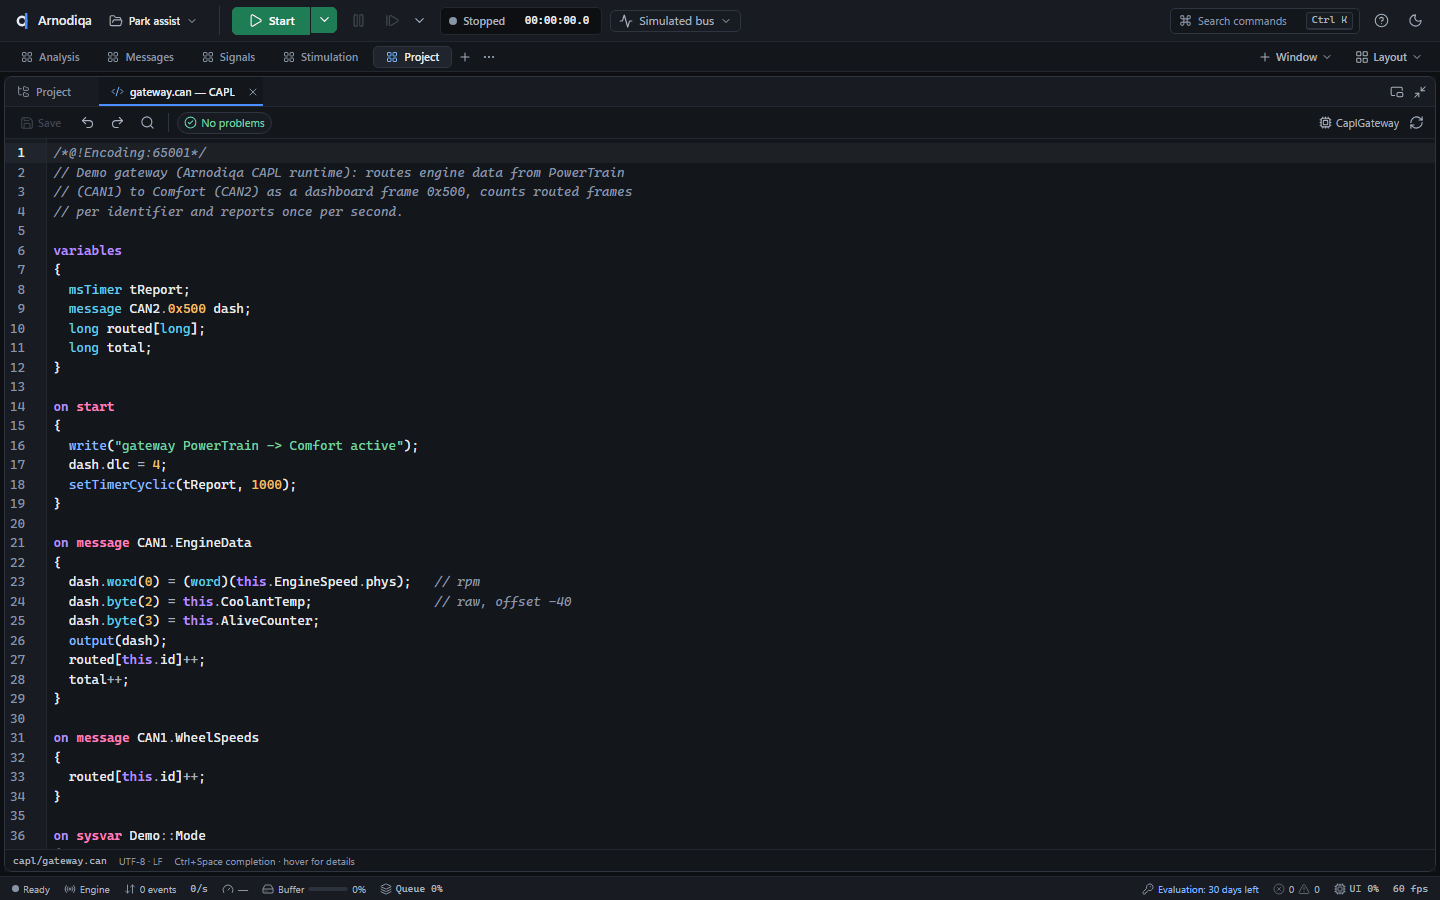
De CAPL Editor toont het programma met syntaxkleuring en regelnummers. Rechtsboven staan de nodes die dit bestand draaien (hier CaplGateway); No problems komt van dezelfde compiler als bij de meetstart en bij
arnodiqa capl check.The CAPL Editor shows the program with syntax highlighting and line numbers. At the top right are the nodes that run this file (here CaplGateway); No problems comes from the same compiler as at measurement start and inarnodiqa capl check.Le CAPL Editor affiche le programme avec coloration syntaxique et numéros de ligne. En haut à droite figurent les nœuds qui exécutent ce fichier (ici CaplGateway) ; No problems provient du même compilateur qu'au démarrage de la mesure et quearnodiqa capl check.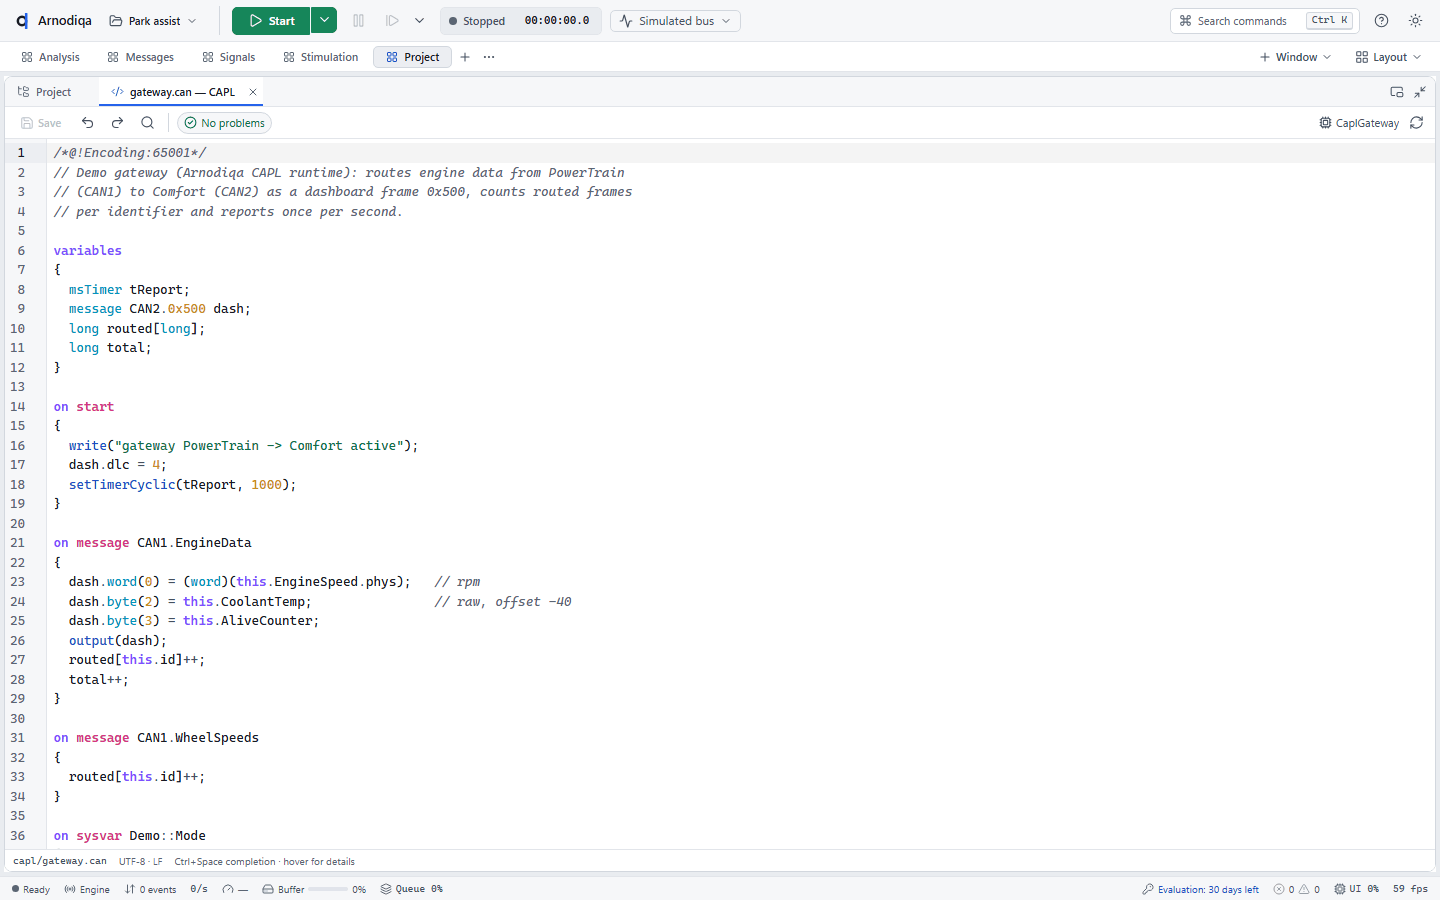
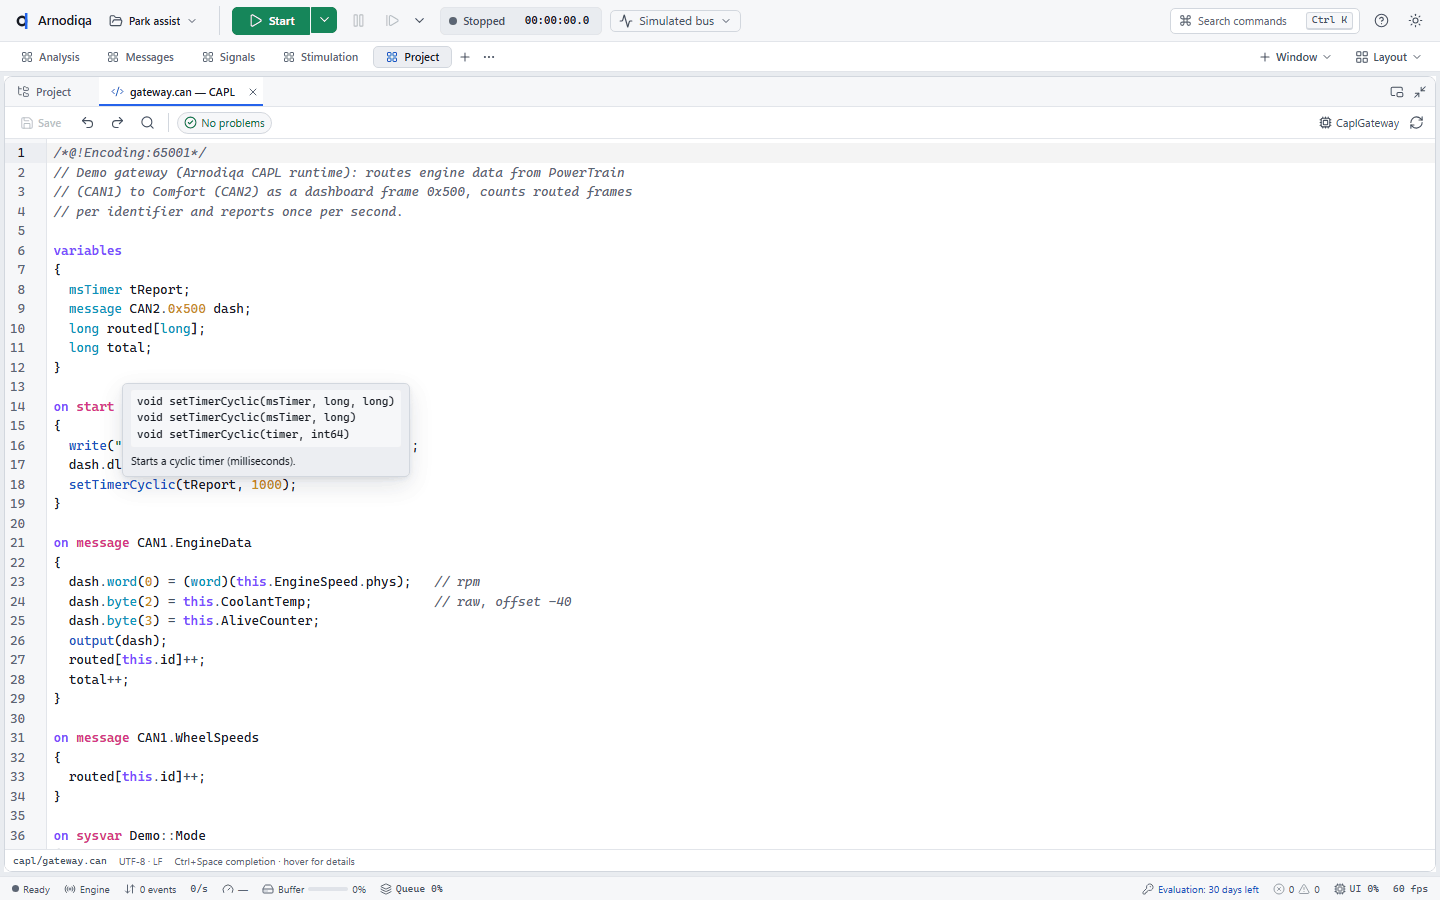
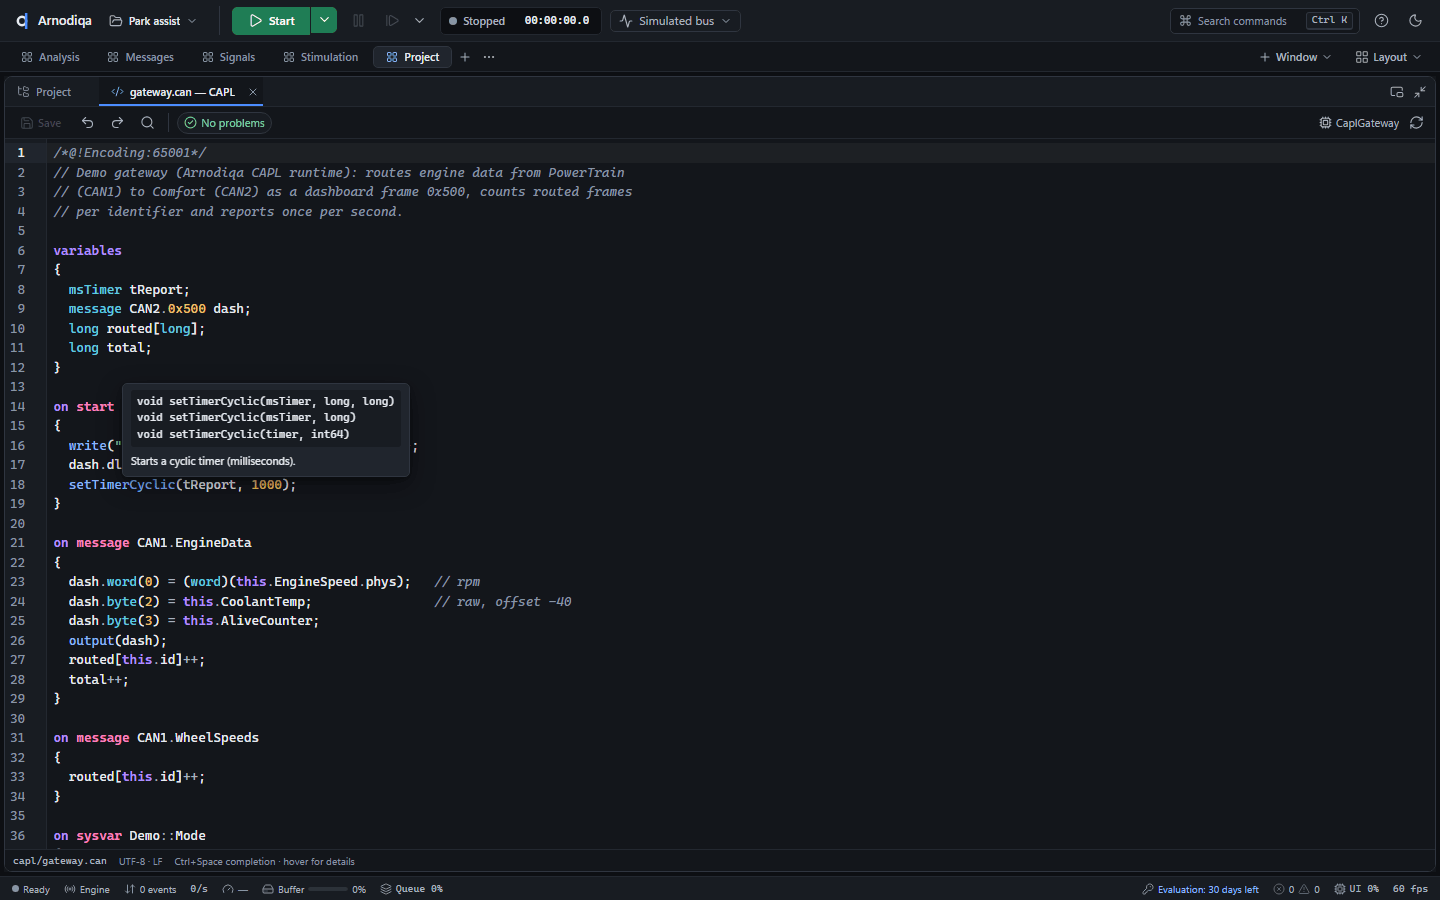
Houd de muis boven een naam voor uitleg: bij een CAPL-functie alle vormen met hun parameters, bij een bericht ID, lengte, cyclustijd en signalen, bij een signaal schaal, eenheid en value table.Hover over a name for details: for a CAPL function all its forms with their parameters, for a message the ID, length, cycle time and signals, for a signal the scaling, unit and value table.Survolez un nom avec la souris pour obtenir des détails : pour une fonction CAPL, toutes ses formes avec leurs paramètres ; pour un message, l'ID, la longueur, le temps de cycle et les signaux ; pour un signal, la mise à l'échelle, l'unité et la value table.
Arnodiqa controleert het programma terwijl je typt: fouten krijgen een rode golflijn en een markering in de kantlijn, en de teller in de werkbalk toont het aantal fouten en waarschuwingen (klik erop voor de lijst, of Ctrl+Shift+M). Hier is totl onbekend en ontbreekt een puntkomma.Arnodiqa checks the program while you type: errors get a red wavy underline and a marker in the margin, and the counter in the toolbar shows the number of errors and warnings (click it for the list, or Ctrl+Shift+M). Here totl is unknown and a semicolon is missing.Arnodiqa vérifie le programme pendant la saisie : les erreurs sont soulignées d'une ligne ondulée rouge et signalées dans la marge, et le compteur de la barre d'outils indique le nombre d'erreurs et d'avertissements (cliquez dessus pour afficher la liste, ou Ctrl+Maj+M). Ici, totl est inconnu et il manque un point-virgule.
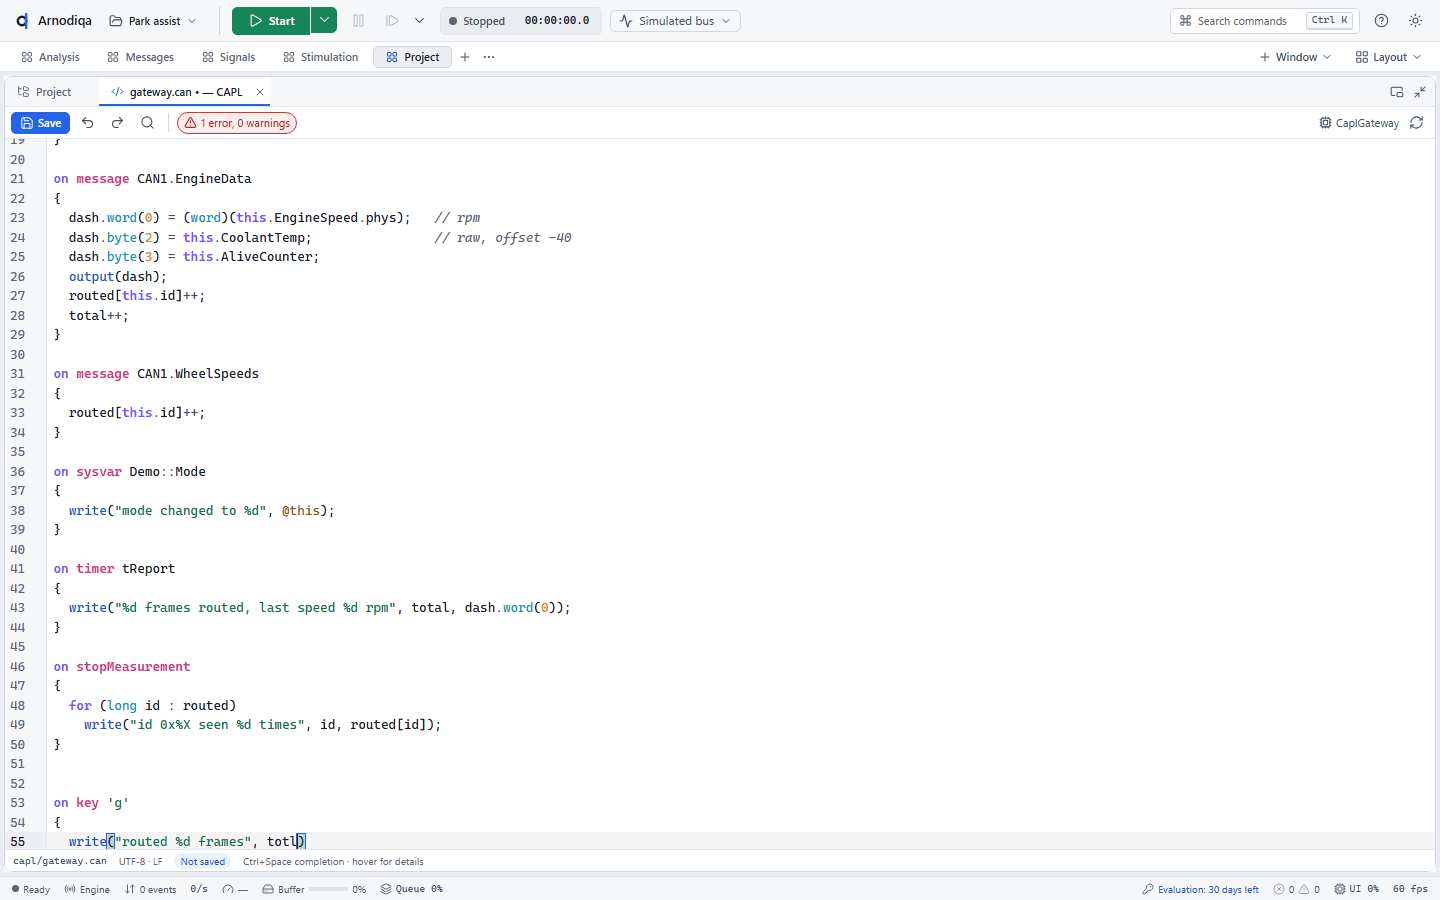
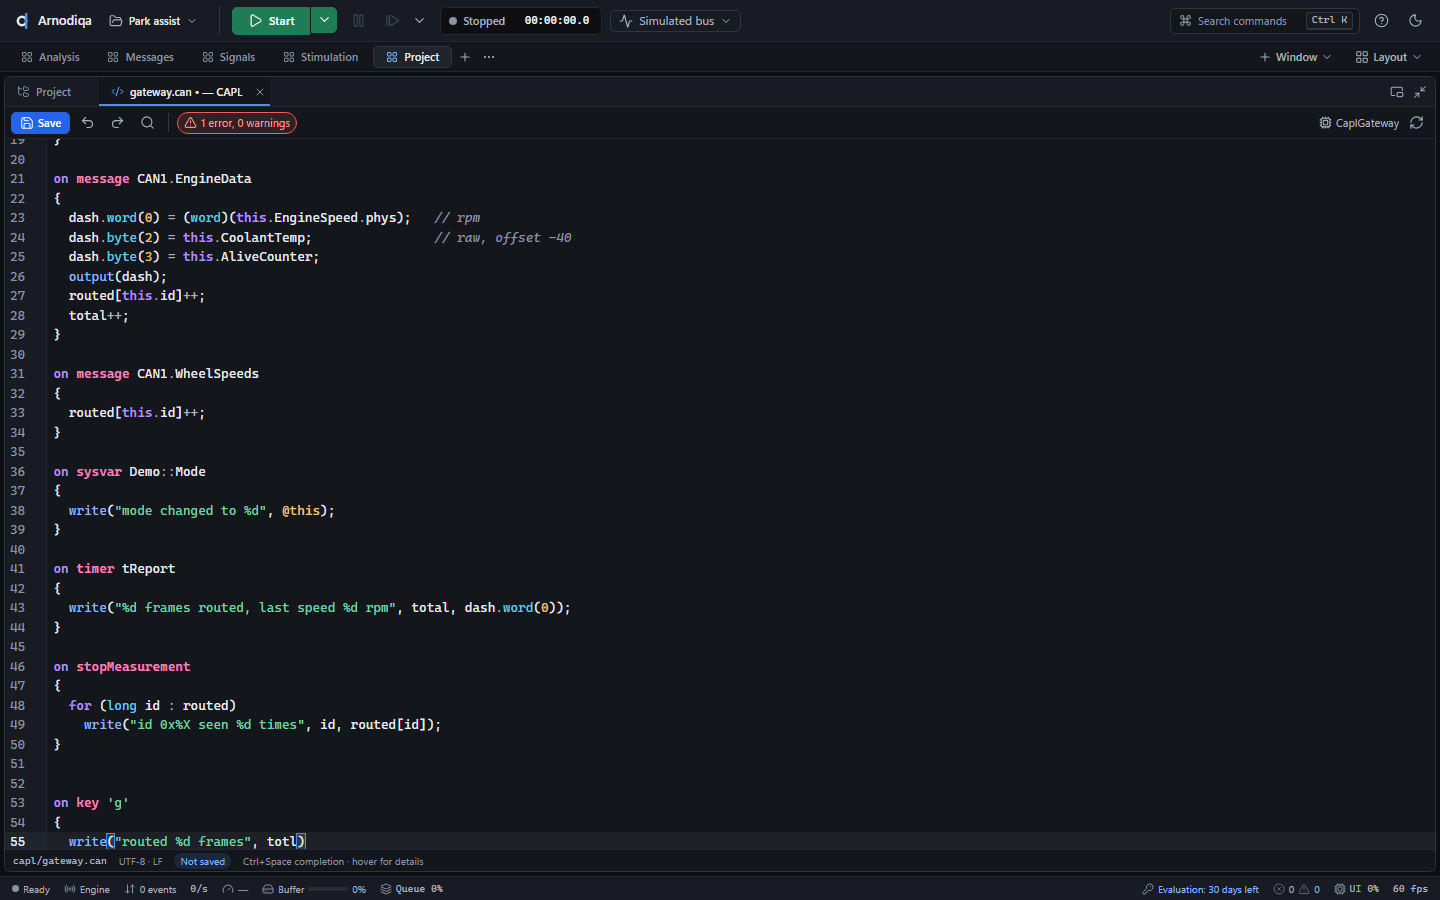
Ctrl+Space, of gewoon typen, toont aanvullingen: variabelen, functies en CAPL-functies, berichten en signalen uit de databases van het project, en na @ de systeemvariabelen. Enter of Tab neemt de keuze over.Ctrl+Space, or simply typing, shows completions: variables, functions and CAPL functions, messages and signals from the project's databases, and after @ the system variables. Enter or Tab accepts the choice.Ctrl+Espace, ou simplement la saisie, affiche des propositions : variables, fonctions et fonctions CAPL, messages et signaux des bases de données du projet et, après @, les variables système. Entrée ou Tab valide le choix.
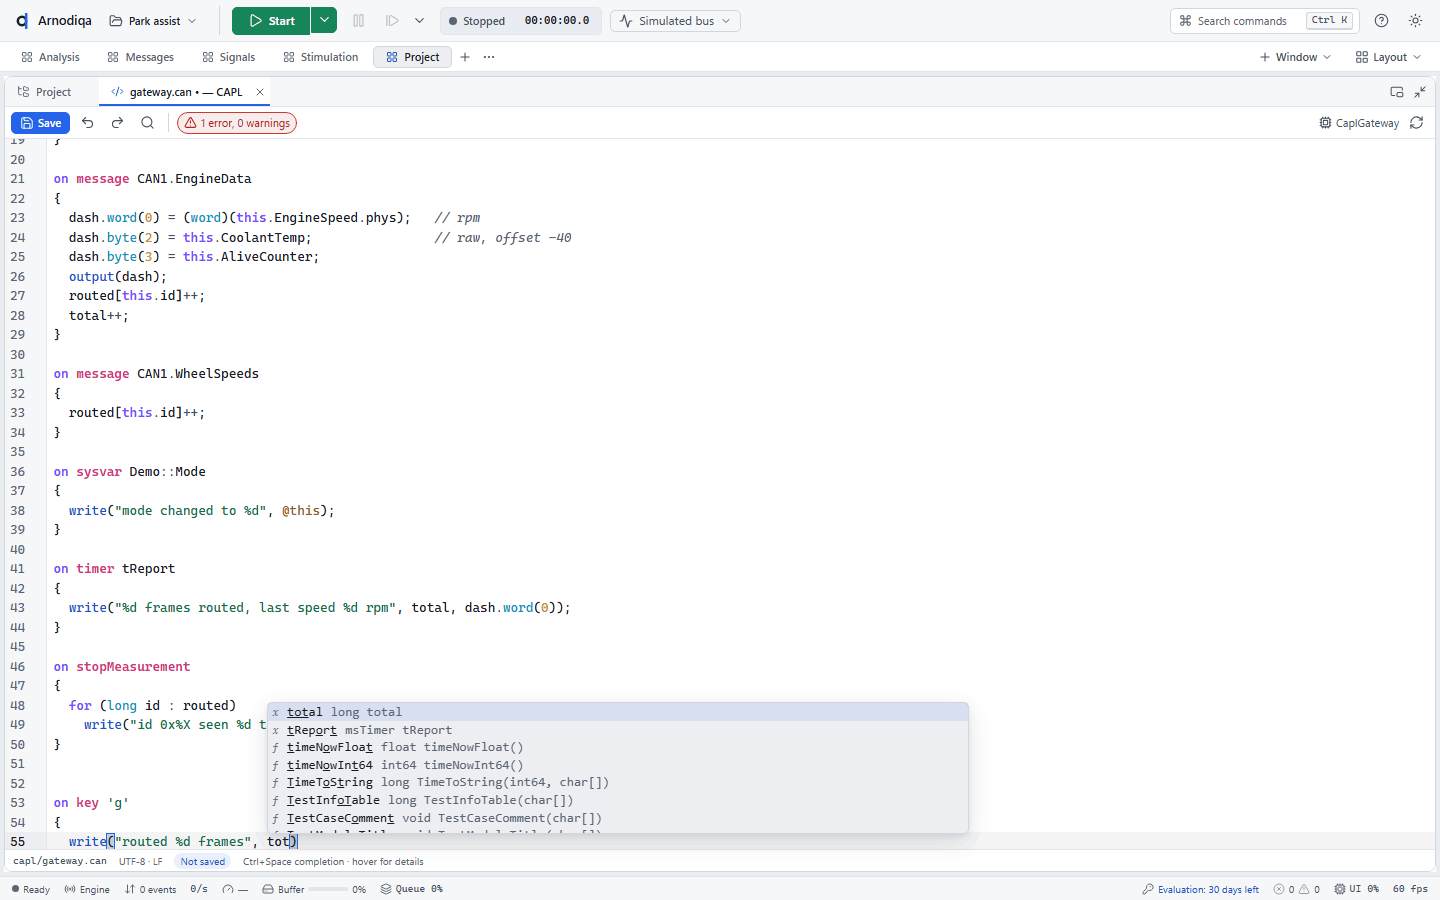
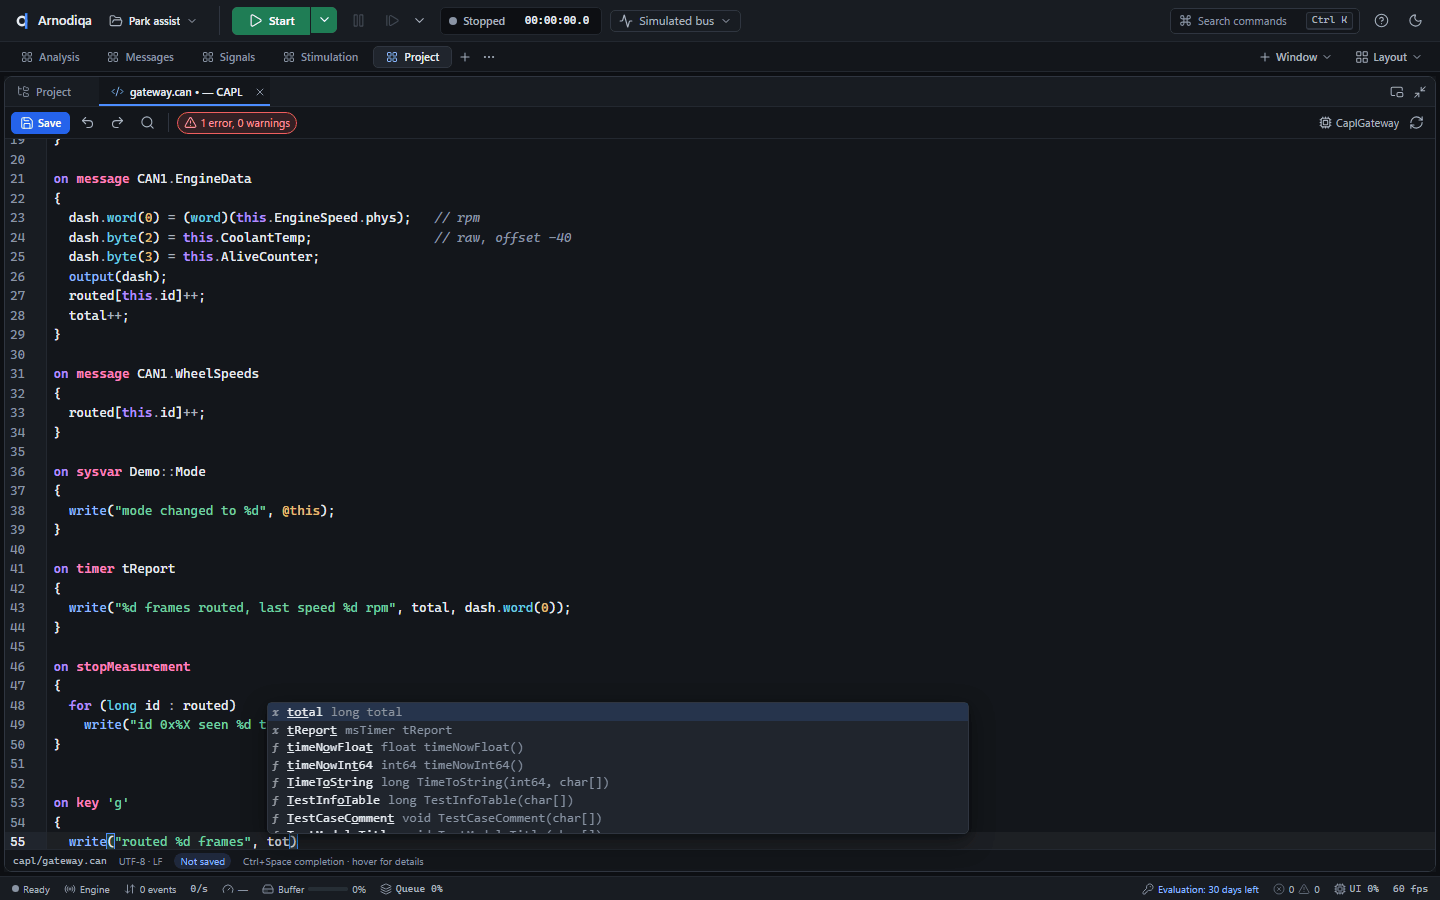
Ctrl+S (of Save) bewaart het bestand en laadt de node opnieuw met het nieuwe programma. Tijdens een meting vraagt Arnodiqa eerst bevestiging; de lopende meting houdt het oude programma tot de volgende start.Ctrl+S (or Save) saves the file and reloads the node with the new program. During a measurement Arnodiqa asks for confirmation first; the running measurement keeps the old program until the next start.Ctrl+S (ou Save) enregistre le fichier et recharge le nœud avec le nouveau programme. Pendant une mesure, Arnodiqa demande d'abord une confirmation ; la mesure en cours conserve l'ancien programme jusqu'au démarrage suivant.
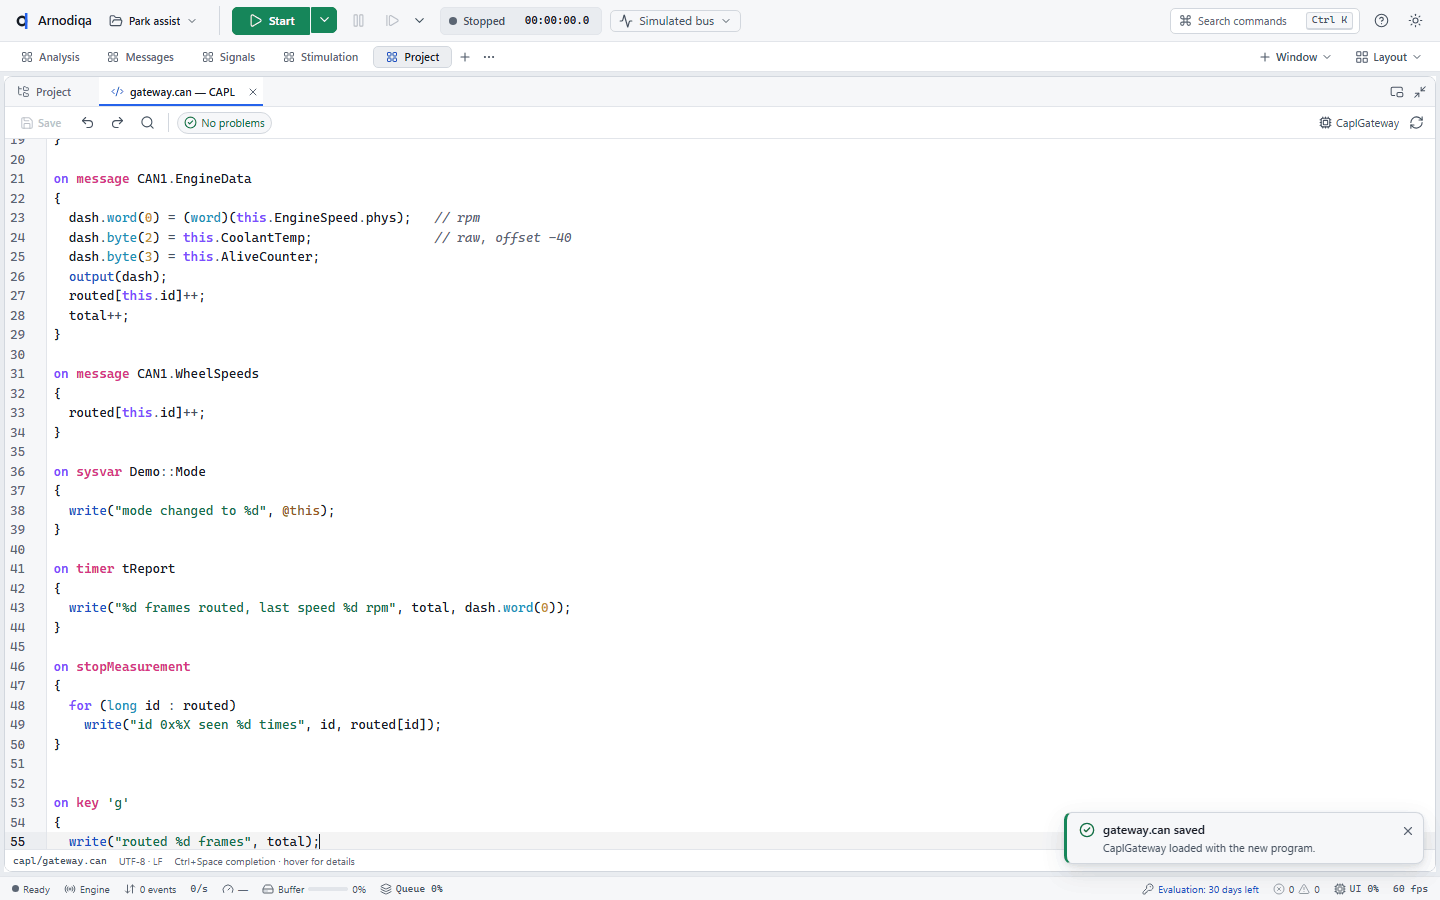
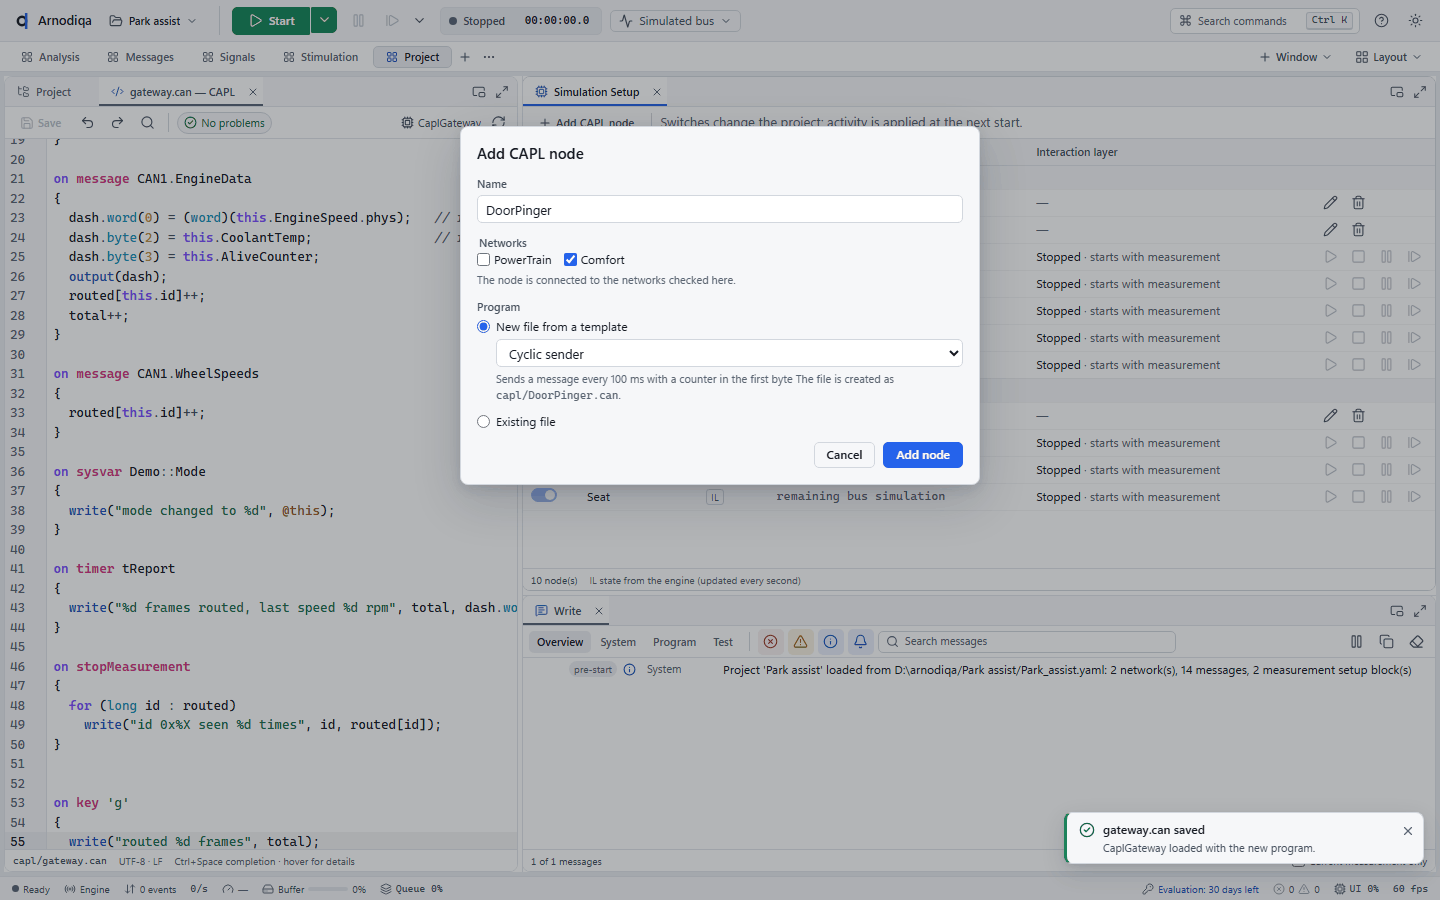
Een node toevoegen: klik in de Simulation Setup op Add CAPL node of op de + bij Simulation nodes in de projectverkenner. Geef een naam, kies de netwerken en een sjabloon (Empty node, Cyclic sender, Echo / gateway); het bestand wordt capl/<naam>.can. Existing file gebruikt een bestaand .can-bestand, in de projectmap of daarbuiten (gekopieerd of relatief verwezen).To add a node, click Add CAPL node in the simulation setup or the + next to Simulation nodes in the project explorer. Enter a name, choose the networks and a template (Empty node, Cyclic sender, Echo / gateway); the file becomes capl/<name>.can. Existing file uses an existing .can file, inside the project folder or outside it (copied or referenced with a relative path).Pour ajouter un nœud, cliquez sur Add CAPL node dans le Simulation Setup ou sur le + à côté de Simulation nodes dans l'explorateur de projet. Saisissez un nom, choisissez les réseaux et un modèle (Empty node, Cyclic sender, Echo / gateway) ; le fichier devient capl/<nom>.can. Existing file utilise un fichier .can existant, dans le dossier du projet ou en dehors (copié ou désigné par un chemin relatif).
De node staat in de Simulation Setup en zijn programma opent in de editor. Start de meting: de CAPL-programma's draaien en hun write()-uitvoer staat in het Write-venster op het tabblad Program, met de nodenaam ervoor. Sla het project op om de nieuwe node te bewaren.The node appears in the simulation setup and its program opens in the editor. Start the measurement: the CAPL programs run and their write() output appears in the Write window on the Program tab, prefixed with the node name. Save the project to keep the new node.Le nœud apparaît dans le Simulation Setup et son programme s'ouvre dans l'éditeur. Démarrez la mesure : les programmes CAPL s'exécutent et leur sortie write() s'affiche dans la fenêtre Write, onglet Program, précédée du nom du nœud. Enregistrez le projet pour conserver le nouveau nœud.
Testunits draaien in de Test RunnerRun test units in the Test RunnerExécuter des unités de test dans le Test Runner
De Test Runner draait de testunits van het project in de gesimuleerde bus en toont het rapport in de app. De uitkomst is dezelfde als met arnodiqa test.The Test Runner runs the project's test units on the simulated bus and shows the report in the app. The outcome is the same as with arnodiqa test.Le Test Runner exécute les unités de test du projet sur le bus simulé et affiche le rapport dans l'application. Le résultat est identique à celui de arnodiqa test.
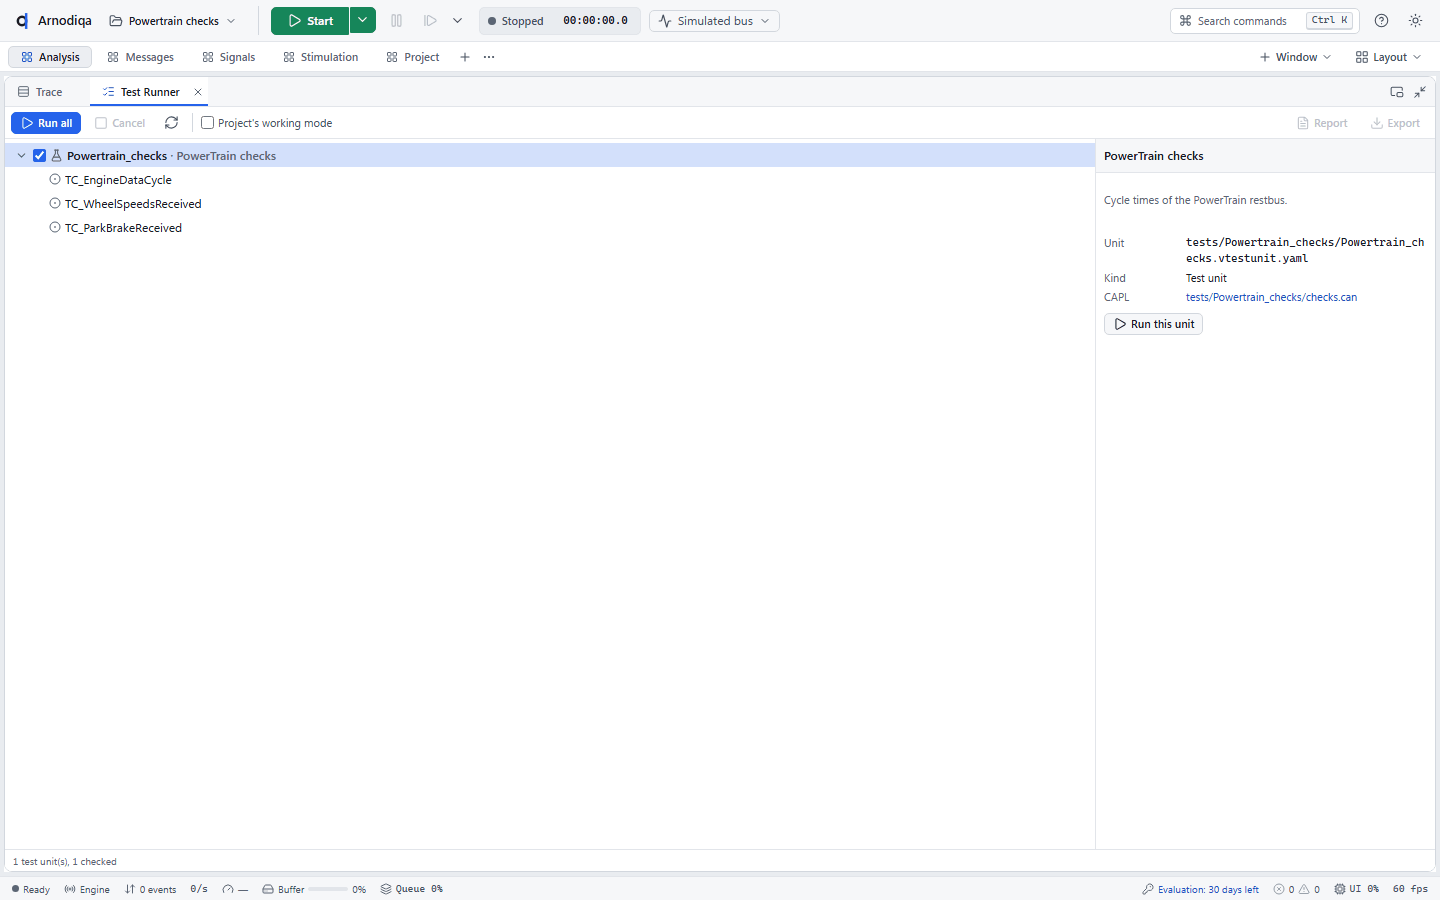
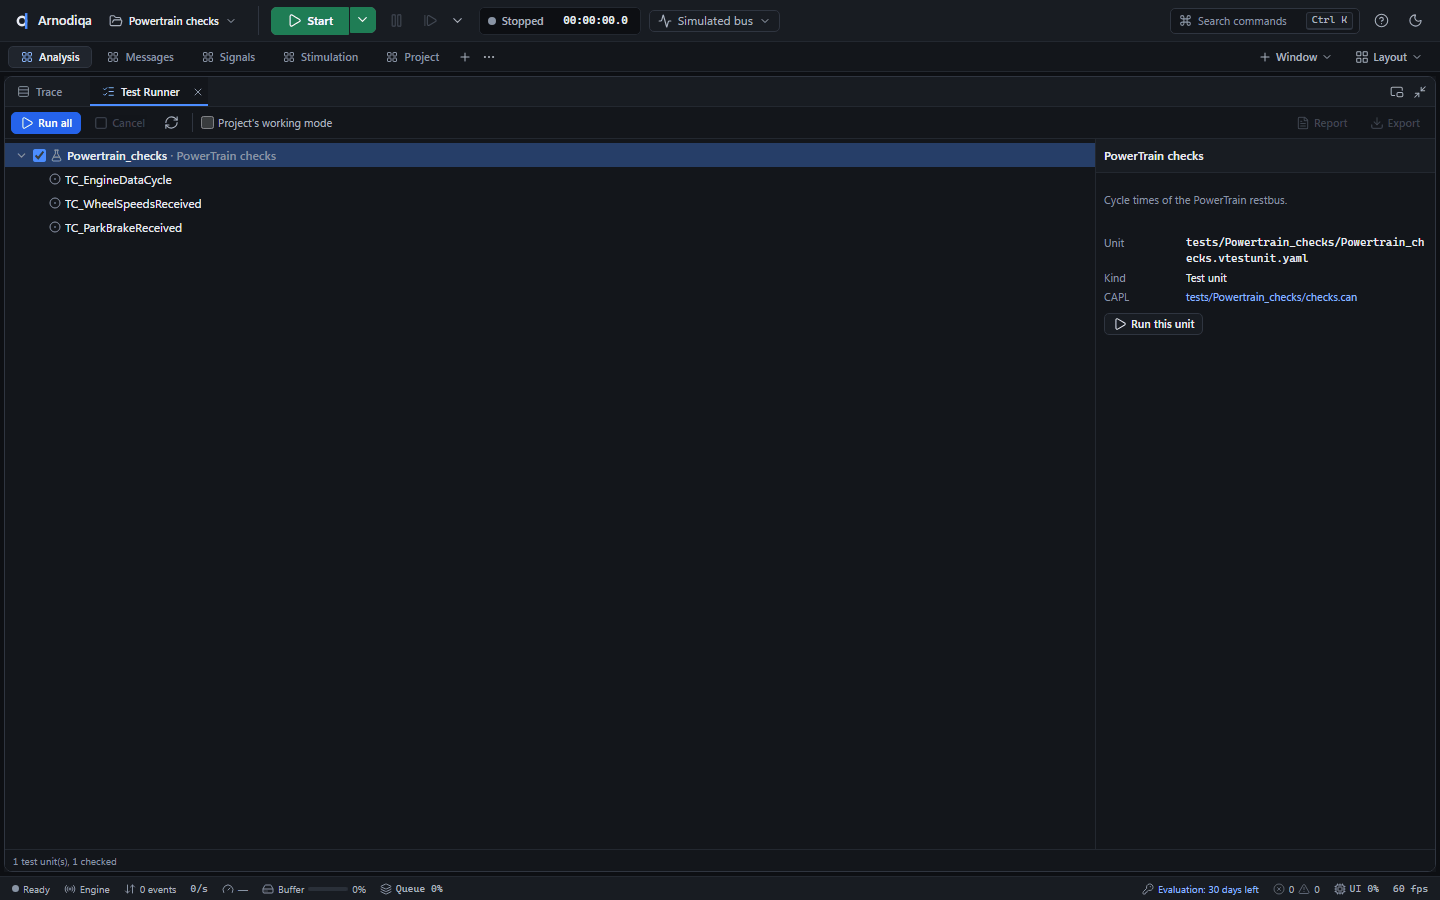
Open de Test Runner met Ctrl+K en New Test Runner window. Links staan de testunits van het project (de *.vtestunit.yaml-bestanden onder tests/) met hun testcases; een testboom (*.vtesttree.yaml) verschijnt met zijn groepen. Het vinkje bepaalt welke units meedoen.Open the Test Runner with Ctrl+K and New Test Runner window. The left side lists the project's test units (the *.vtestunit.yaml files under tests/) with their test cases; a test tree (*.vtesttree.yaml) appears with its groups. The tick determines which units take part.Ouvrez le Test Runner avec Ctrl+K et New Test Runner window. À gauche figurent les unités de test du projet (les fichiers *.vtestunit.yaml sous tests/) avec leurs cas de test ; un arbre de test (*.vtesttree.yaml) apparaît avec ses groupes. La case à cocher détermine les unités exécutées.
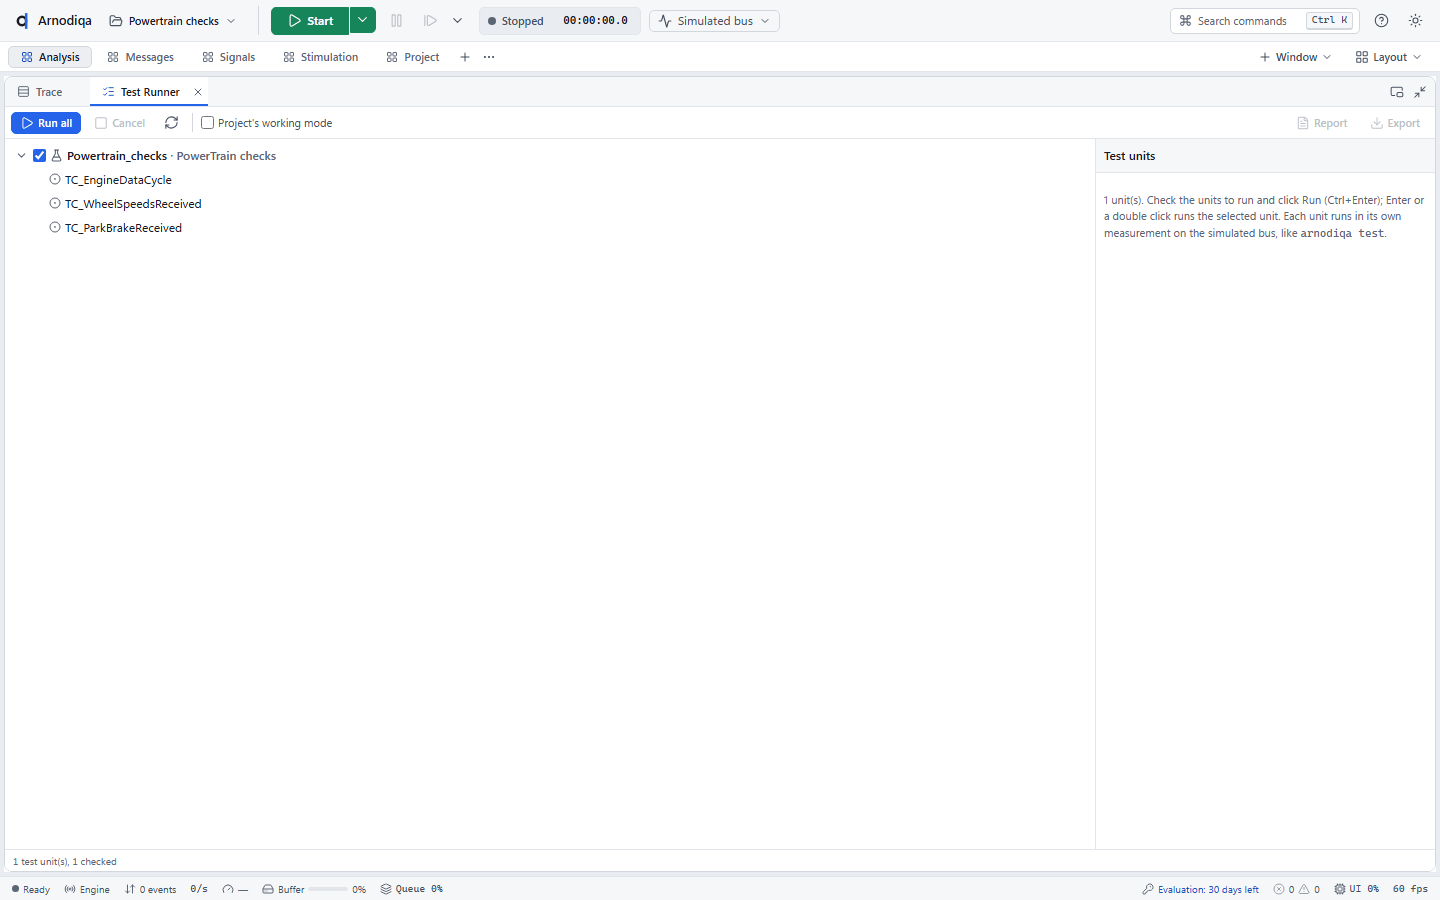
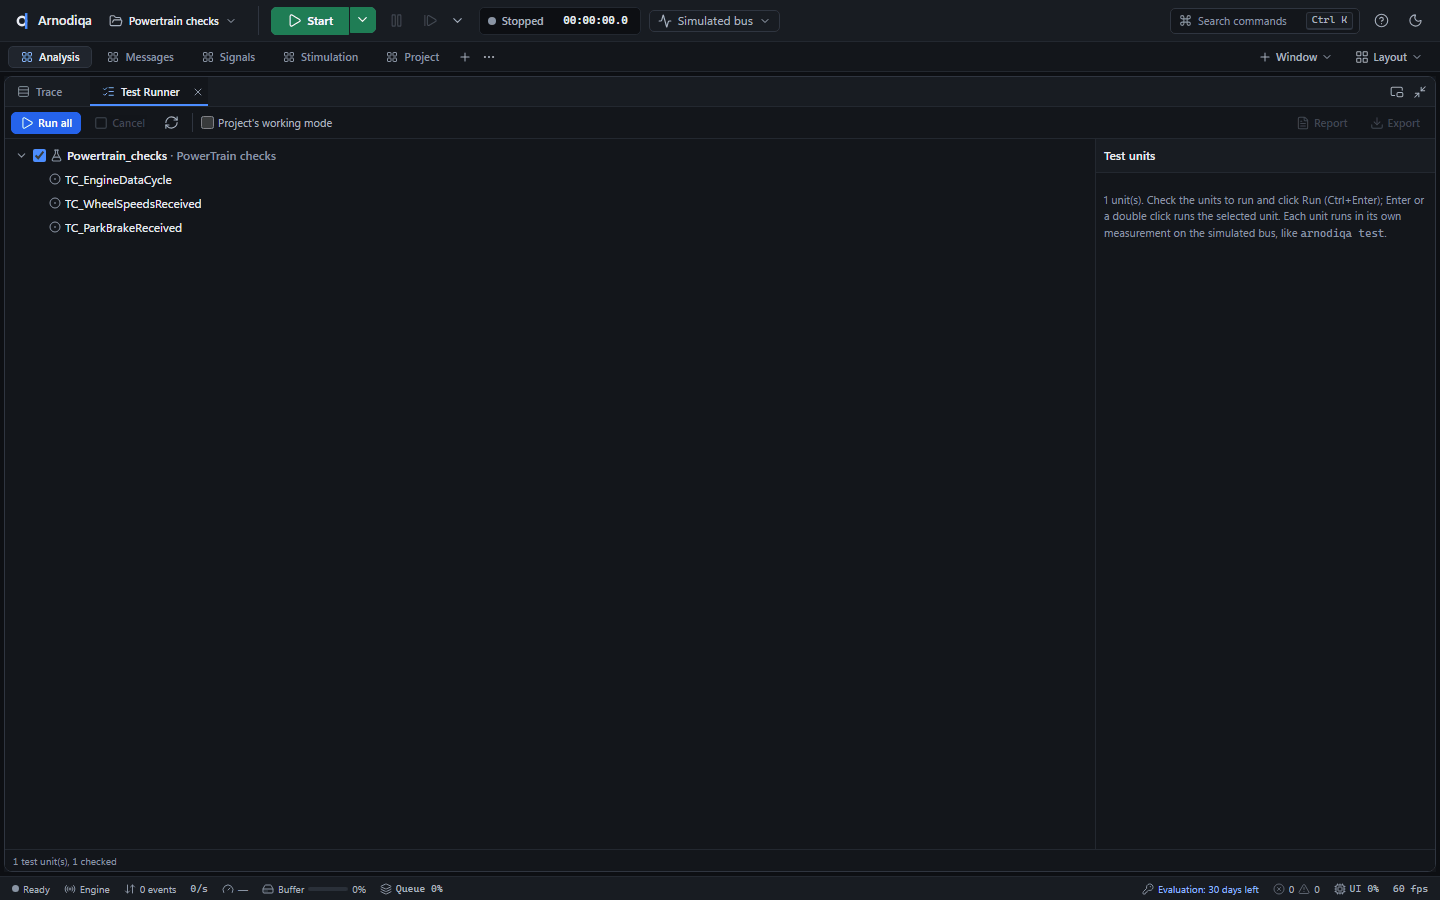
Klik op een unit voor de details: titel en beschrijving, het bestand en de CAPL-bronnen (een klik opent ze in de CAPL Editor). Met de pijltjestoetsen loop je door de boom, Spatie zet het vinkje en Enter of Run this unit draait de geselecteerde unit.Click a unit for its details: title and description, the file and the CAPL sources (a click opens them in the CAPL Editor). The arrow keys move through the tree, Space toggles the tick and Enter or Run this unit runs the selected unit.Cliquez sur une unité pour afficher ses détails : titre et description, fichier et sources CAPL (un clic les ouvre dans le CAPL Editor). Les touches fléchées parcourent l'arbre, Espace coche ou décoche, et Entrée ou Run this unit exécute l'unité sélectionnée.
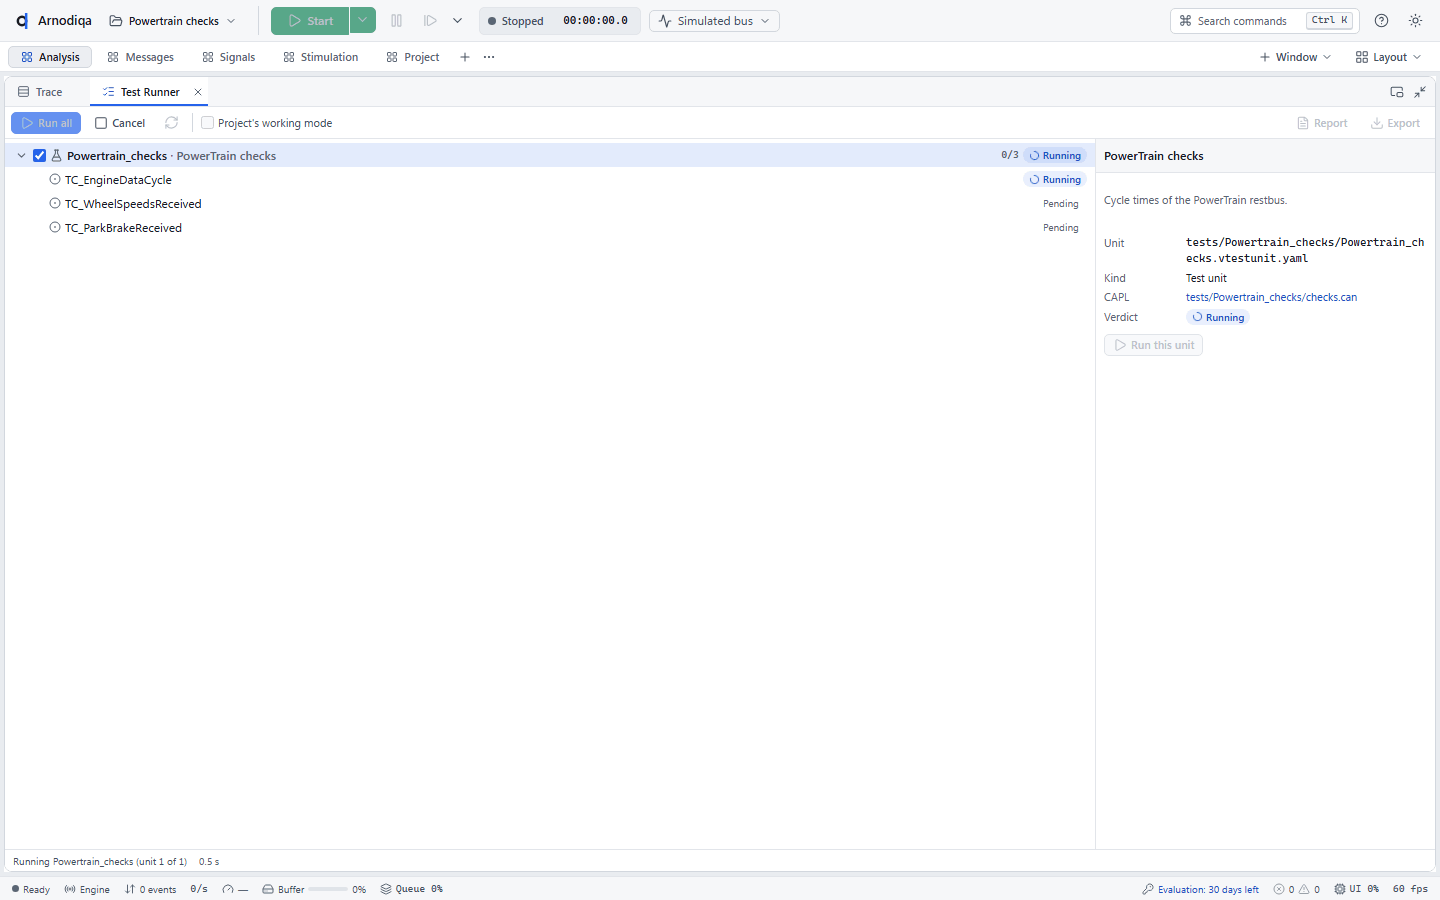
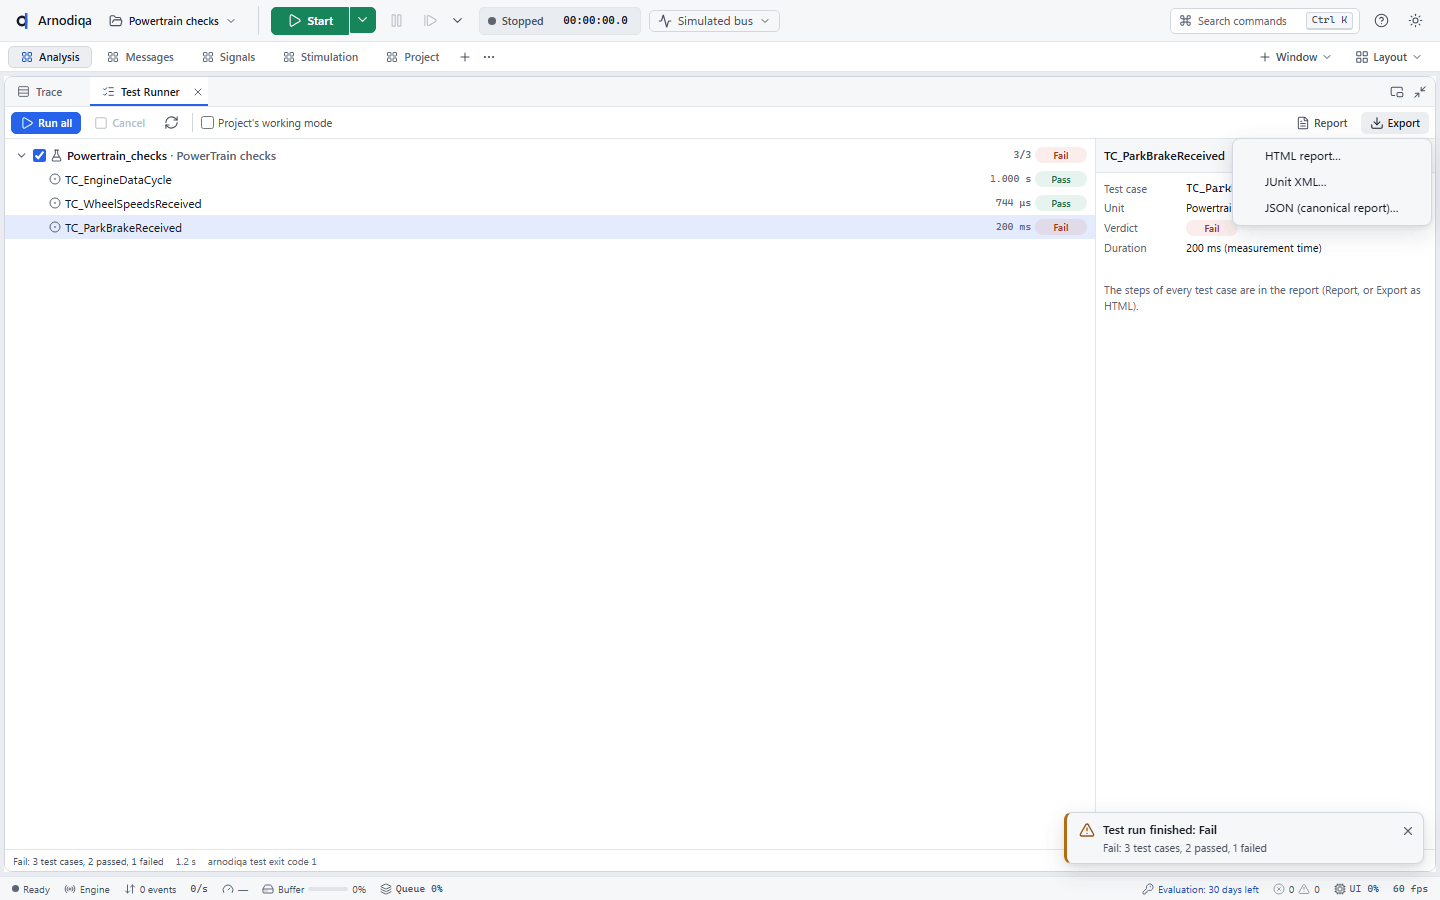
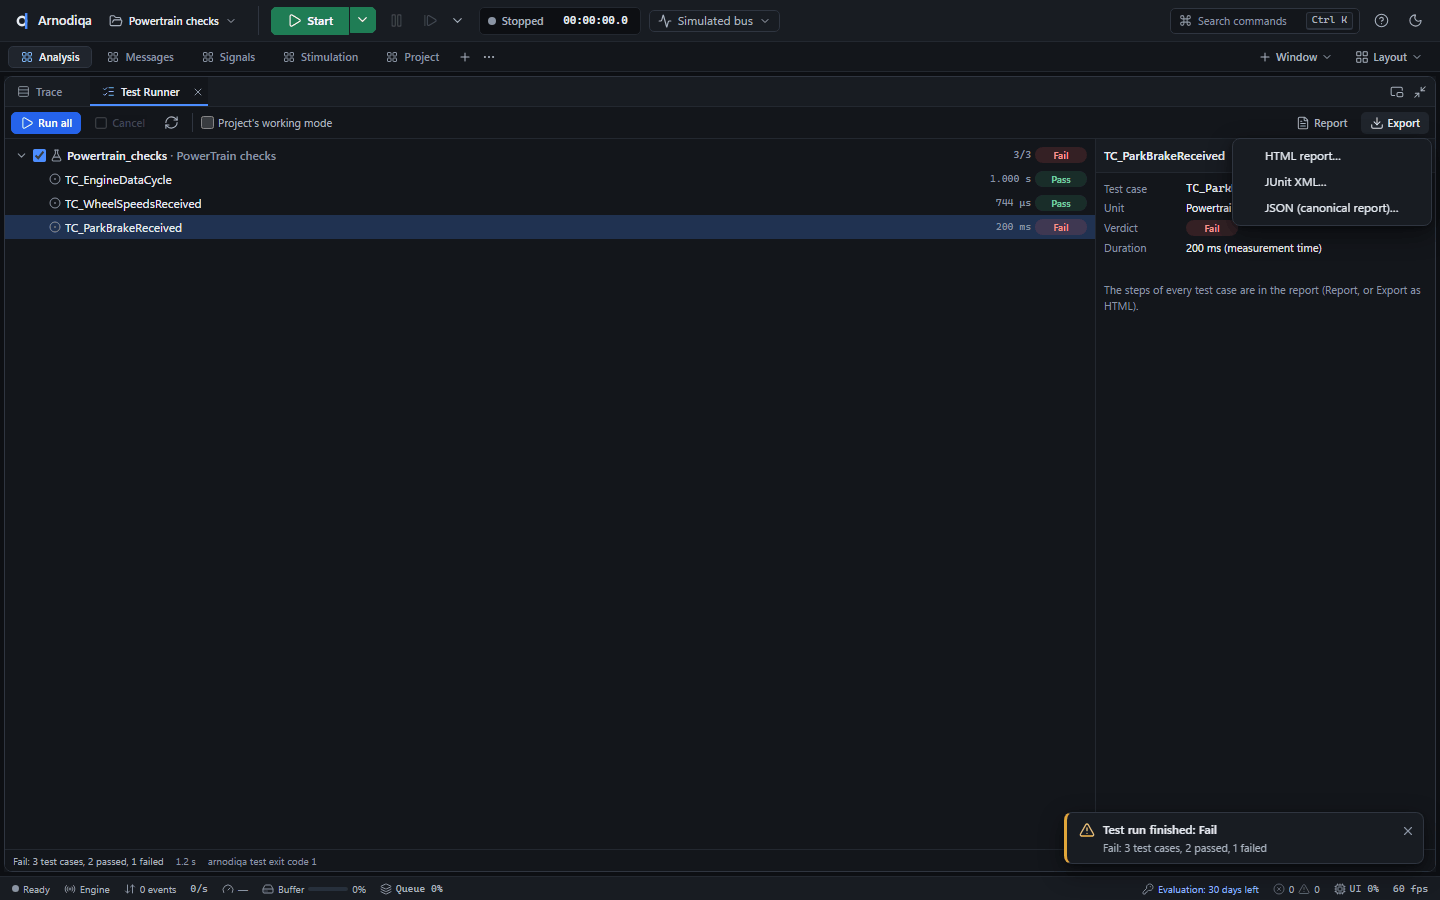
Klik op Run all (Ctrl+Enter). Elke unit draait in een eigen meting op de gesimuleerde bus; de lopende testcase staat op Running en de verdicts verschijnen zodra een testcase klaar is. Cancel breekt de run af: de lopende unit stopt en de rest wordt overgeslagen.Click Run all (Ctrl+Enter). Each unit runs in its own measurement on the simulated bus; the current test case shows Running and the verdicts appear as soon as a test case finishes. Cancel aborts the run: the current unit stops and the rest is skipped.Cliquez sur Run all (Ctrl+Entrée). Chaque unité s'exécute dans sa propre mesure sur le bus simulé ; le cas de test en cours affiche Running et les verdicts apparaissent dès qu'un cas de test se termine. Cancel interrompt l'exécution : l'unité en cours s'arrête et les suivantes sont ignorées.
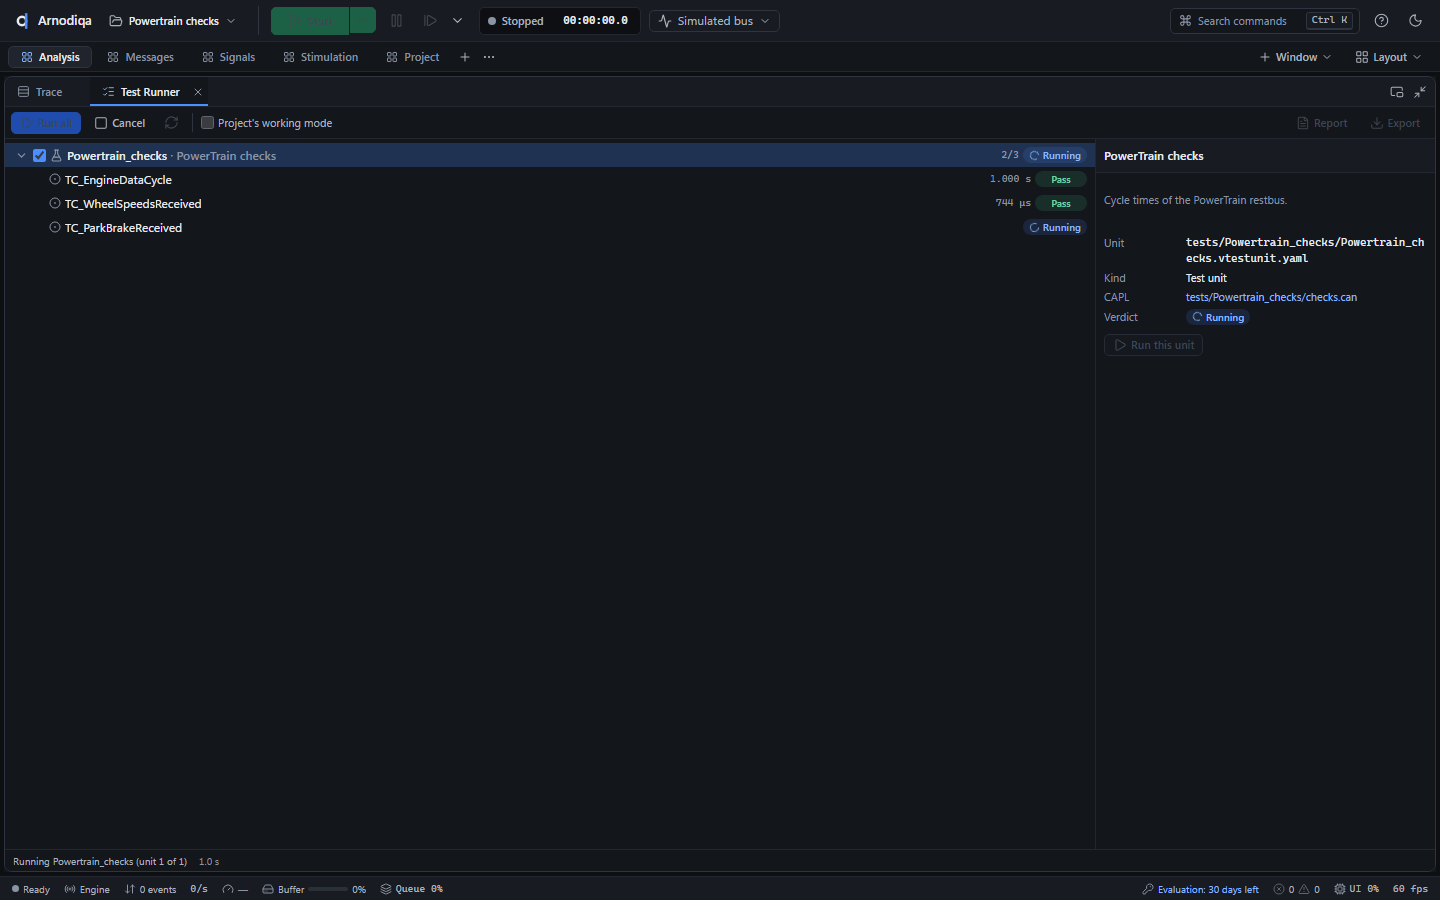
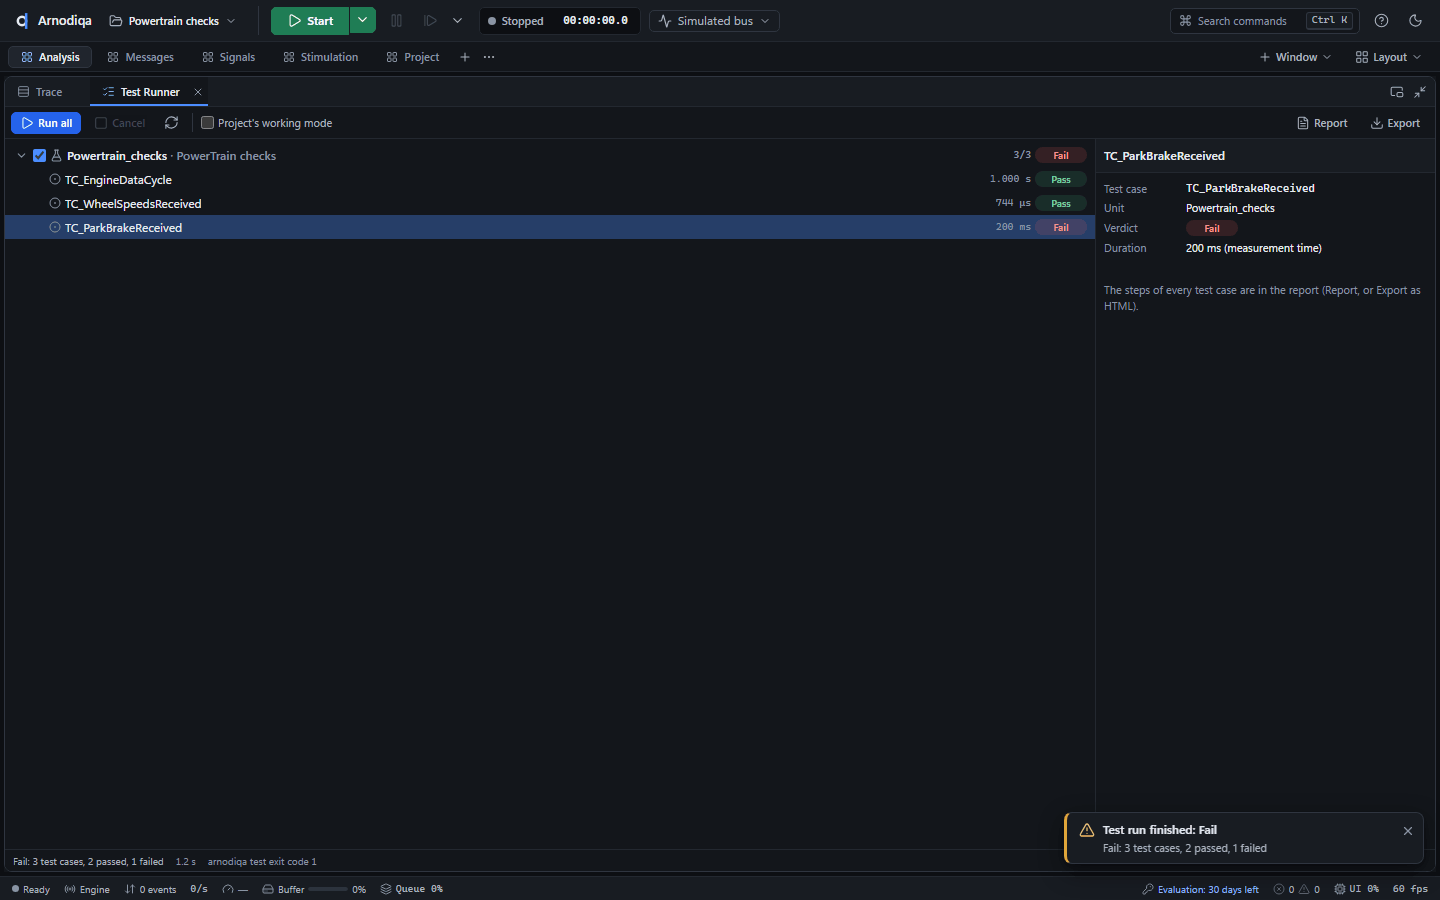
Na de run heeft elke testcase zijn verdict (Pass, Fail, Inconclusive, Error) en zijn duur in meettijd. Onderaan staan de samenvatting en de exitcode die
arnodiqa testvoor dezelfde uitkomst geeft, hier 1: minstens één testcase faalde.After the run each test case has its verdict (Pass, Fail, Inconclusive, Error) and its duration in measurement time. The bottom shows the summary and the exit code thatarnodiqa testreturns for the same outcome, here 1: at least one test case failed.Après l'exécution, chaque cas de test porte son verdict (Pass, Fail, Inconclusive, Error) et sa durée en temps de mesure. En bas figurent le résumé et le code de sortie quearnodiqa testrenvoie pour le même résultat, ici 1 : au moins un cas de test a échoué.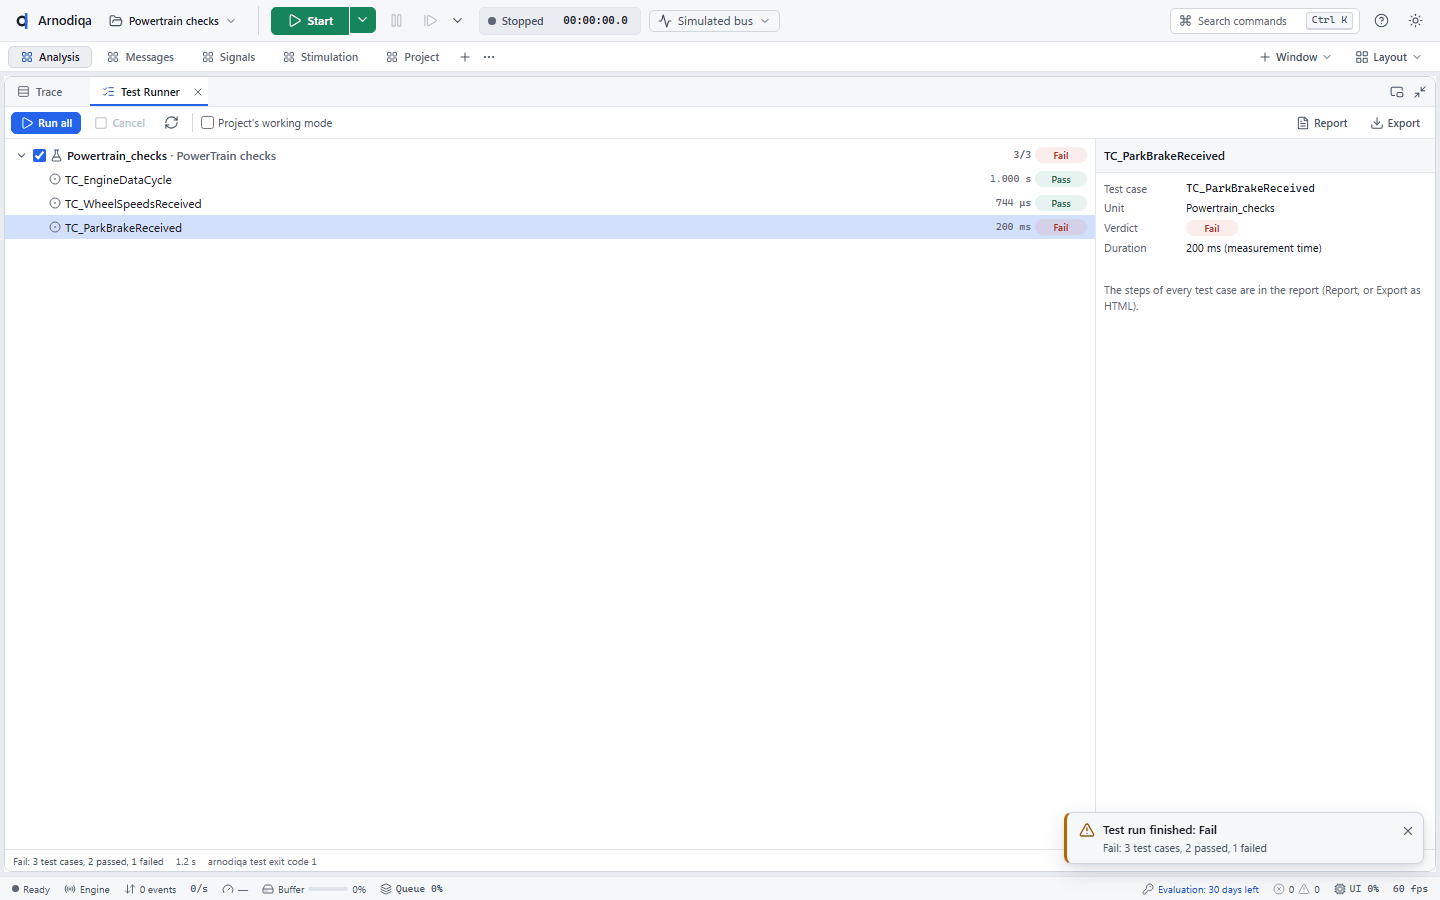
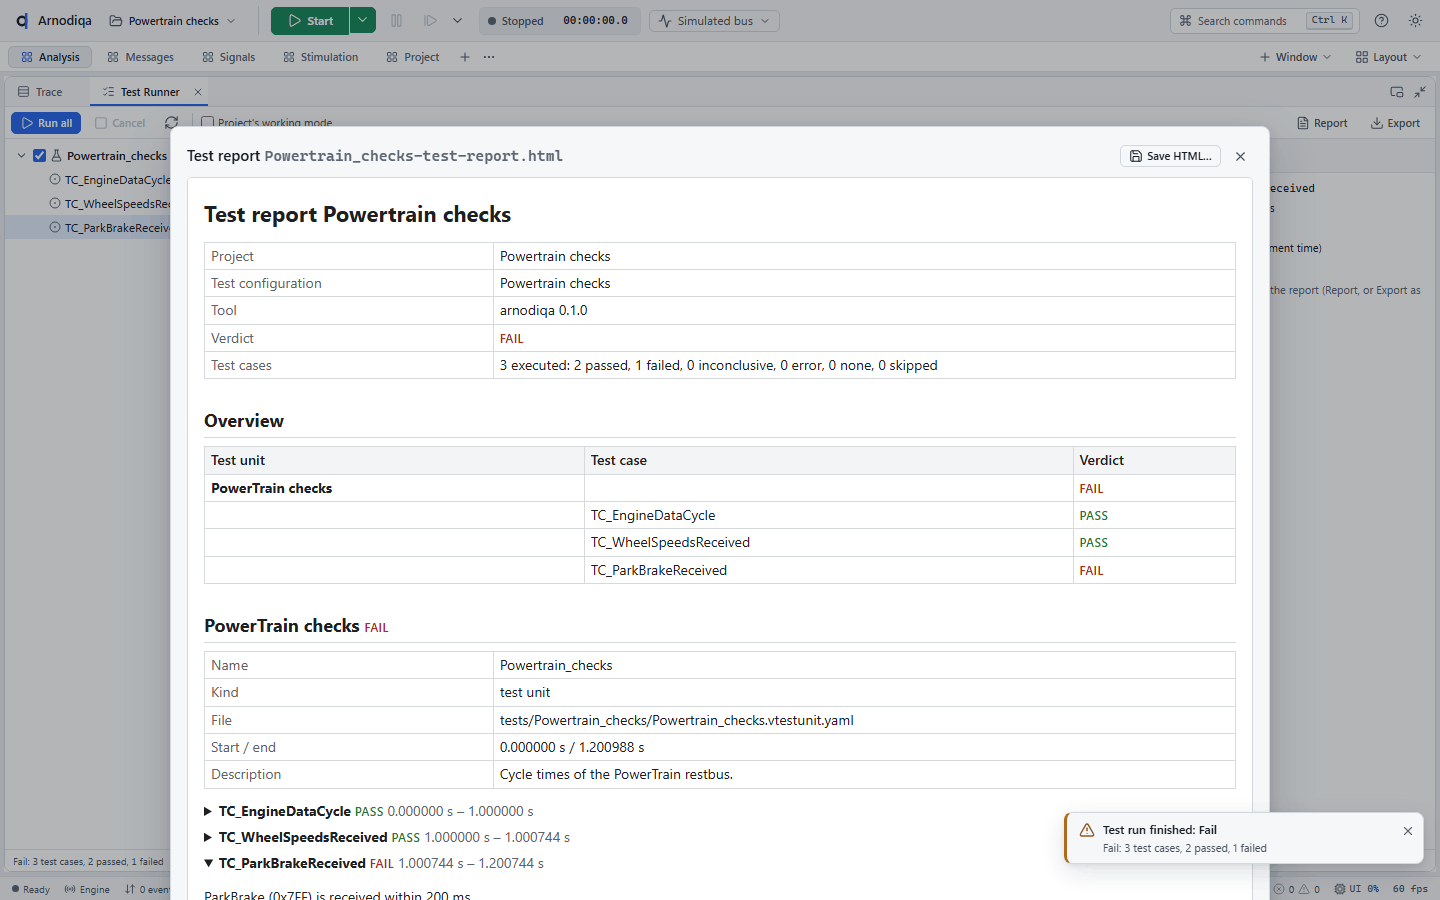
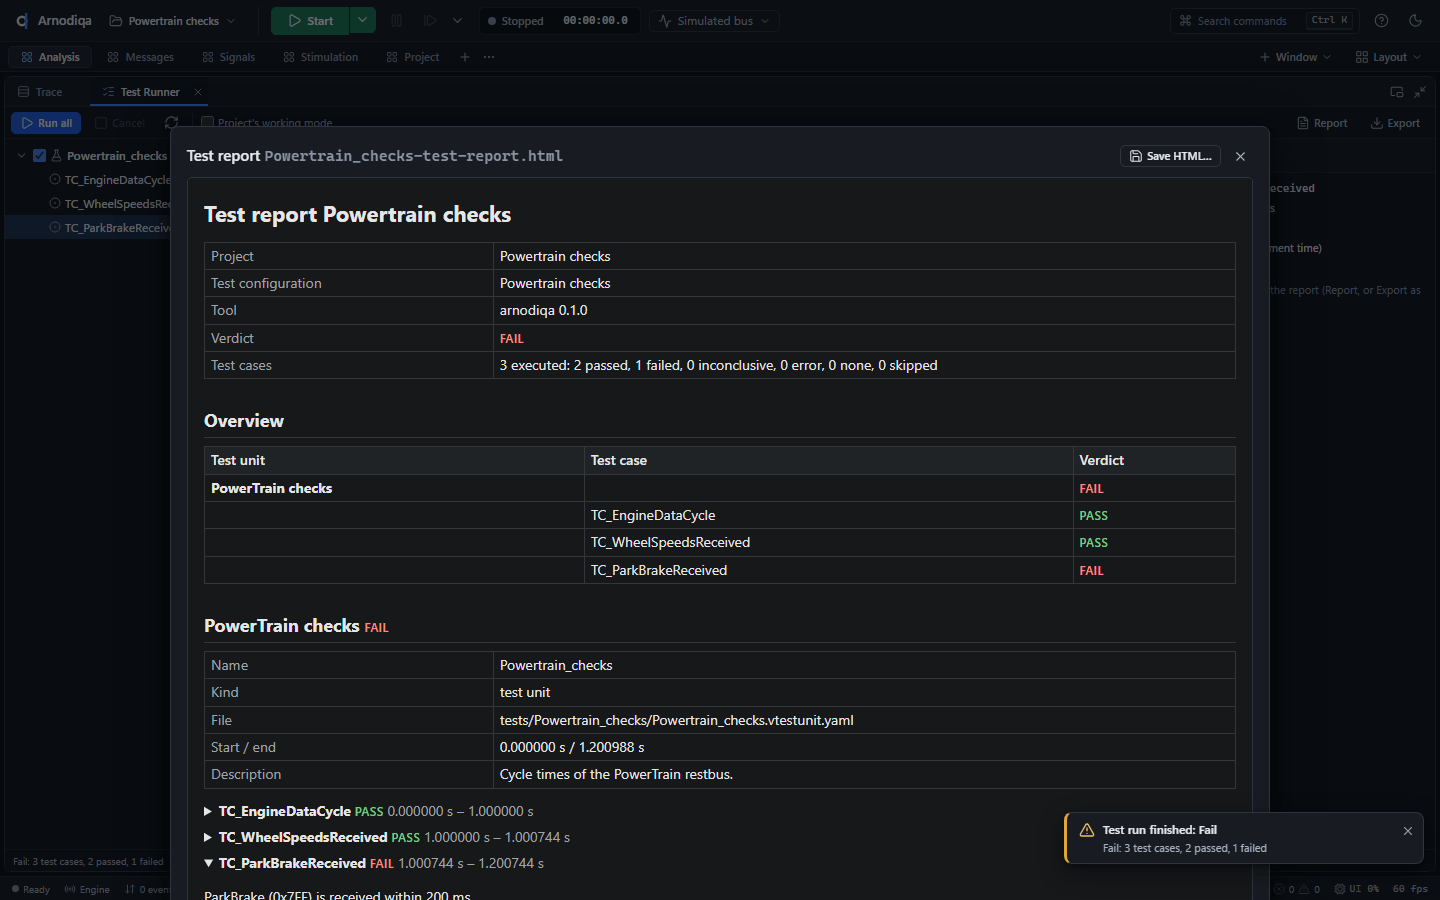
Klik op Report voor het HTML-rapport in de app: per unit de informatie en per testcase de stappen; gefaalde testcases staan open. Save HTML… bewaart het rapport.Click Report for the HTML report in the app: information per unit and the steps per test case; failed test cases are expanded. Save HTML… saves the report.Cliquez sur Report pour afficher le rapport HTML dans l'application, avec les informations de chaque unité et les étapes de chaque cas de test ; les cas de test en échec sont dépliés. Save HTML… enregistre le rapport.
Export bewaart het rapport als HTML, als JUnit XML voor een CI-server of als het canonieke JSON-rapport.Export saves the report as HTML, as JUnit XML for a CI server or as the canonical JSON report.Export enregistre le rapport en HTML, en JUnit XML pour un serveur CI ou au format JSON canonique.
LIN: schedule tables, slaves en LIN in de TraceLIN: schedule tables, slaves and LIN in the TraceLIN : schedule tables, esclaves et LIN dans la Trace
Een LIN-netwerk komt uit een LDF; Arnodiqa simuleert master en slaves en toont LIN-frames en busevents in de Trace.A LIN network comes from an LDF; Arnodiqa simulates master and slaves and shows LIN frames and bus events in the Trace.Un réseau LIN est défini par un fichier LDF ; Arnodiqa simule le maître et les esclaves et affiche les trames LIN et les événements de bus dans la Trace.
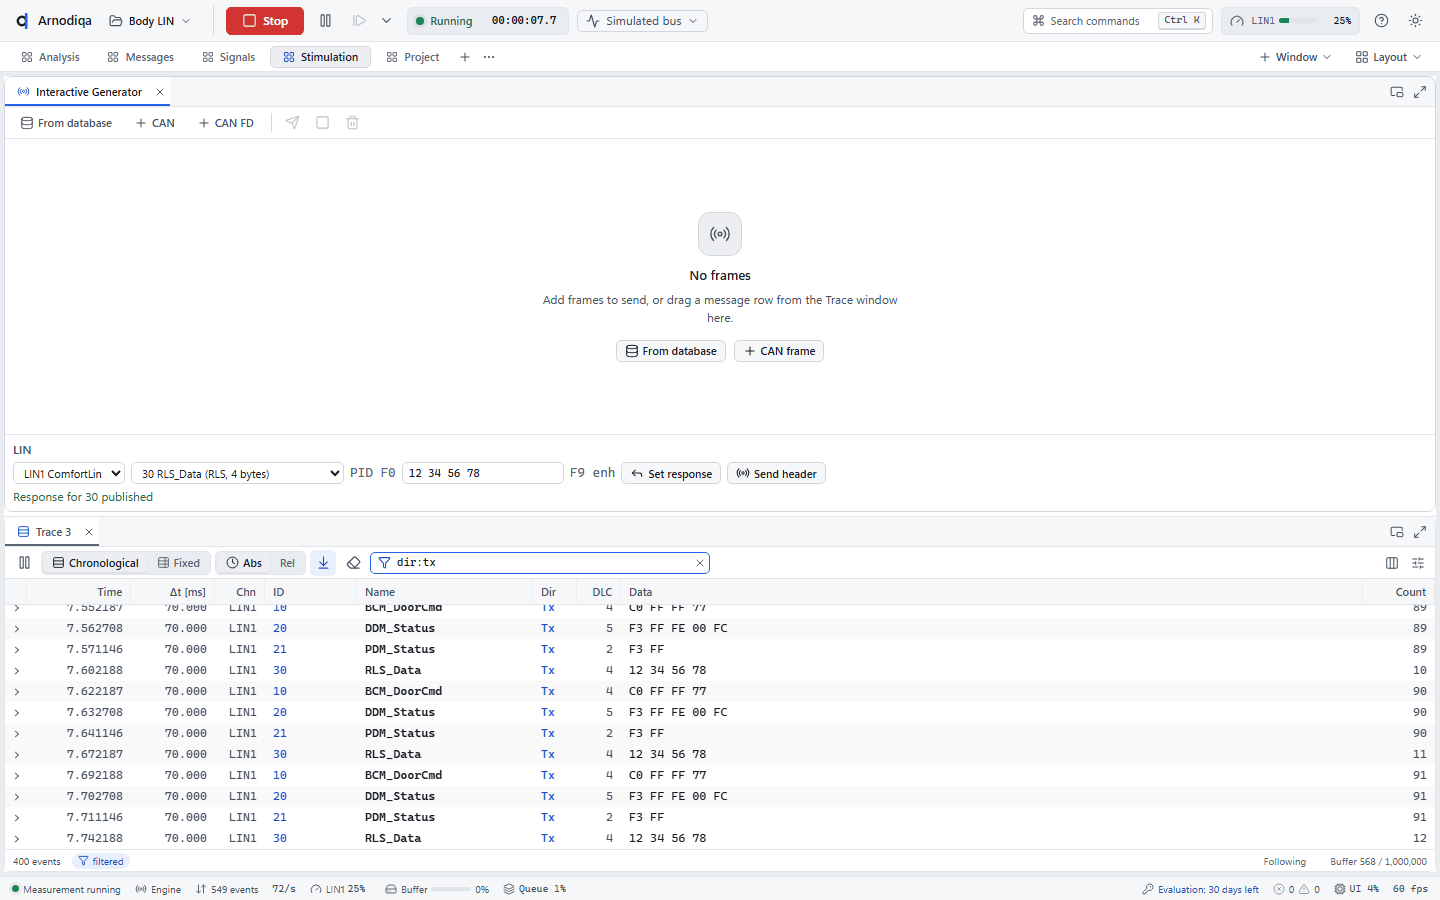
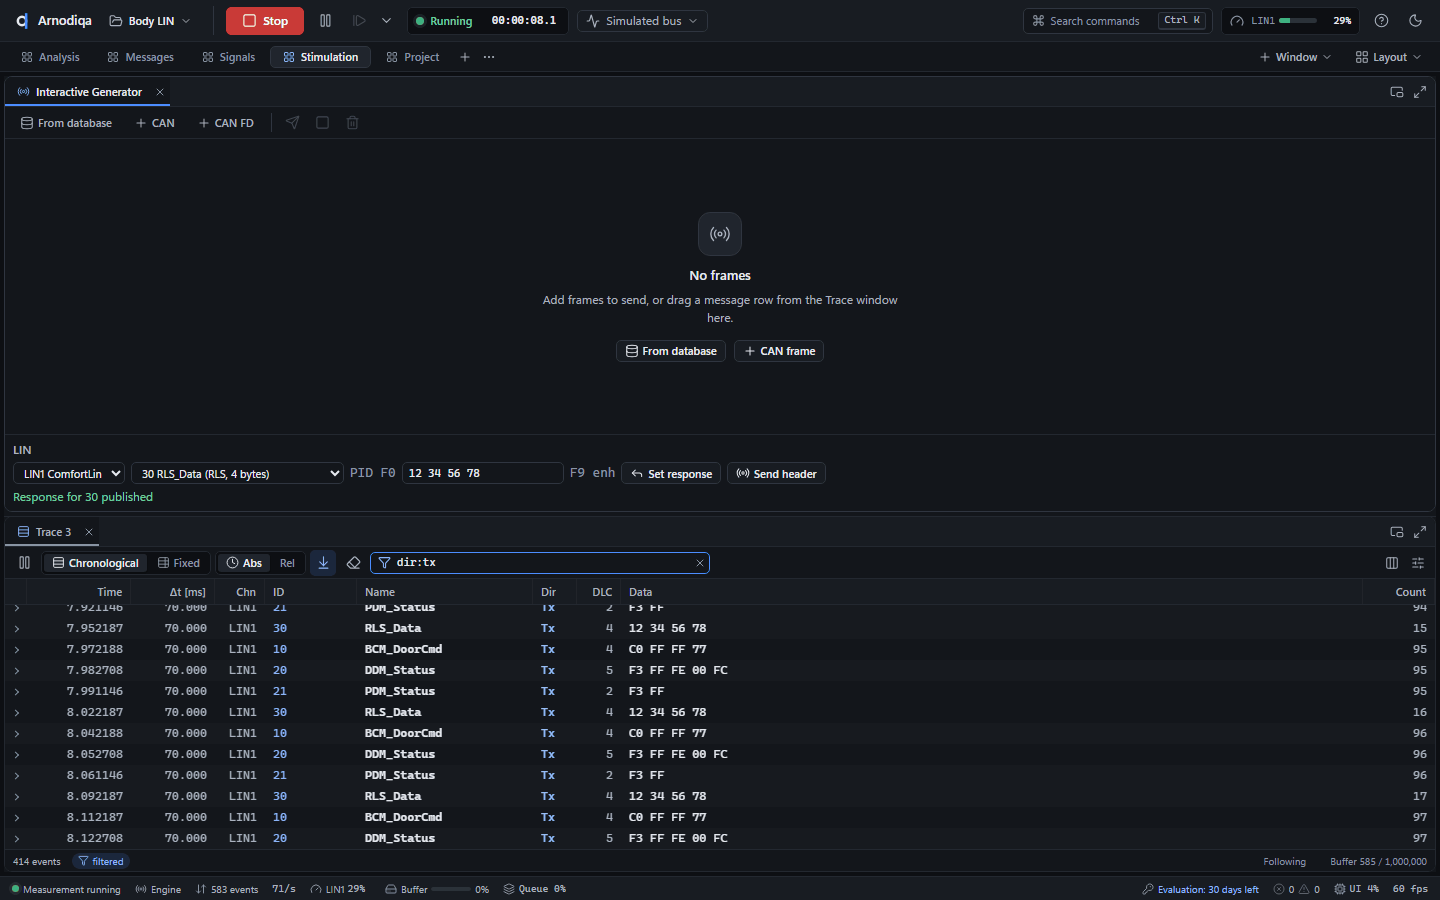
Project Body LIN uit het sjabloon LIN cluster. De projectverkenner toont het LIN-netwerk met baudrate, master, slaves en schedule tables; de Simulation Setup toont de LIN-nodes met hun rol (master of slave).Project Body LIN from the LIN cluster template. The project explorer shows the LIN network with baud rate, master, slaves and schedule tables; the simulation setup shows the LIN nodes with their role (master or slave).Projet Body LIN créé à partir du modèle LIN cluster. L'explorateur de projet affiche le réseau LIN avec son débit, son maître, ses esclaves et ses schedule tables ; le Simulation Setup affiche les nœuds LIN avec leur rôle (maître ou esclave).
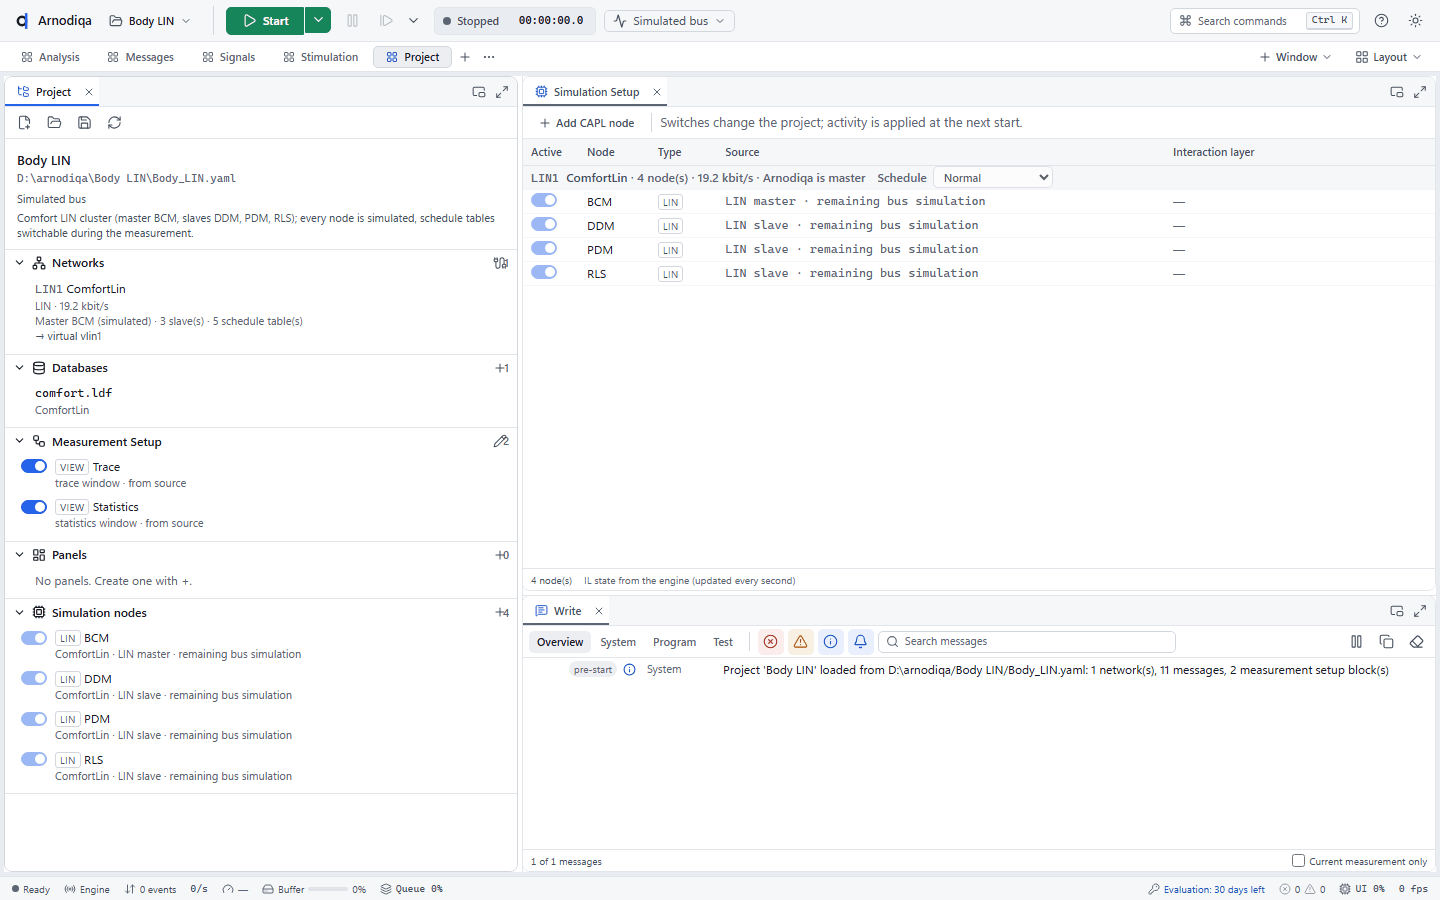
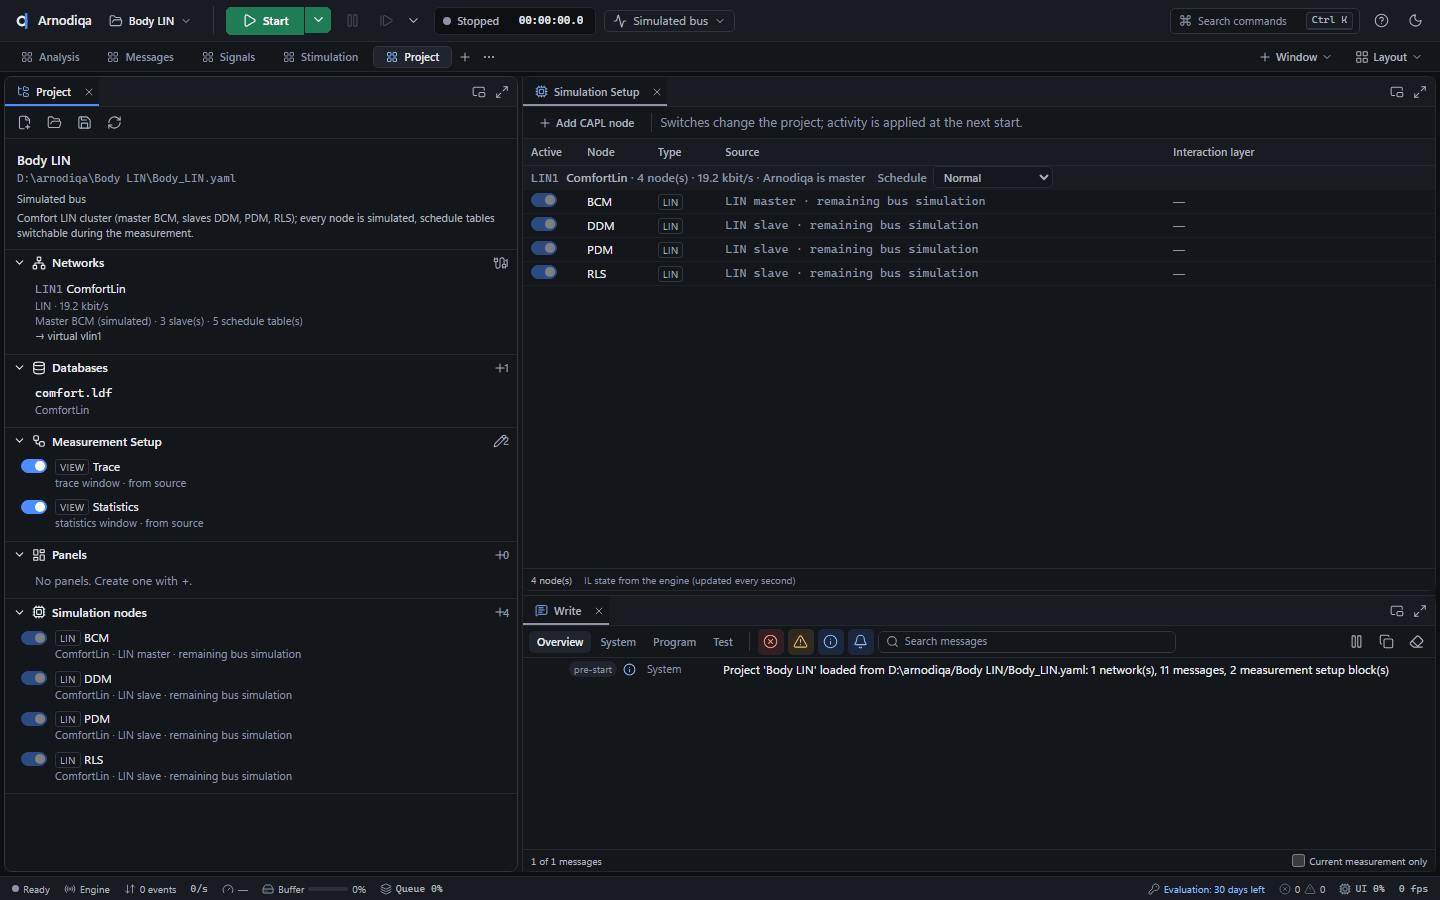
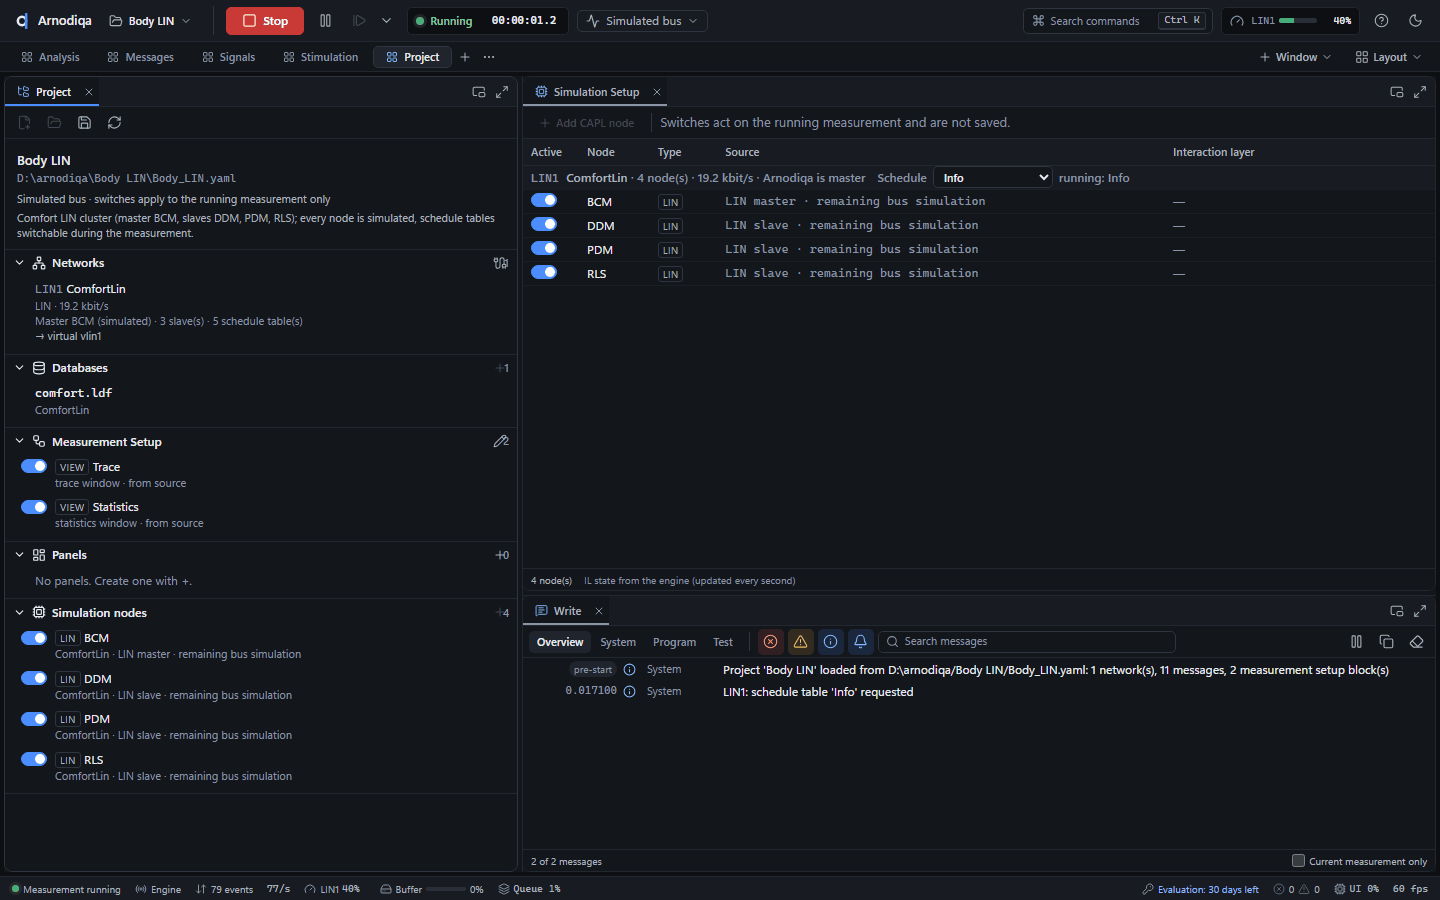
Start de meting en kies in de Simulation Setup bij het LIN-netwerk een andere schedule table. De wissel gebeurt aan het einde van de lopende table; de regel toont
running: ….Start the measurement and select another schedule table for the LIN network in the simulation setup. The switch takes place at the end of the running table; the row showsrunning: ….Démarrez la mesure et choisissez une autre schedule table pour le réseau LIN dans le Simulation Setup. Le changement a lieu à la fin de la table en cours ; la ligne afficherunning: ….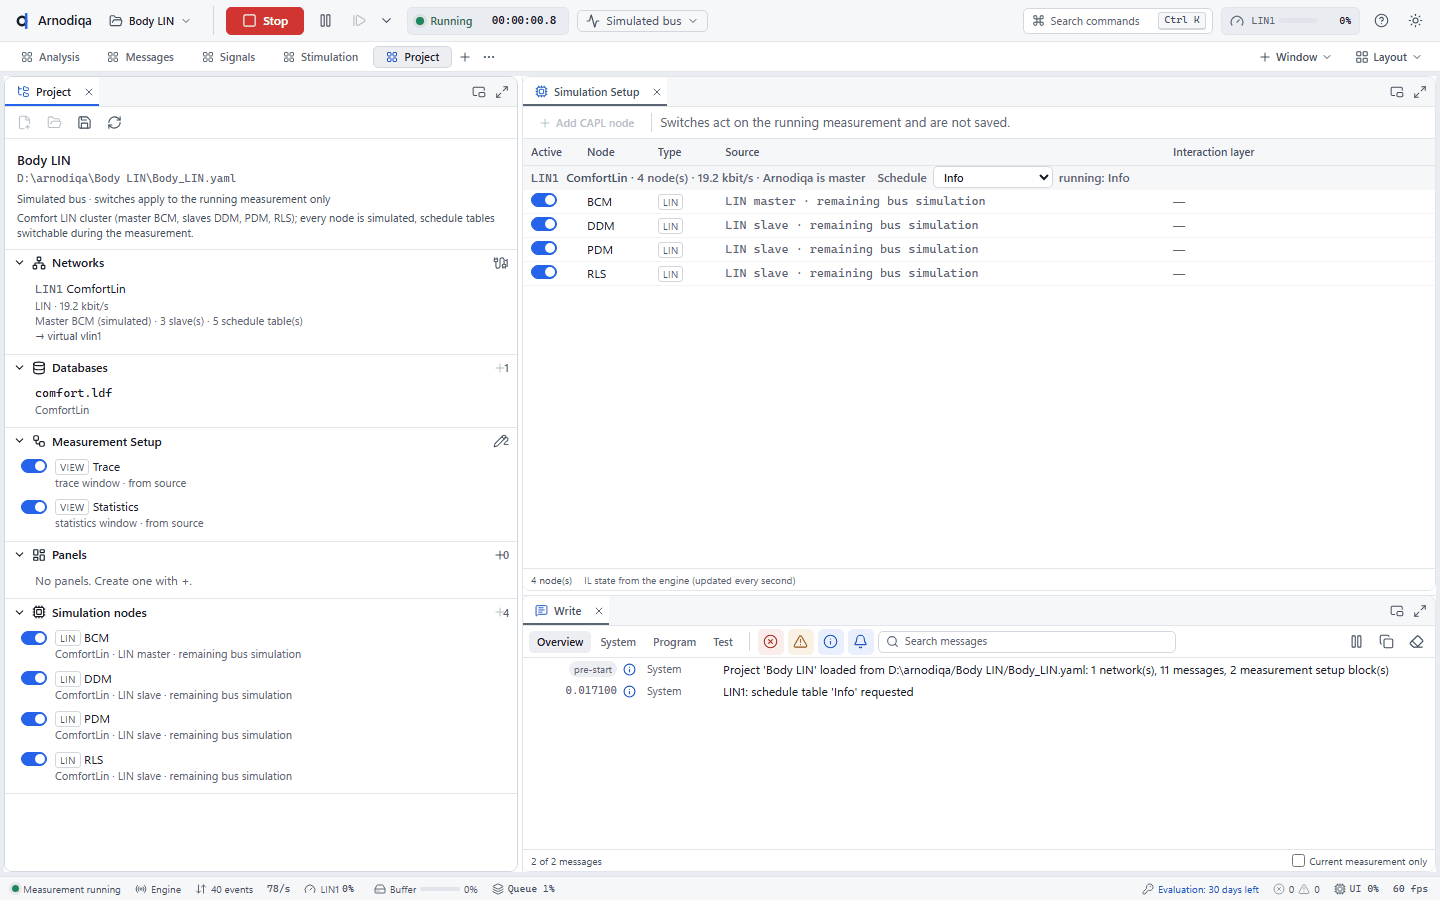
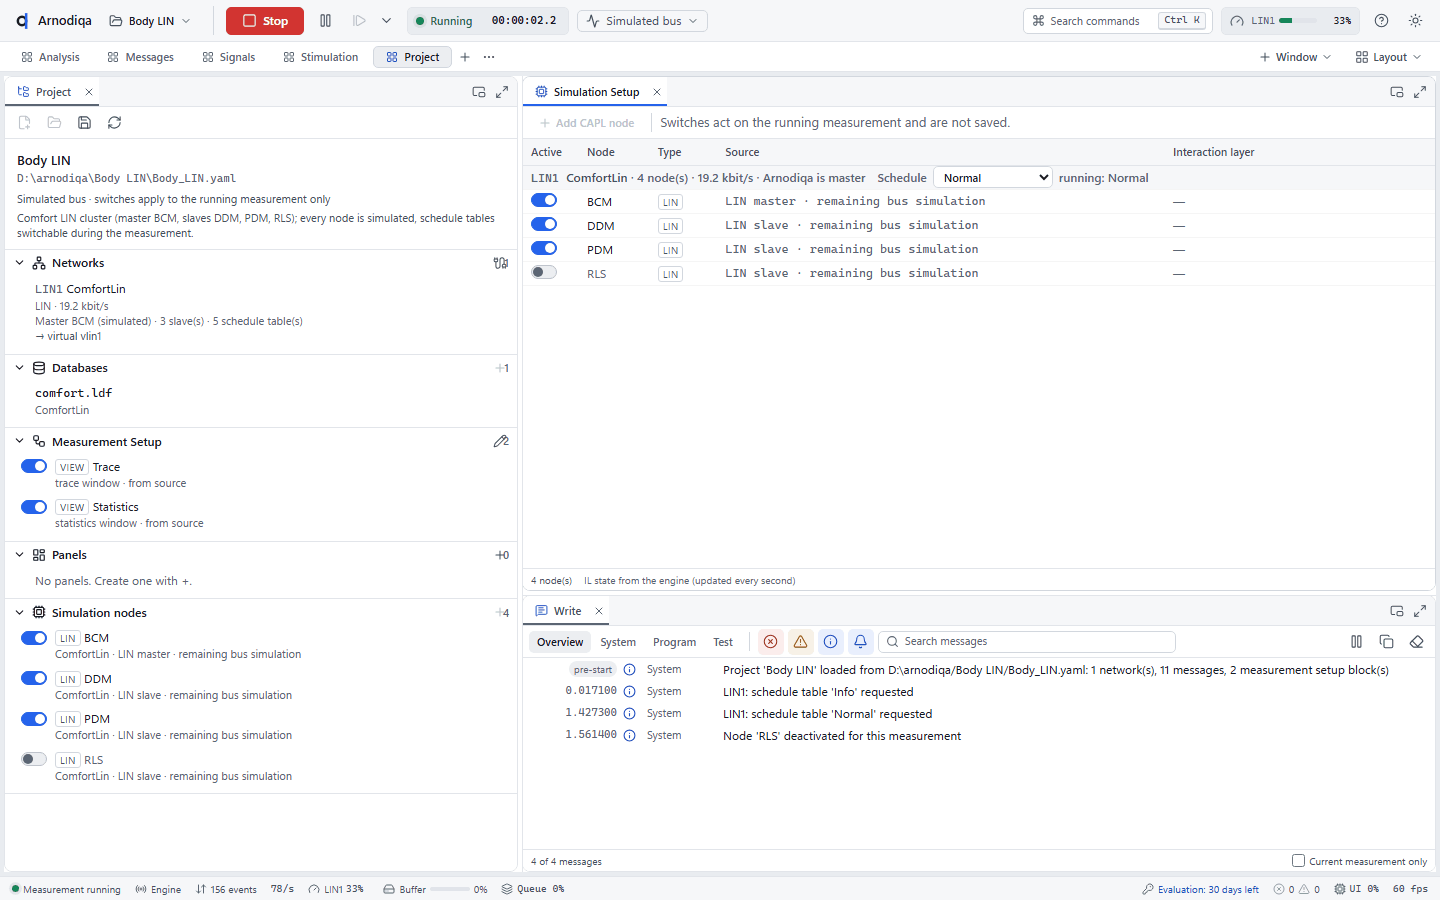
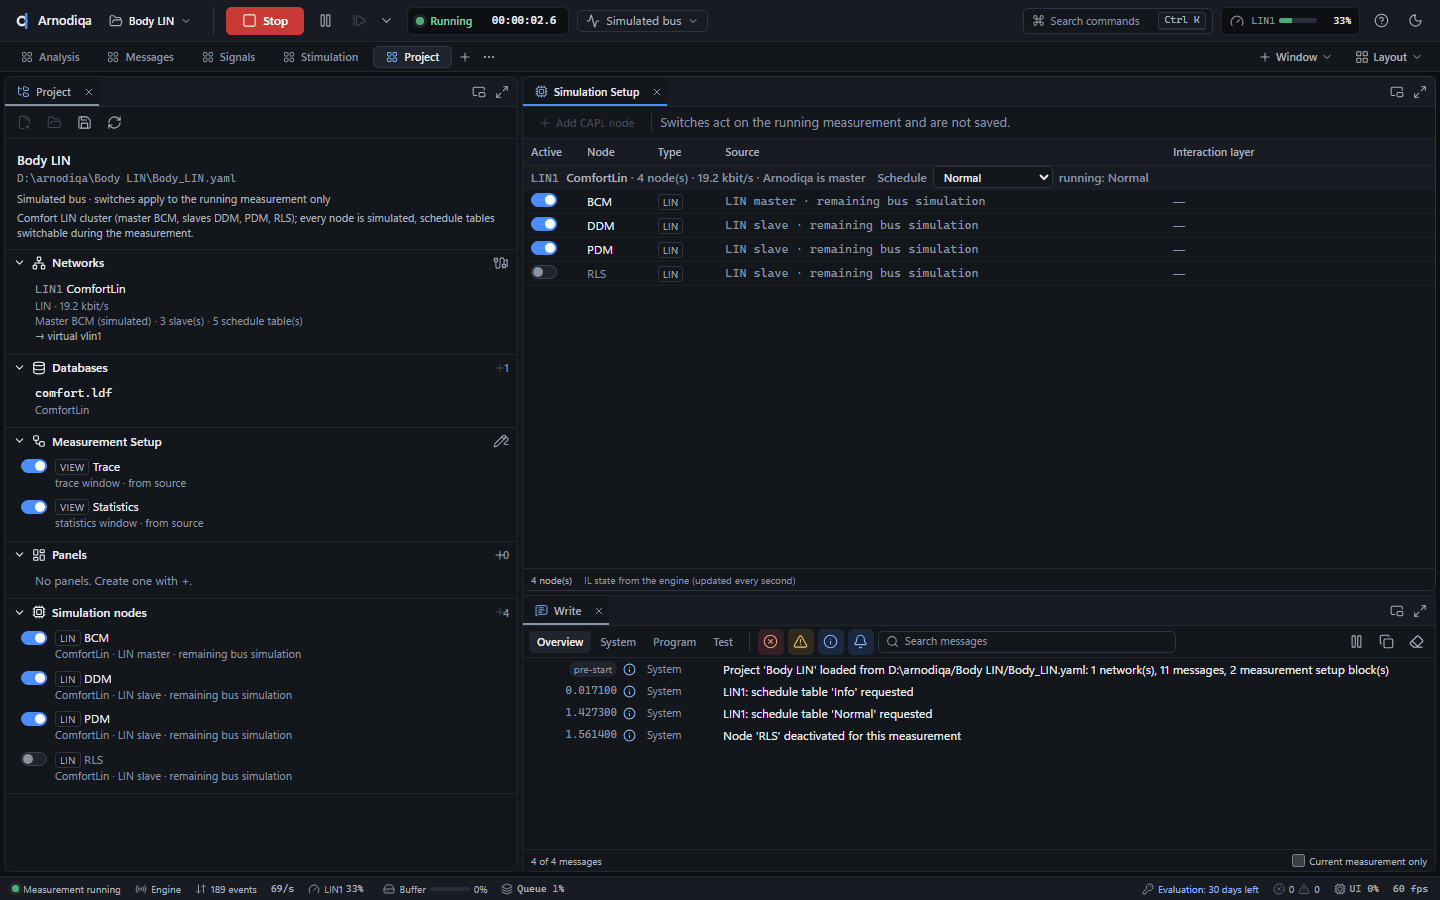
Elke slave uit het LDF is een gesimuleerde node. Zet een slave uit met de schakelaar in de kolom Active (hier RLS) om een echte ECU op die plaats te laten antwoorden. Tijdens de meting geldt dat alleen voor deze meting; Write meldt dan Node 'RLS' deactivated for this measurement.Every slave from the LDF is a simulated node. Turn a slave off with the switch in the Active column (here RLS) to let a real ECU respond in its place. During a measurement this applies to that measurement only; Write then reports Node 'RLS' deactivated for this measurement.Chaque esclave du LDF est un nœud simulé. Désactivez un esclave avec l'interrupteur de la colonne Active (ici RLS) pour laisser un vrai calculateur répondre à sa place. Pendant une mesure, ce réglage ne vaut que pour cette mesure ; Write affiche alors Node 'RLS' deactivated for this measurement.
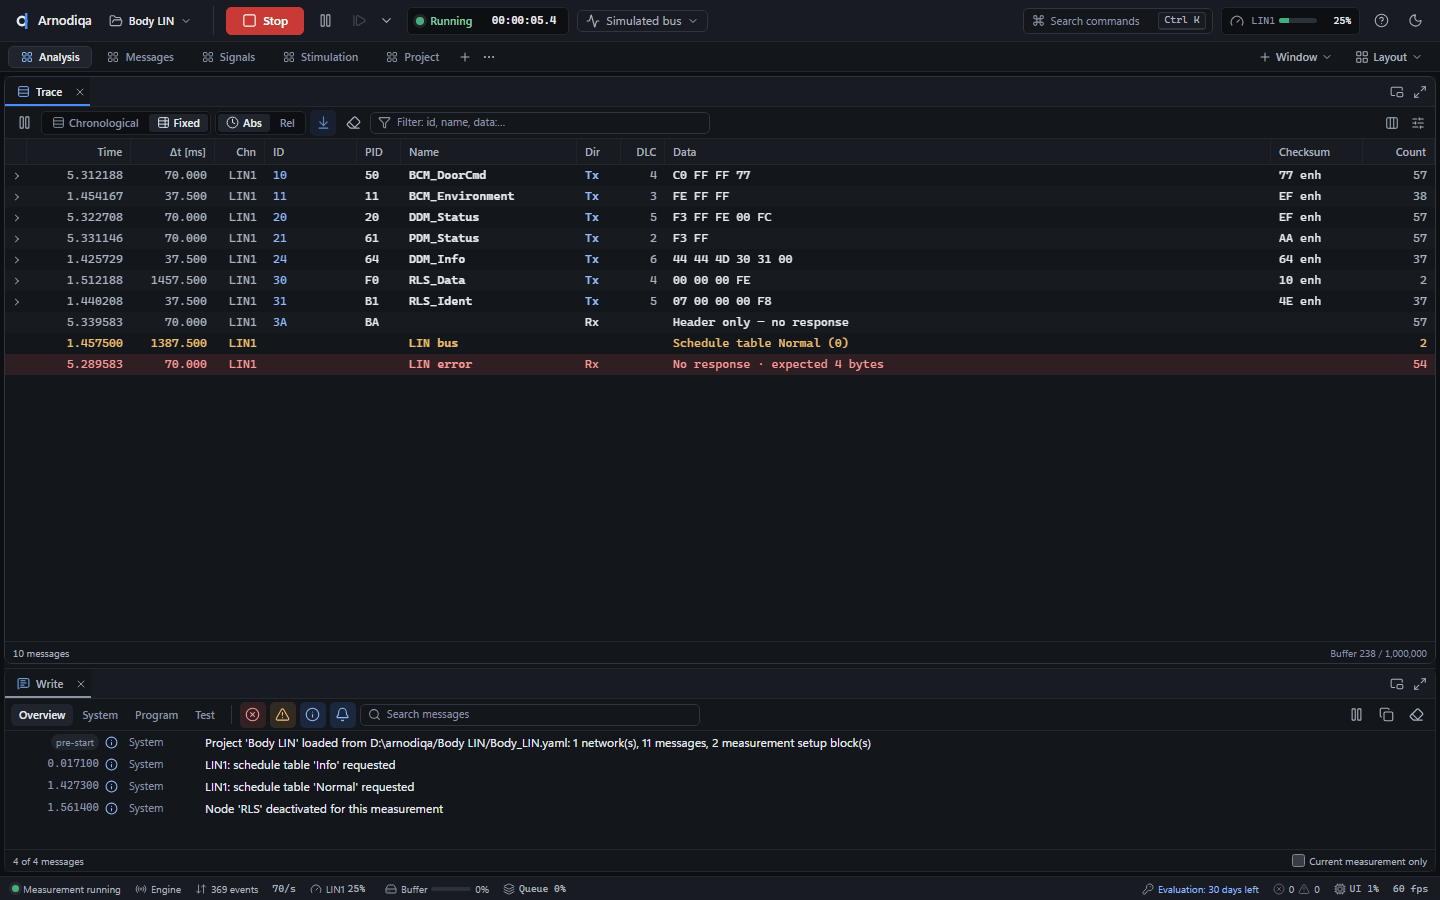
In de Trace staan LIN-frames met kanaal LIN1. Via Columns zet je de kolommen PID en Checksum aan. Filters:
bus:lin,type:lin,type:linerror(fouten) entype:linbus(wake-up, sleep, schedulewissel).The Trace shows LIN frames on channel LIN1. Use Columns to enable the PID and Checksum columns. Filters:bus:lin,type:lin,type:linerror(errors) andtype:linbus(wake-up, sleep, schedule change).La Trace affiche les trames LIN sur le canal LIN1. Columns permet d'afficher les colonnes PID et Checksum. Filtres :bus:lin,type:lin,type:linerror(erreurs) ettype:linbus(réveil, mise en veille, changement de schedule table).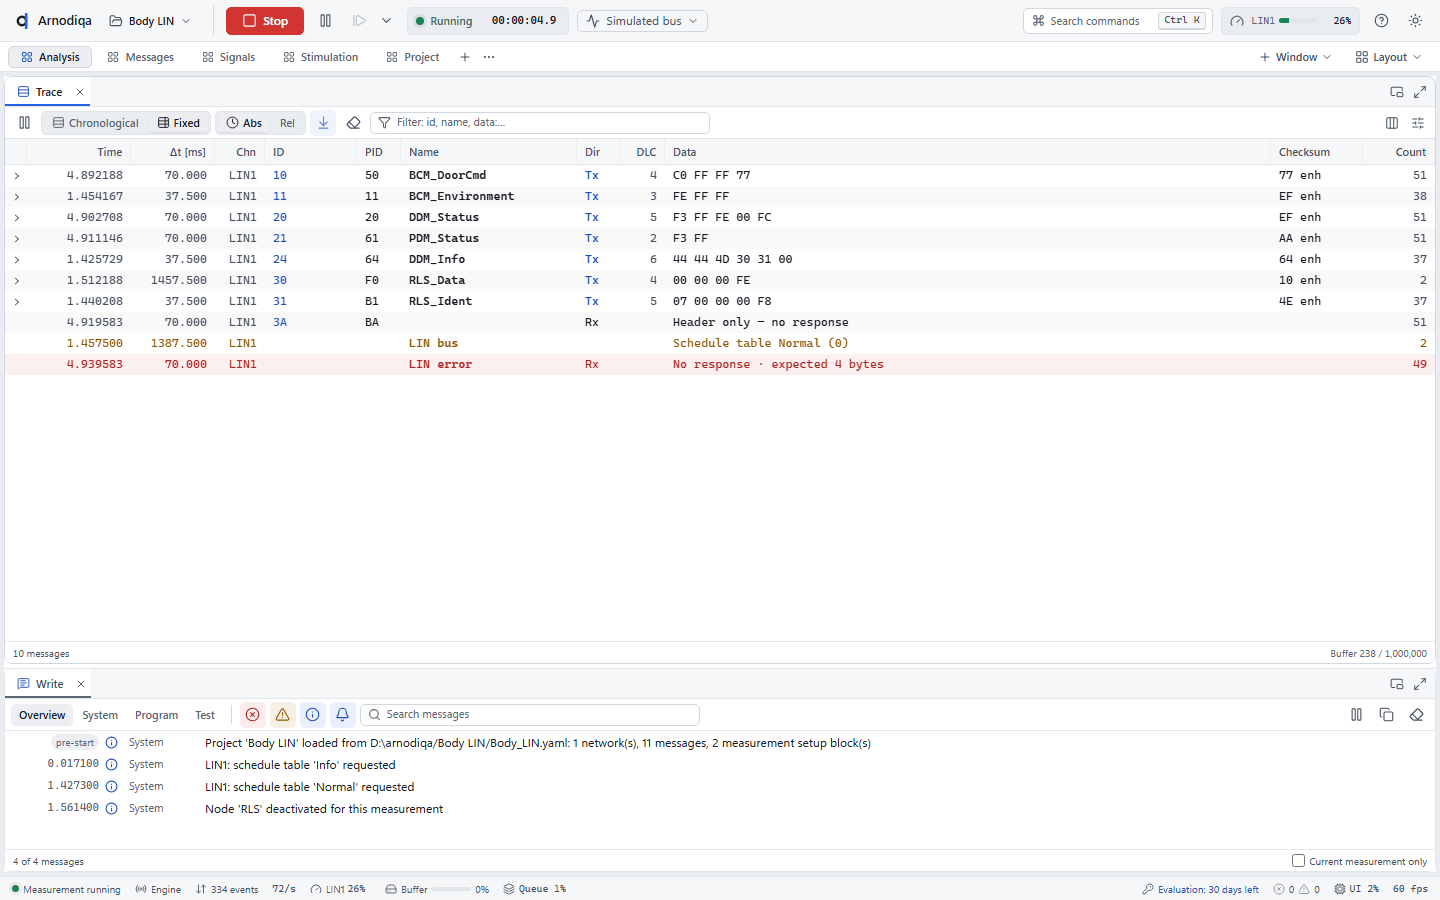
In Chronological toont het filter
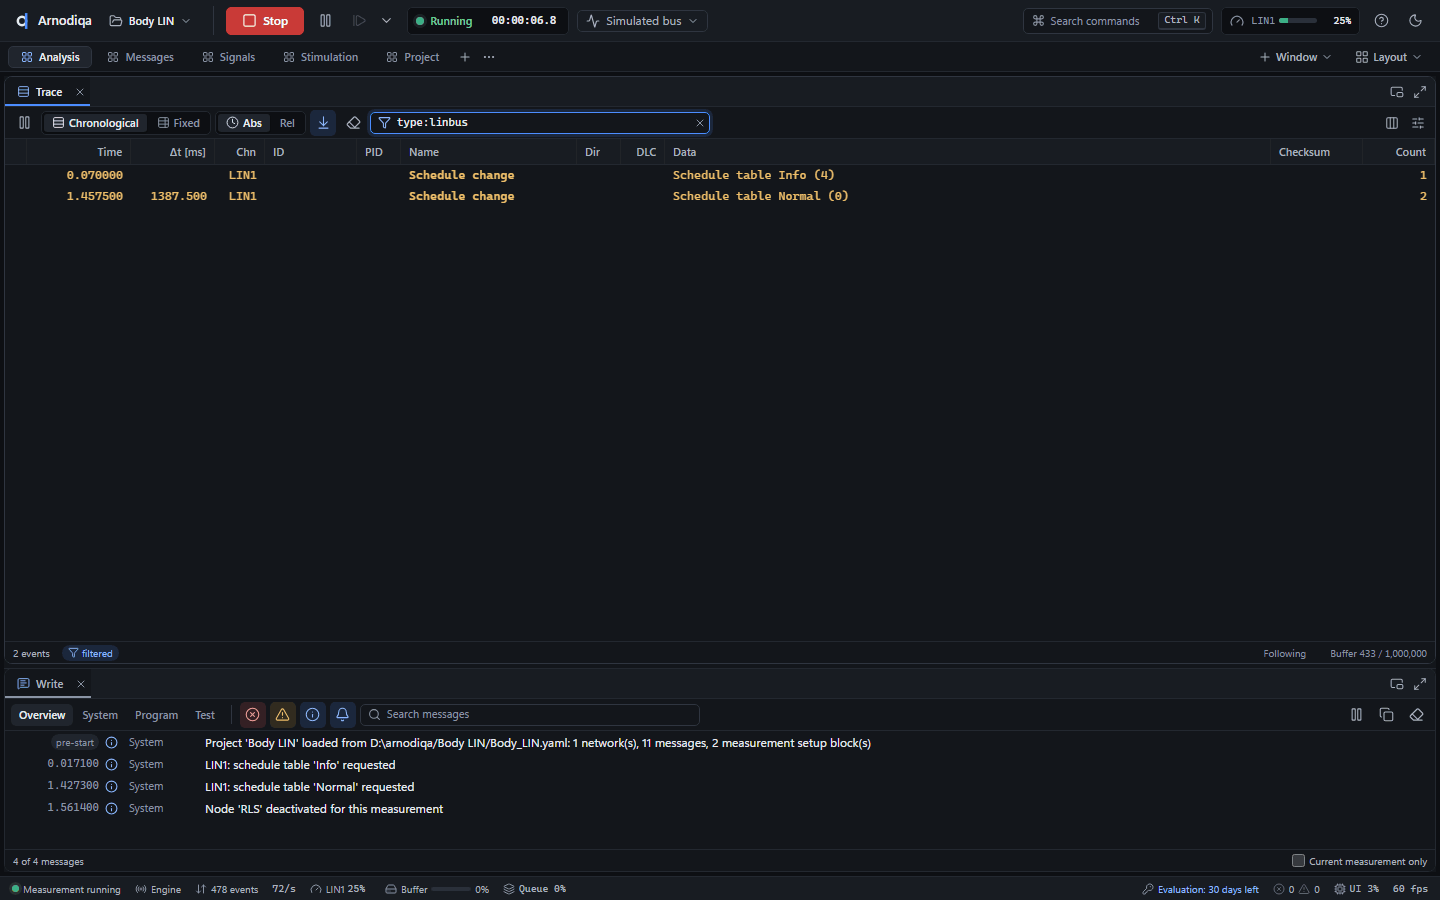
type:linbusde busevents: hier de wissels van schedule table, en verder wake-up en sleep.type:linerrortoont foutregels zoals No response of Checksum error.In Chronological mode the filtertype:linbusshows the bus events: here the schedule table changes, and further wake-up and sleep.type:linerrorshows error rows such as No response or Checksum error.En mode Chronological, le filtretype:linbusaffiche les événements de bus : ici les changements de schedule table, ainsi que le réveil et la mise en veille.type:linerroraffiche les lignes d'erreur telles que No response ou Checksum error.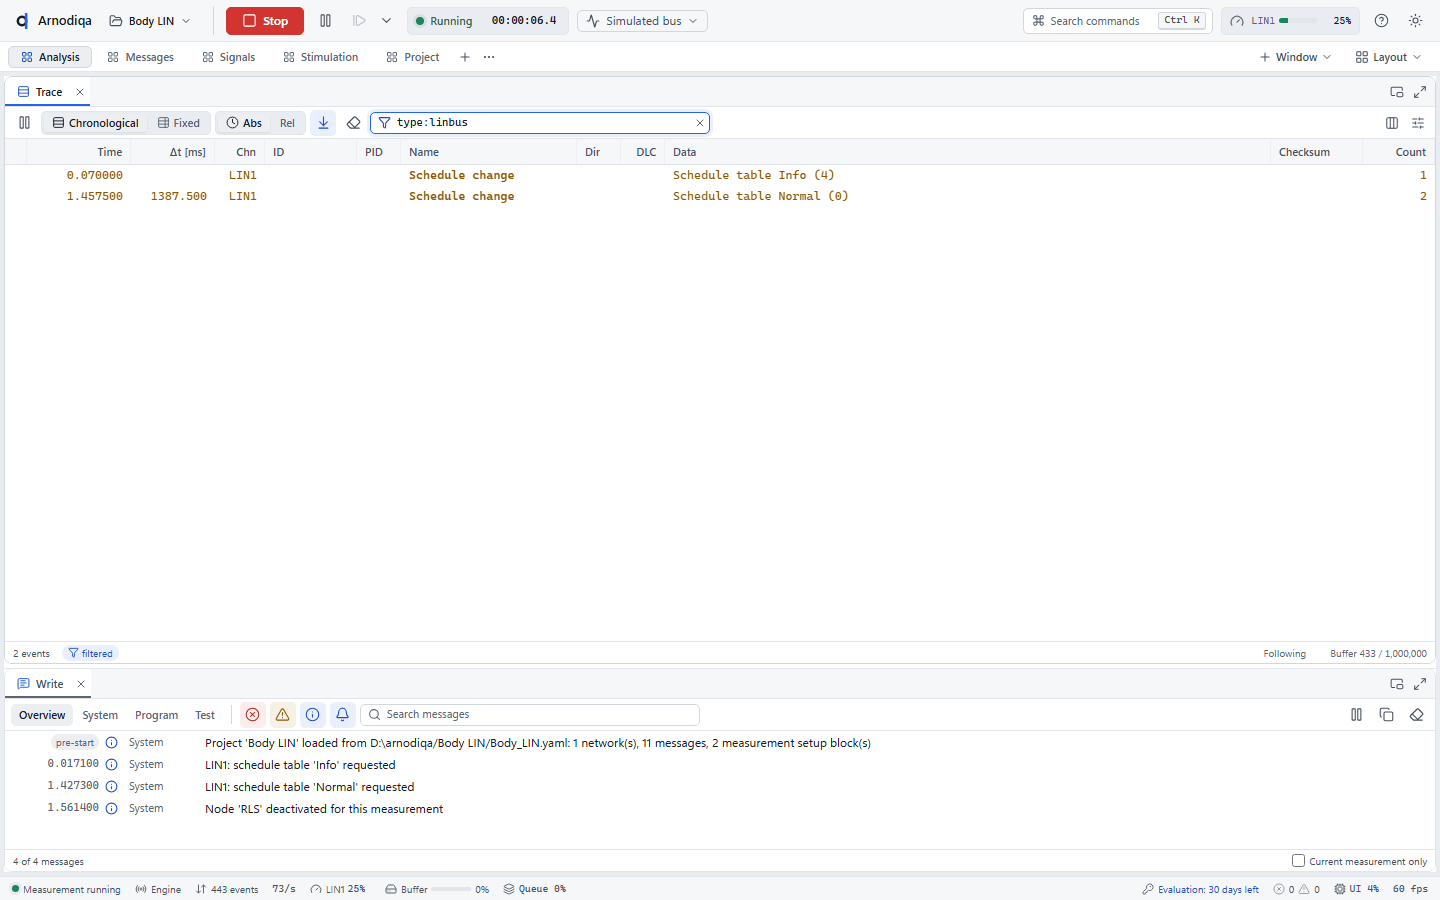
In de Interactive Generator op de desktop Stimulation kies je in de LIN-sectie een frame uit het LDF. Set response publiceert de response als slave, Send header zendt de header als master.In the Interactive Generator on the Stimulation desktop, select a frame from the LDF in the LIN section. Set response publishes the response as slave, Send header sends the header as master.Dans l'Interactive Generator du desktop Stimulation, sélectionnez une trame du LDF dans la section LIN. Set response publie la réponse en tant qu'esclave, Send header envoie l'en-tête en tant que maître.
J1939 Monitor en DTC'sJ1939 Monitor and DTCsJ1939 Monitor et DTC
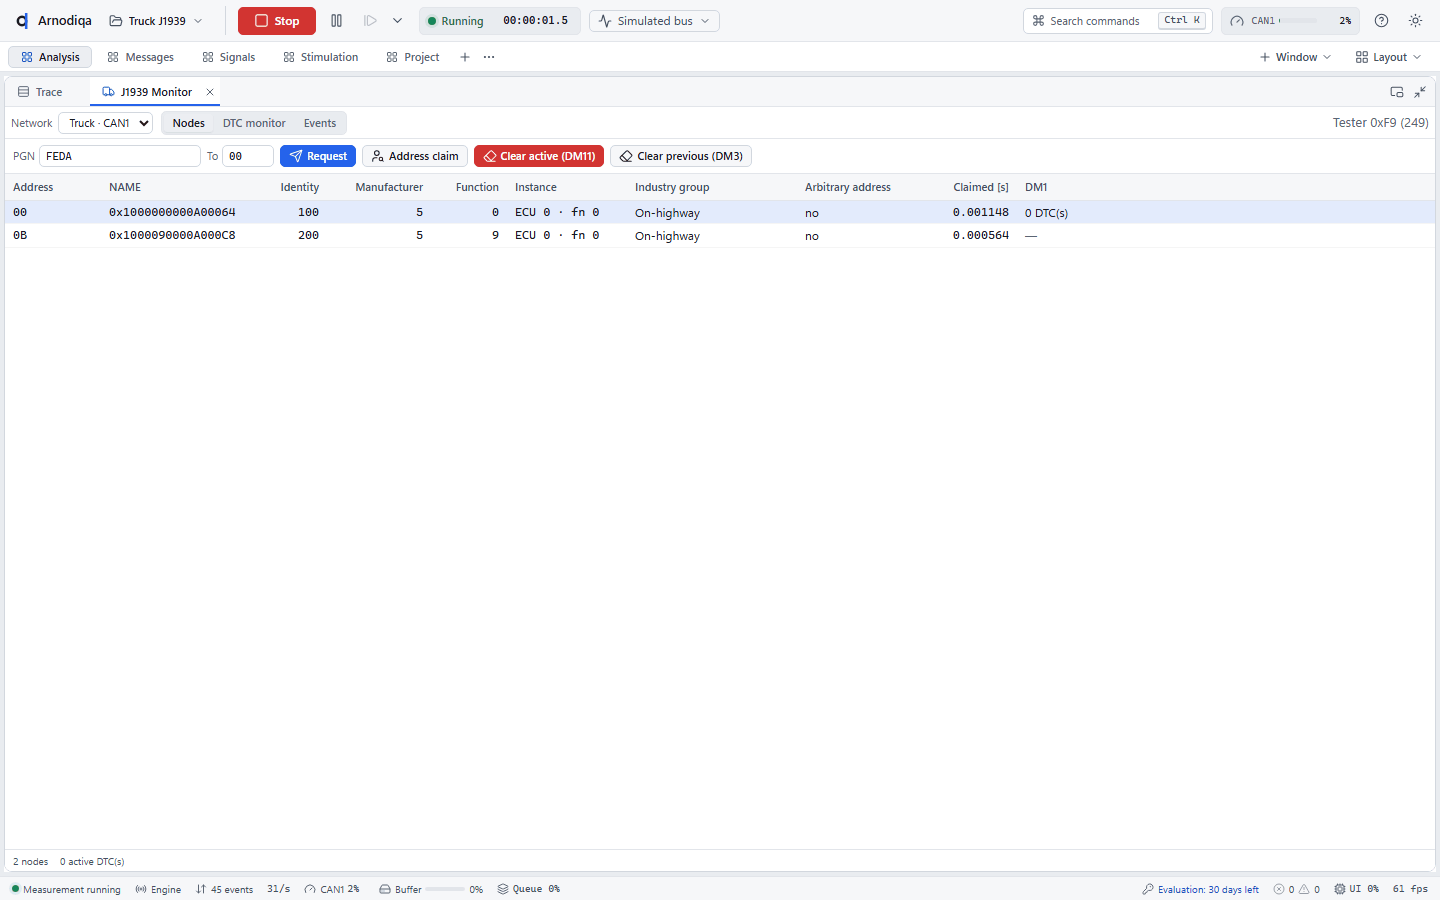
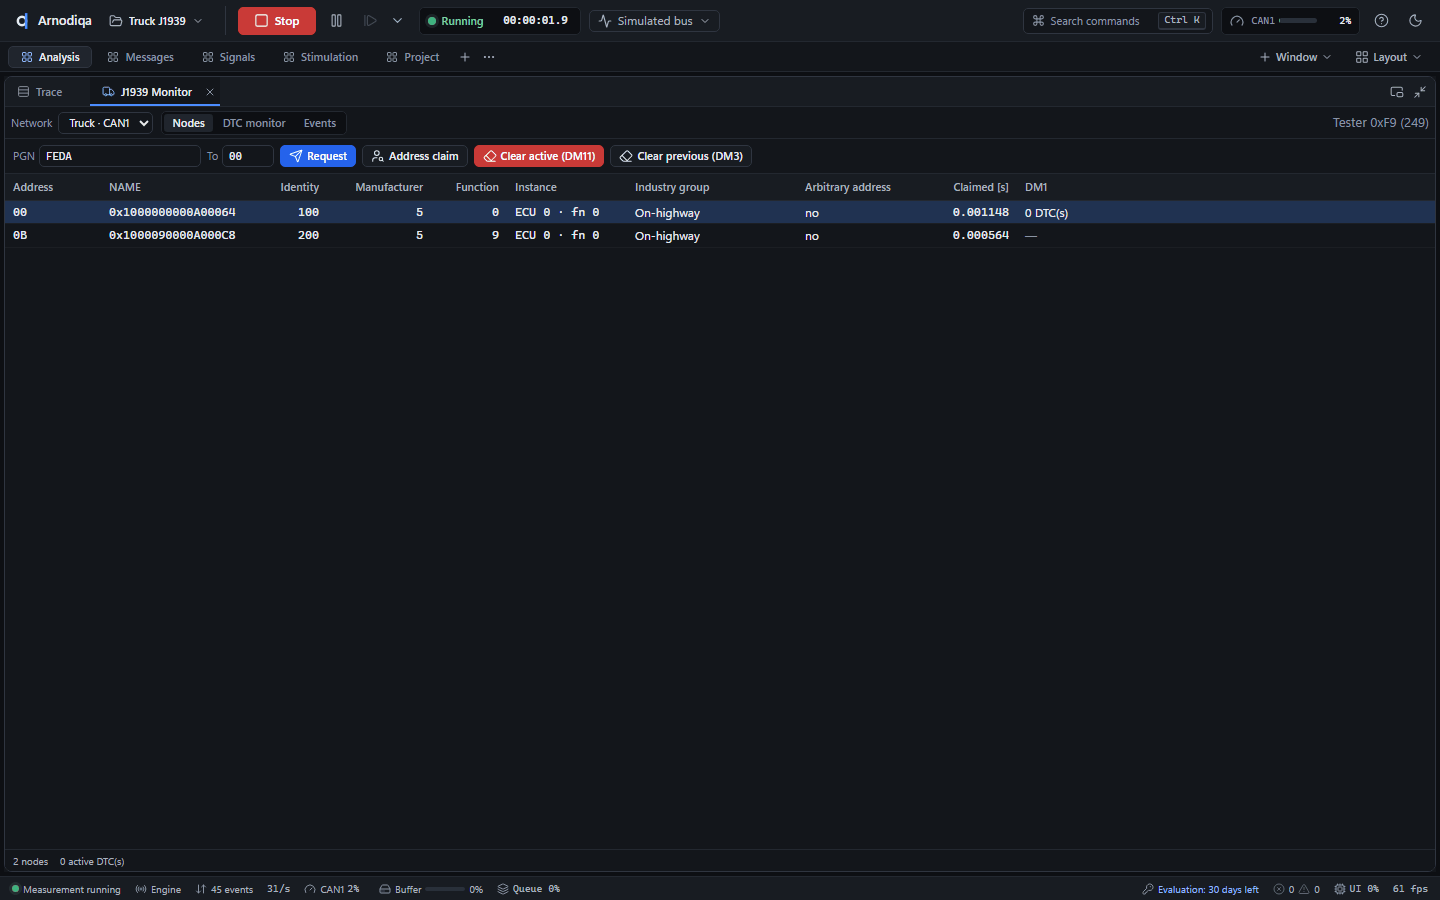
De J1939 Monitor toont de nodes op een J1939-netwerk, hun actieve foutcodes en het verloop van claims en transporten.The J1939 Monitor shows the nodes on a J1939 network, their active fault codes and the sequence of claims and transfers.Le J1939 Monitor affiche les nœuds d'un réseau J1939, leurs codes de défaut actifs et la séquence des revendications d'adresse (address claims) et des transferts.
Open de J1939 Monitor (Ctrl+K, New J1939 Monitor window) en start de meting. Het tabblad Nodes toont per adres de NAME met zijn velden, de tijd van de address claim en een DM1-samenvatting.Open the J1939 Monitor (Ctrl+K, New J1939 Monitor window) and start the measurement. The Nodes tab shows, per address, the NAME with its fields, the time of the address claim and a DM1 summary.Ouvrez le J1939 Monitor (Ctrl+K, New J1939 Monitor window) et démarrez la mesure. L'onglet Nodes affiche pour chaque adresse le NAME avec ses champs, l'instant de l'address claim et un résumé DM1.
Het tabblad DTC monitor toont per node de lampen (MIL, RSL, AWL, PL) en de actieve DTC's uit DM1: SPN, FMI met tekst en de occurrence count.The DTC monitor tab shows the lamps (MIL, RSL, AWL, PL) of each node and the active DTCs from DM1: SPN, FMI with text and the occurrence count.L'onglet DTC monitor affiche les témoins (MIL, RSL, AWL, PL) de chaque nœud et les DTC actifs issus de DM1 : SPN, FMI avec son texte et l'occurrence count.
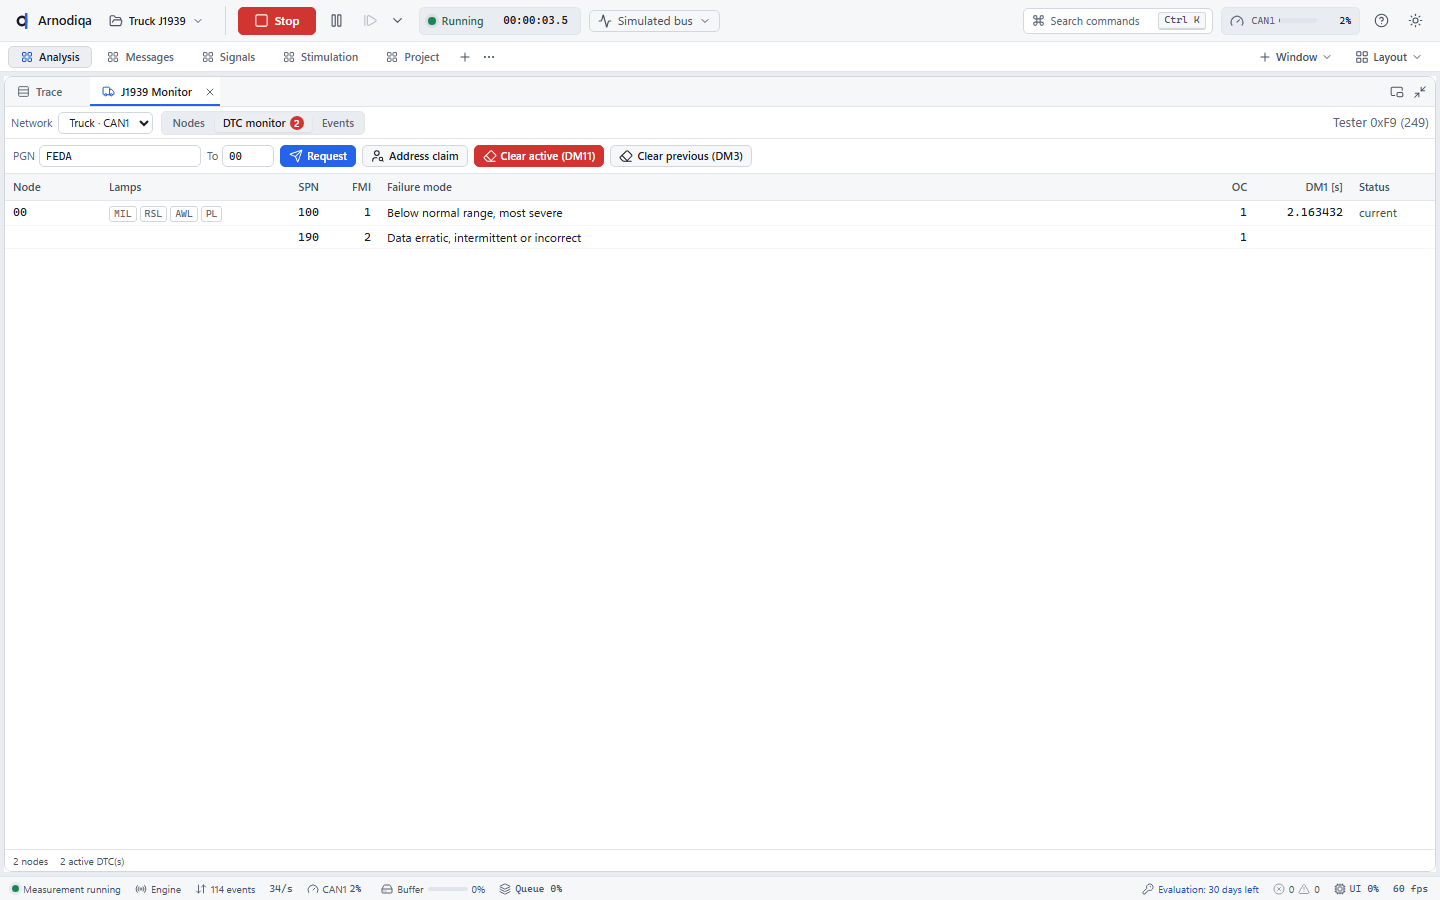
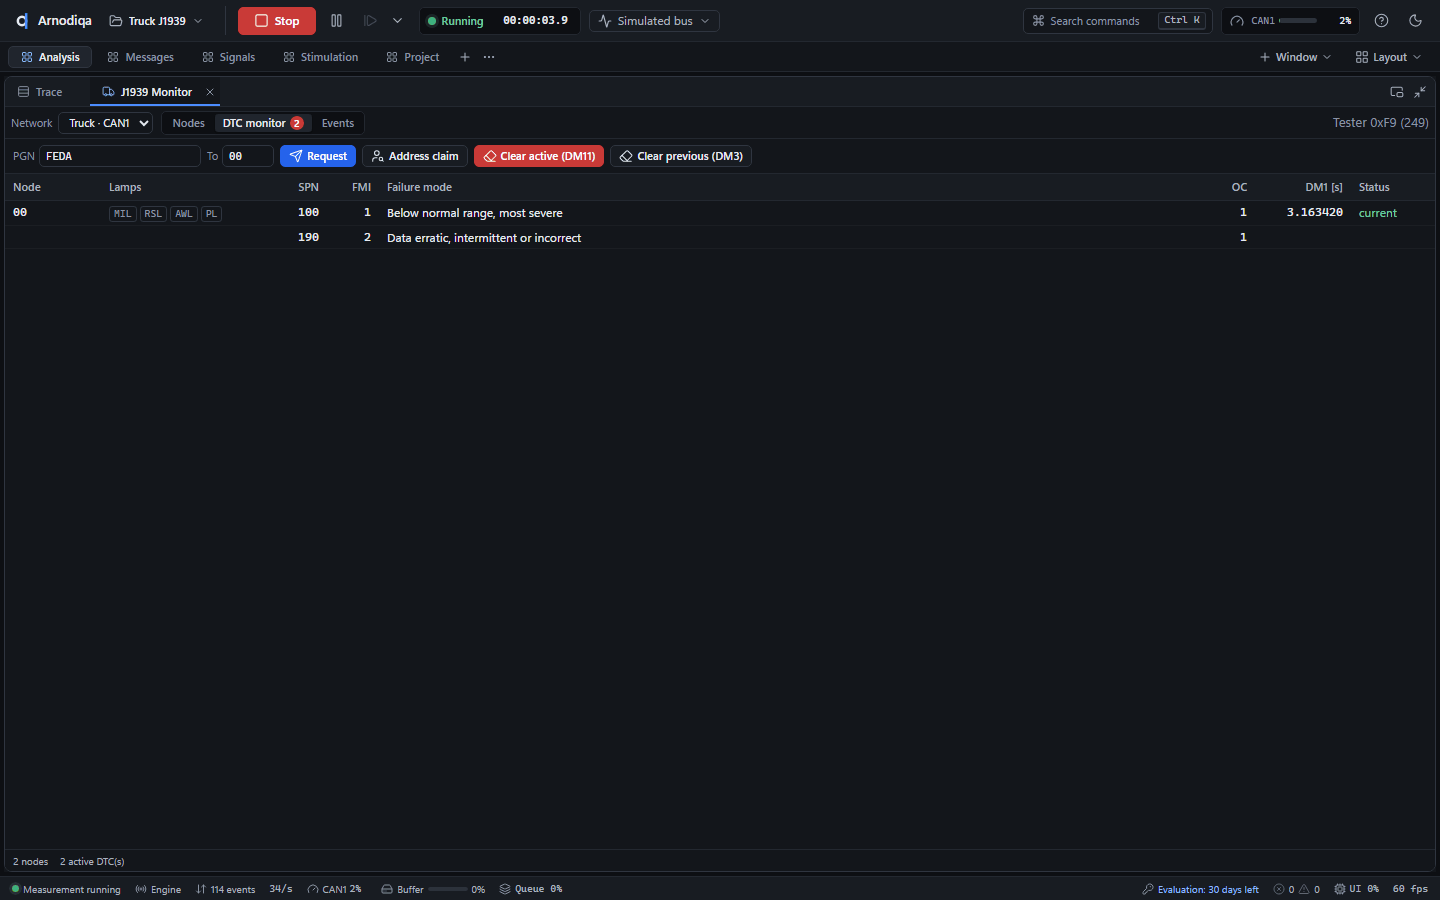
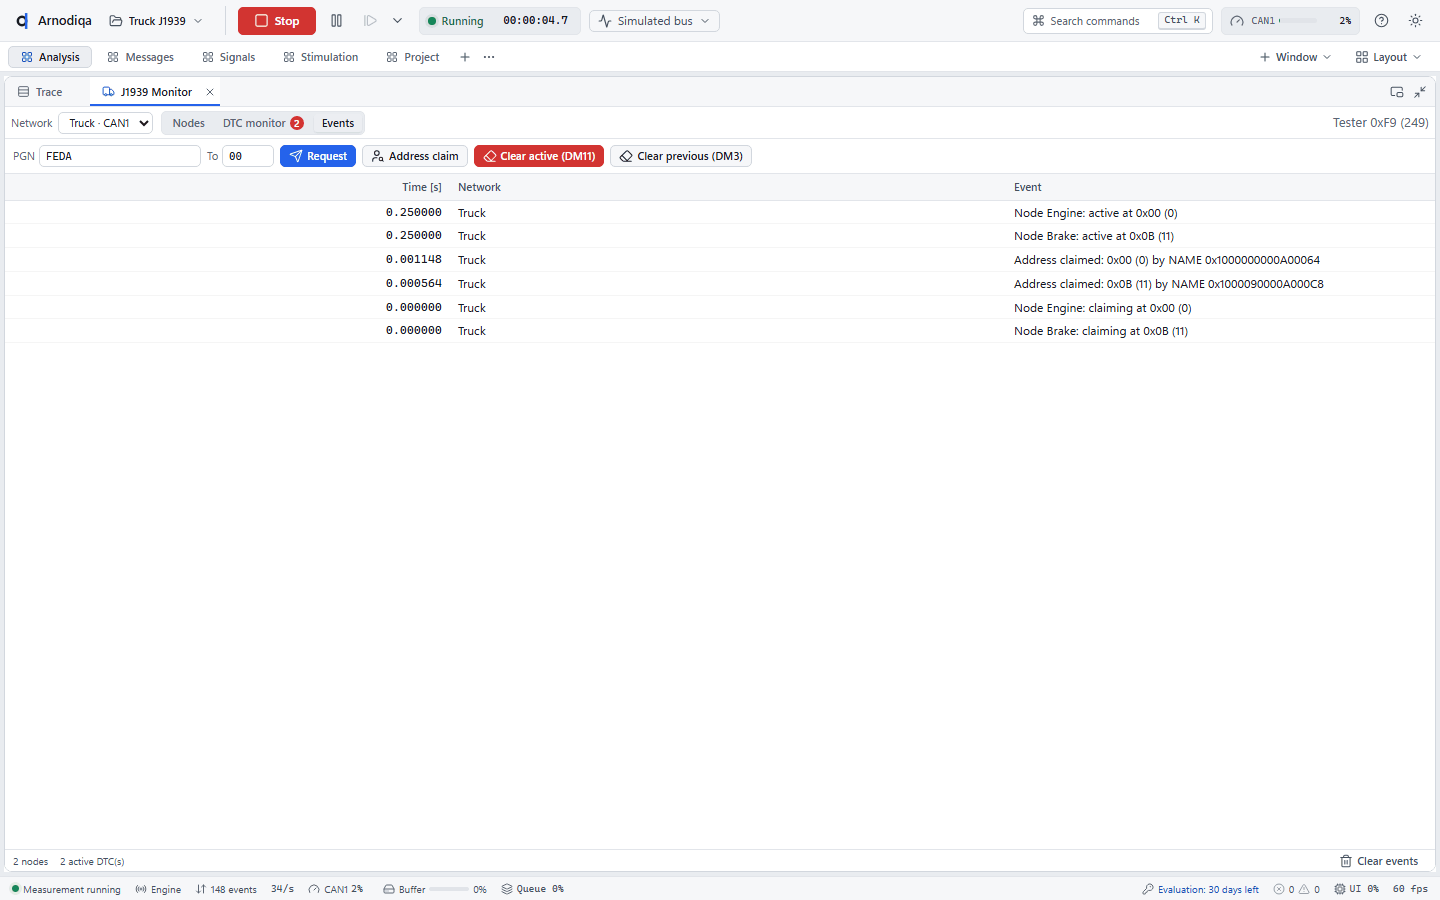
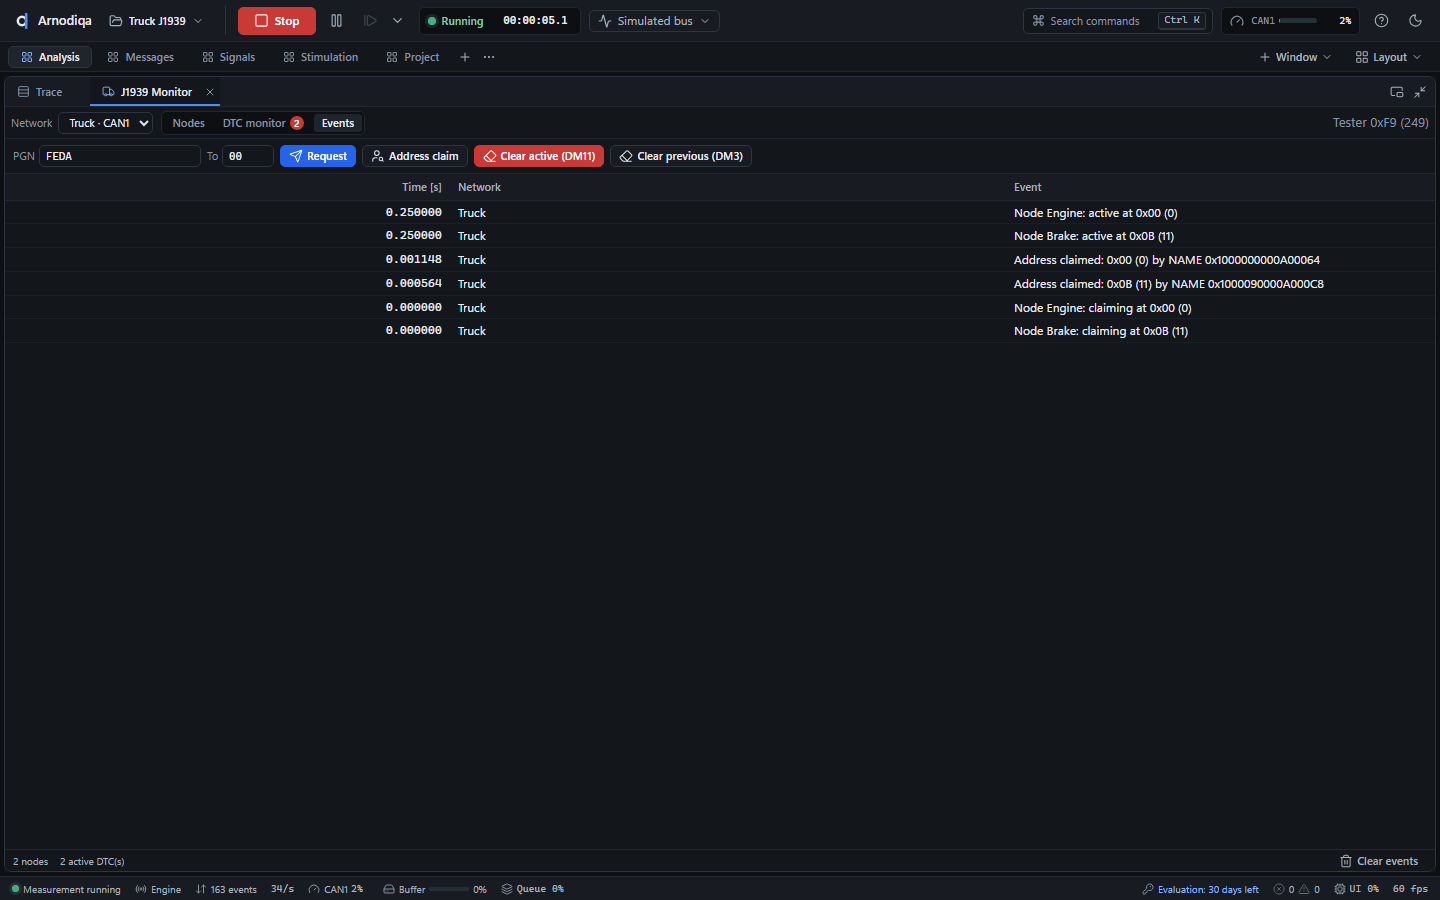
Het tabblad Events toont address claims, verzoeken en antwoorden, ACK/NACK en meldingen van het transportprotocol. Met Request vraag je een PGN op bij een bestemming (hex); Clear active (DM11) en Clear previous (DM3) wissen DTC's.The Events tab shows address claims, requests and responses, ACK/NACK and transport protocol messages. Request requests a PGN from a destination (hex); Clear active (DM11) and Clear previous (DM3) clear DTCs.L'onglet Events affiche les address claims, les requêtes et réponses, ACK/NACK et les messages du protocole de transport. Request demande un PGN à une destination (hexadécimal) ; Clear active (DM11) et Clear previous (DM3) effacent les DTC.
Database-editor: een signaal toevoegenDatabase editor: add a signalÉditeur de bases de données : ajouter un signal
De Database Editor bewerkt DBC- en LDF-bestanden van het project, met undo/redo en controle tijdens het bewerken.The Database Editor edits the project's DBC and LDF files, with undo/redo and checks while editing.Le Database Editor modifie les fichiers DBC et LDF du projet, avec annulation et rétablissement, et contrôle pendant l'édition.
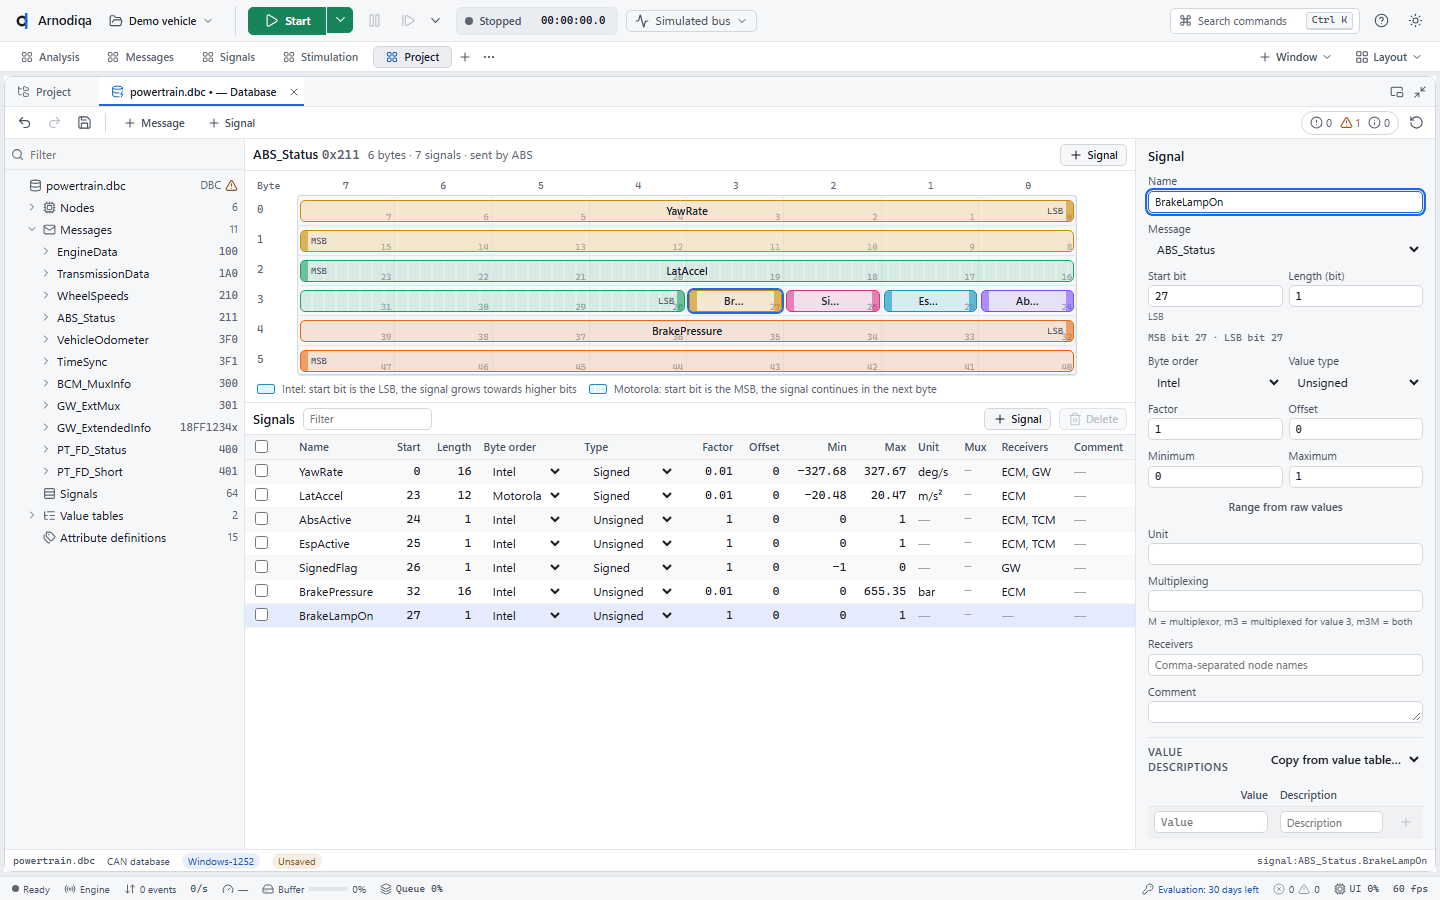
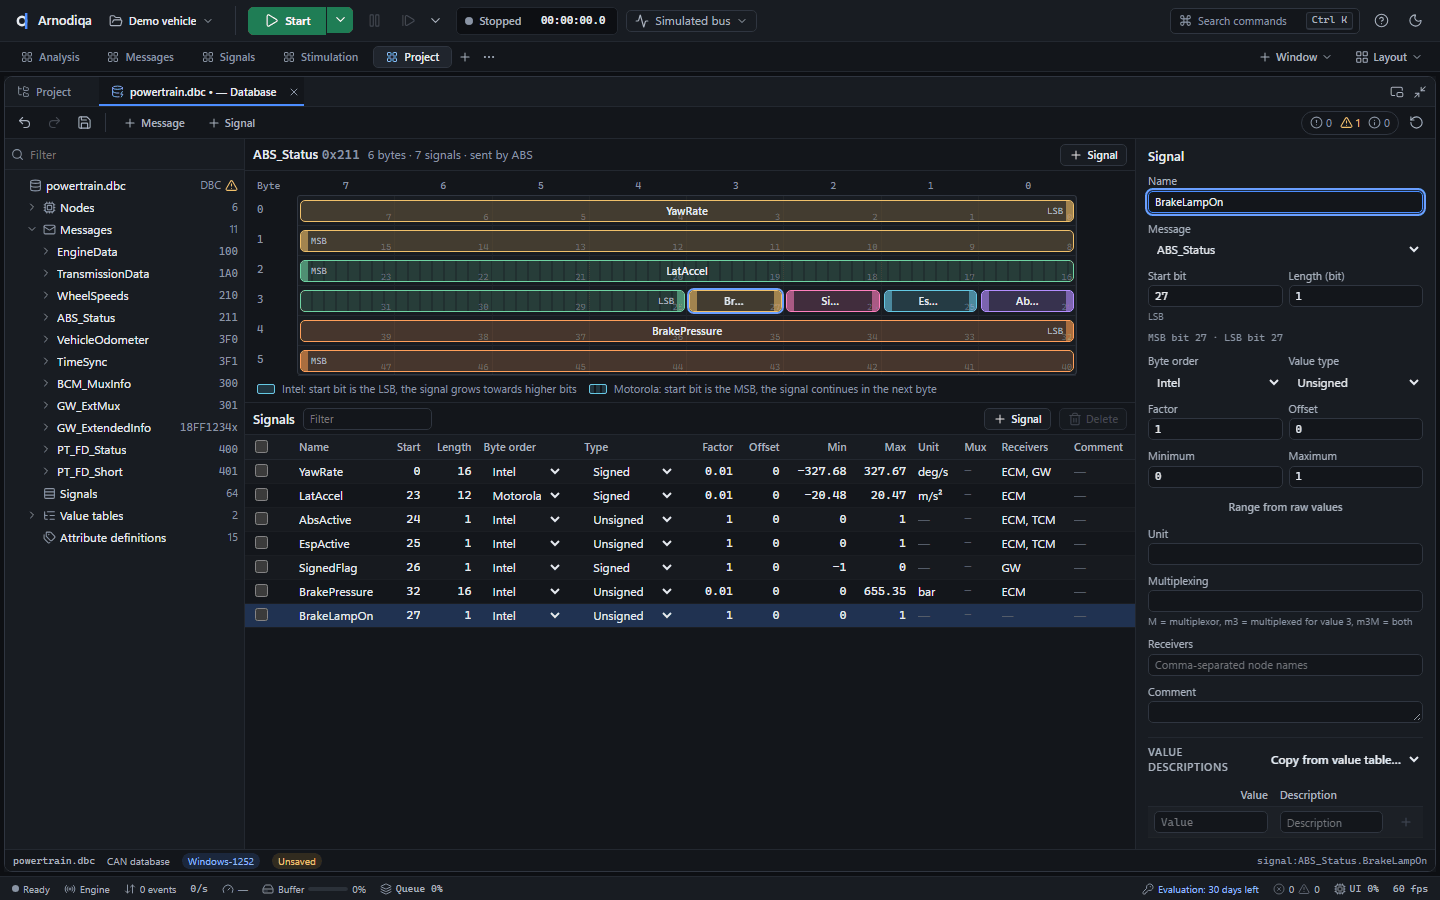
Klik in de projectverkenner op het potlood naast de database (hier powertrain.dbc). De Database Editor toont links de boom (nodes, berichten, signalen, value tables), in het midden de tabel en rechts de eigenschappen.In the project explorer, click the pencil next to the database (here powertrain.dbc). The Database Editor shows the tree on the left (nodes, messages, signals, value tables), the table in the middle and the properties on the right.Dans l'explorateur de projet, cliquez sur le crayon à côté de la base de données (ici powertrain.dbc). Le Database Editor affiche l'arborescence à gauche (nœuds, messages, signaux, value tables), le tableau au centre et les propriétés à droite.
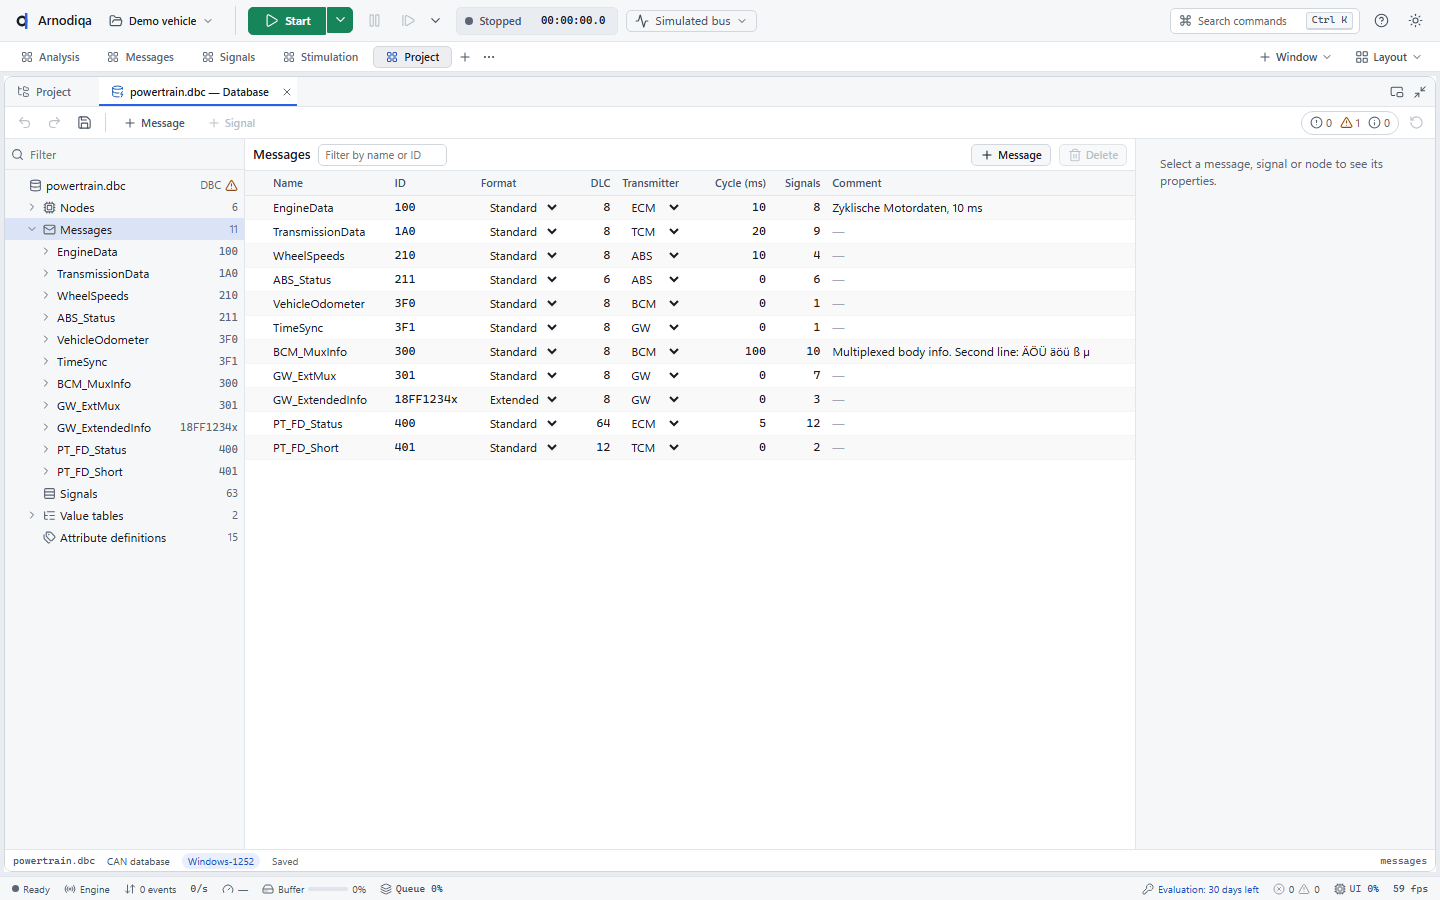
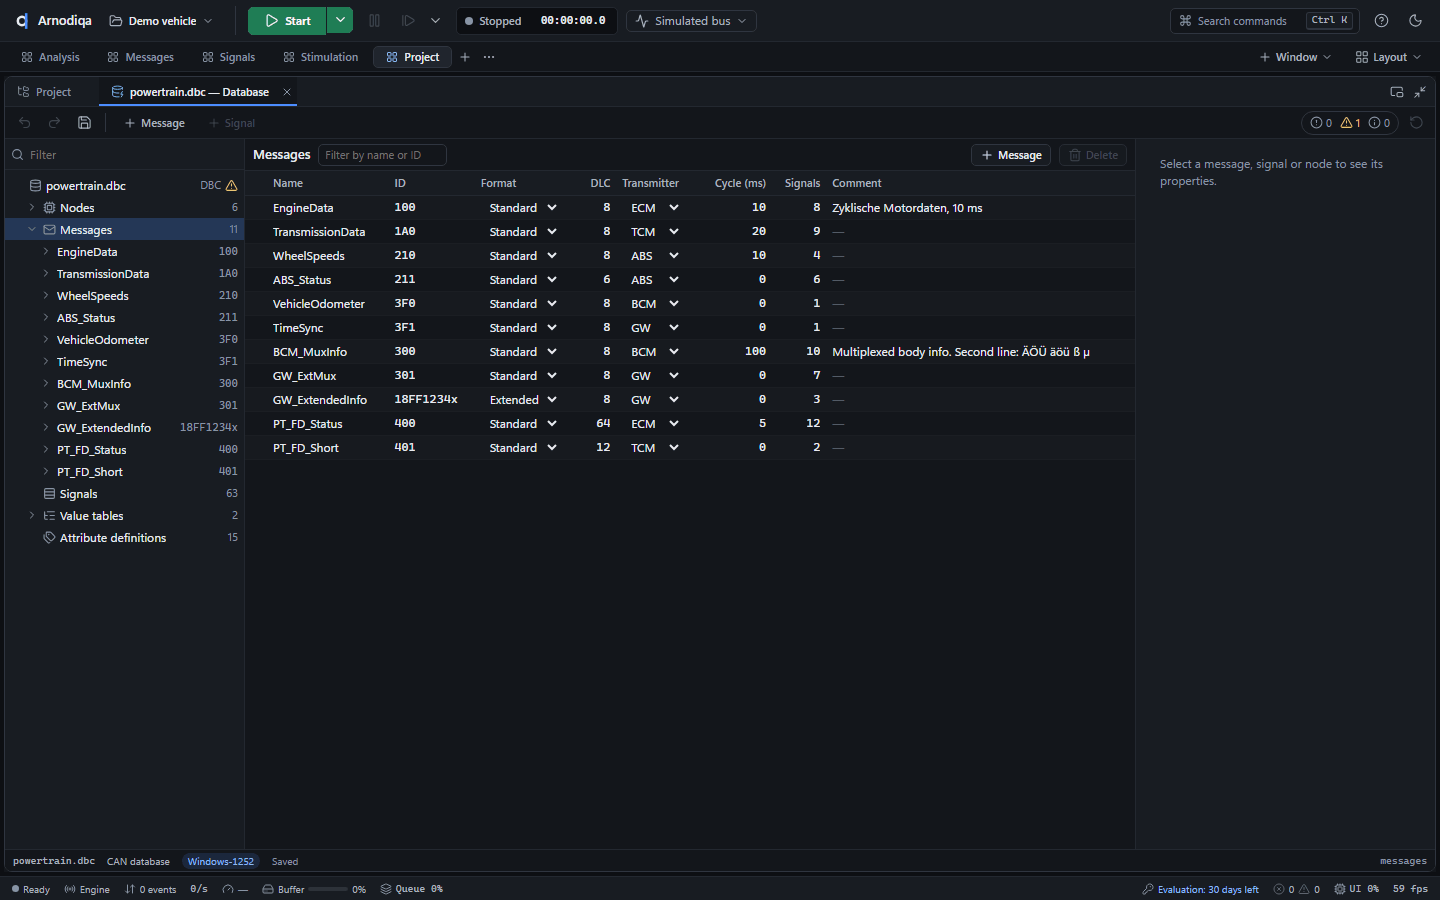
Klik in de boom op een bericht (hier ABS_Status): het midden toont de bitlayout met elk signaal als gekleurde balk, en daaronder de signalen in een tabel.Click a message in the tree (here ABS_Status): the middle shows the bit layout with each signal as a coloured bar, and below it the signals in a table.Cliquez sur un message dans l'arborescence (ici ABS_Status) : le centre affiche la disposition des bits, chaque signal sous forme de barre colorée, et en dessous les signaux dans un tableau.
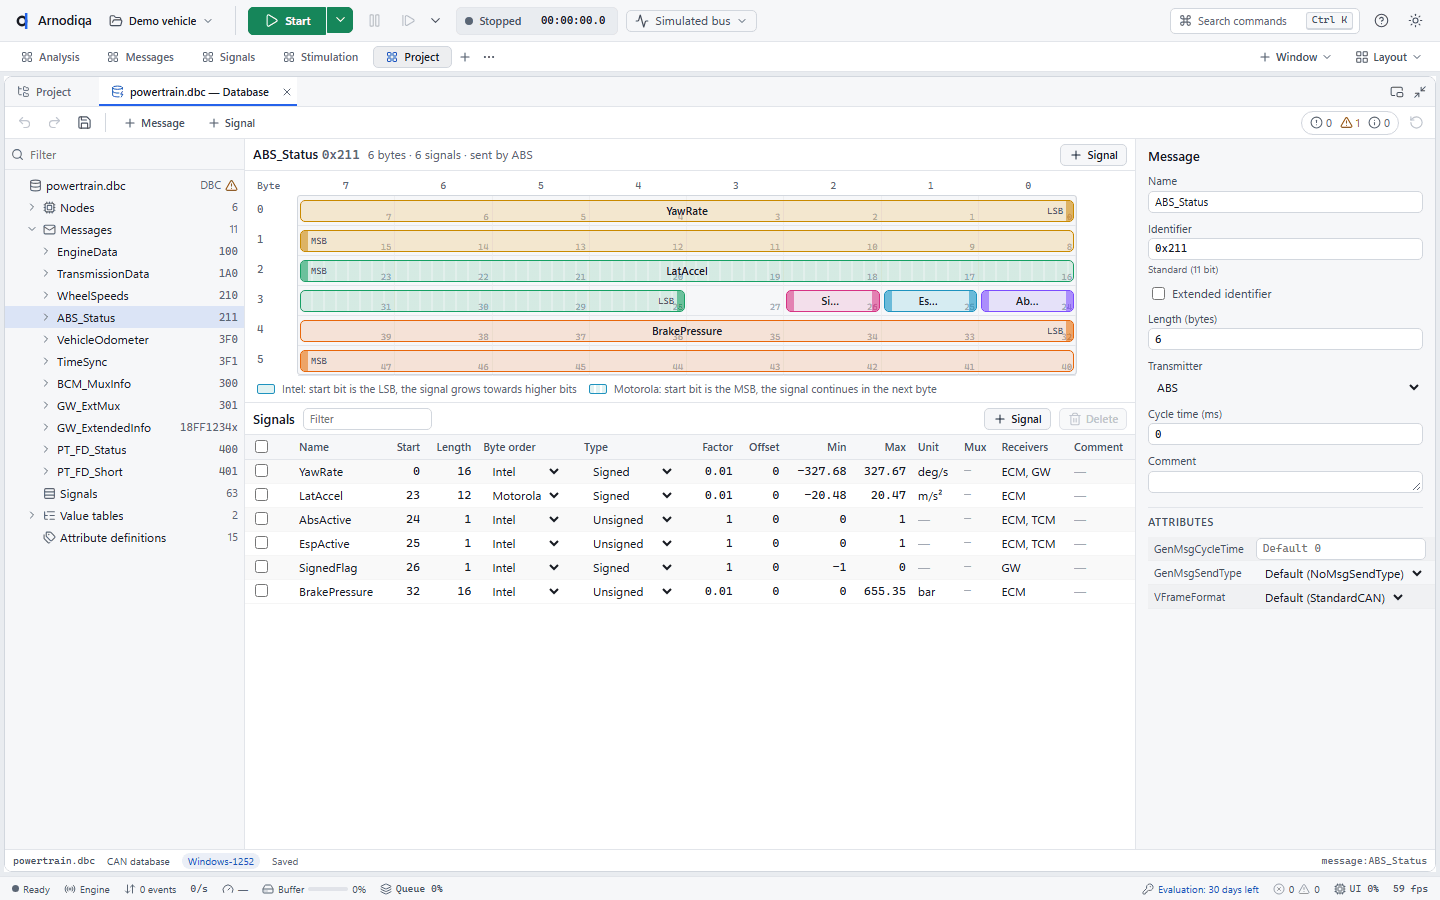
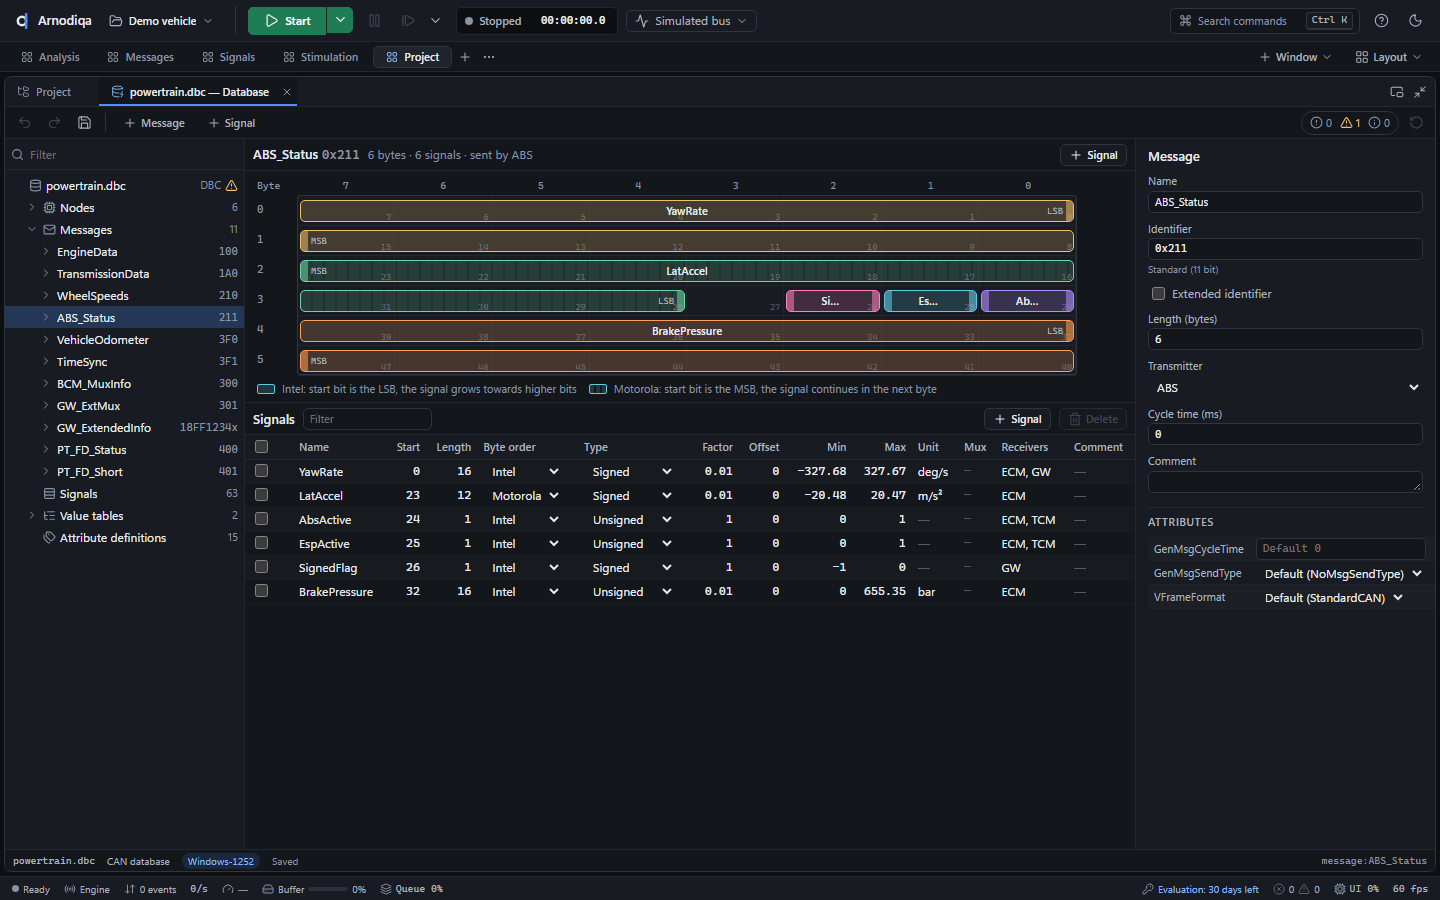
Klik boven de bitlayout op + Signal: het nieuwe signaal (1 bit) komt op de eerste vrije plek, hier bit 27. Geef het rechts onder Signal een naam (hier BrakeLampOn) en zo nodig lengte, byte order, factor, eenheid en ontvangers. Sleep de balk om het signaal te verplaatsen of een uiteinde om de lengte te wijzigen; overlap wordt rood gemarkeerd.Click + Signal above the bit layout: the new signal (1 bit) is placed at the first free position, here bit 27. Name it on the right under Signal (here BrakeLampOn) and set length, byte order, factor, unit and receivers as needed. Drag the bar to move the signal or an end to change its length; overlaps are marked red.Cliquez sur + Signal au-dessus de la disposition des bits : le nouveau signal (1 bit) est placé à la première position libre, ici le bit 27. Nommez-le à droite sous Signal (ici BrakeLampOn) et réglez au besoin la longueur, l'ordre des octets, le facteur, l'unité et les récepteurs. Faites glisser la barre pour déplacer le signal, ou une extrémité pour modifier sa longueur ; les chevauchements sont marqués en rouge.
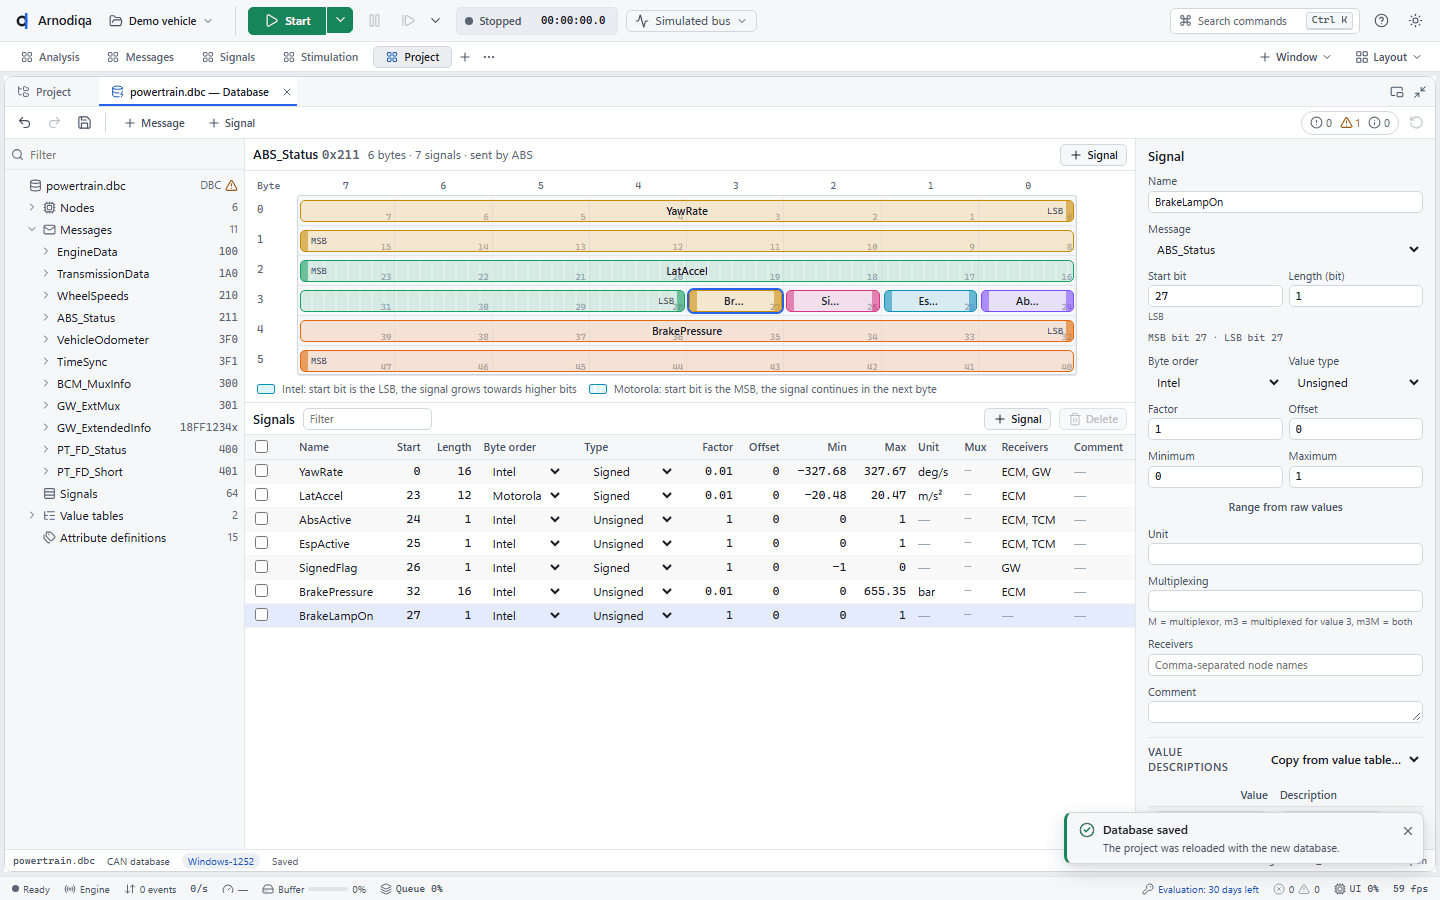
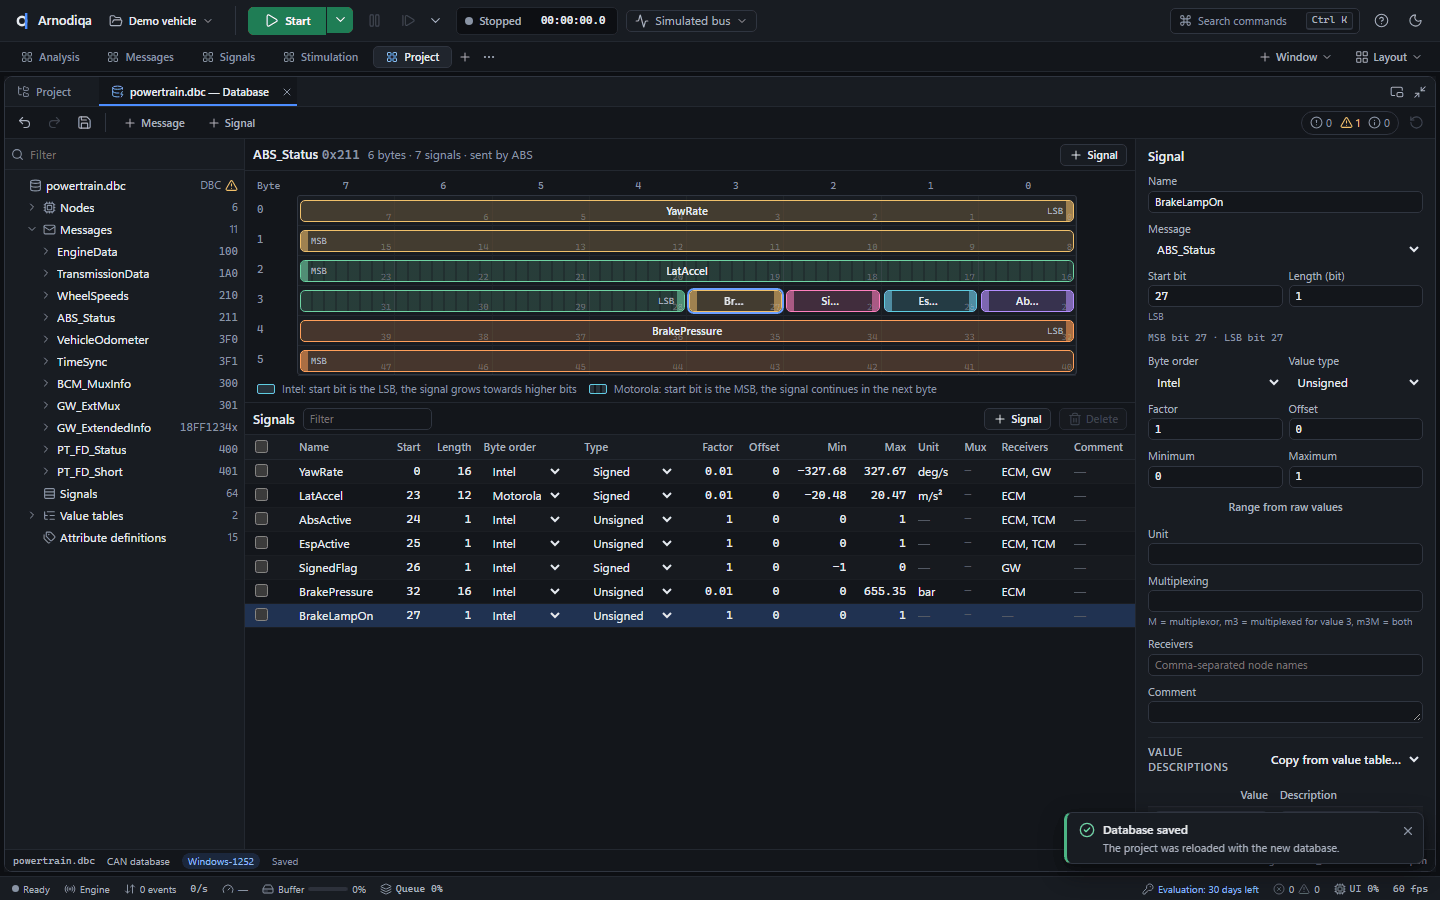
Na het opslaan meldt Arnodiqa Database saved en herlaadt het project met de nieuwe database; de Trace decodeert het nieuwe signaal meteen. Ctrl+Z en Ctrl+Y (of de pijlen linksboven) maken wijzigingen ongedaan of opnieuw.After saving, Arnodiqa reports Database saved and reloads the project with the new database; the Trace decodes the new signal immediately. Ctrl+Z and Ctrl+Y (or the arrows at the top left) undo or redo changes.Après l'enregistrement, Arnodiqa affiche Database saved et recharge le projet avec la nouvelle base de données ; la Trace décode aussitôt le nouveau signal. Ctrl+Z et Ctrl+Y (ou les flèches en haut à gauche) annulent ou rétablissent les modifications.
Hardware-zelftestHardware self-testAutotest du matériel
De zelftest controleert een interface en zijn driver met een kanaalpaar of met één kanaal en interne loopback.The self-test checks an interface and its driver with a channel pair or with one channel and internal loopback.L'autotest vérifie une interface et son pilote avec une paire de canaux, ou avec un seul canal en bouclage interne.
Open het venster Hardware (Ctrl+K, New Hardware window of via de projectverkenner) en klik op Self-test…. Het pictogram bij een kanaal start de test voor alleen dat kanaal.Open the Hardware window (Ctrl+K, New Hardware window or via the project explorer) and click Self-test…. The icon next to a channel starts the test for that channel only.Ouvrez la fenêtre Hardware (Ctrl+K, New Hardware window ou via l'explorateur de projet) et cliquez sur Self-test…. L'icône à côté d'un canal lance le test pour ce seul canal.
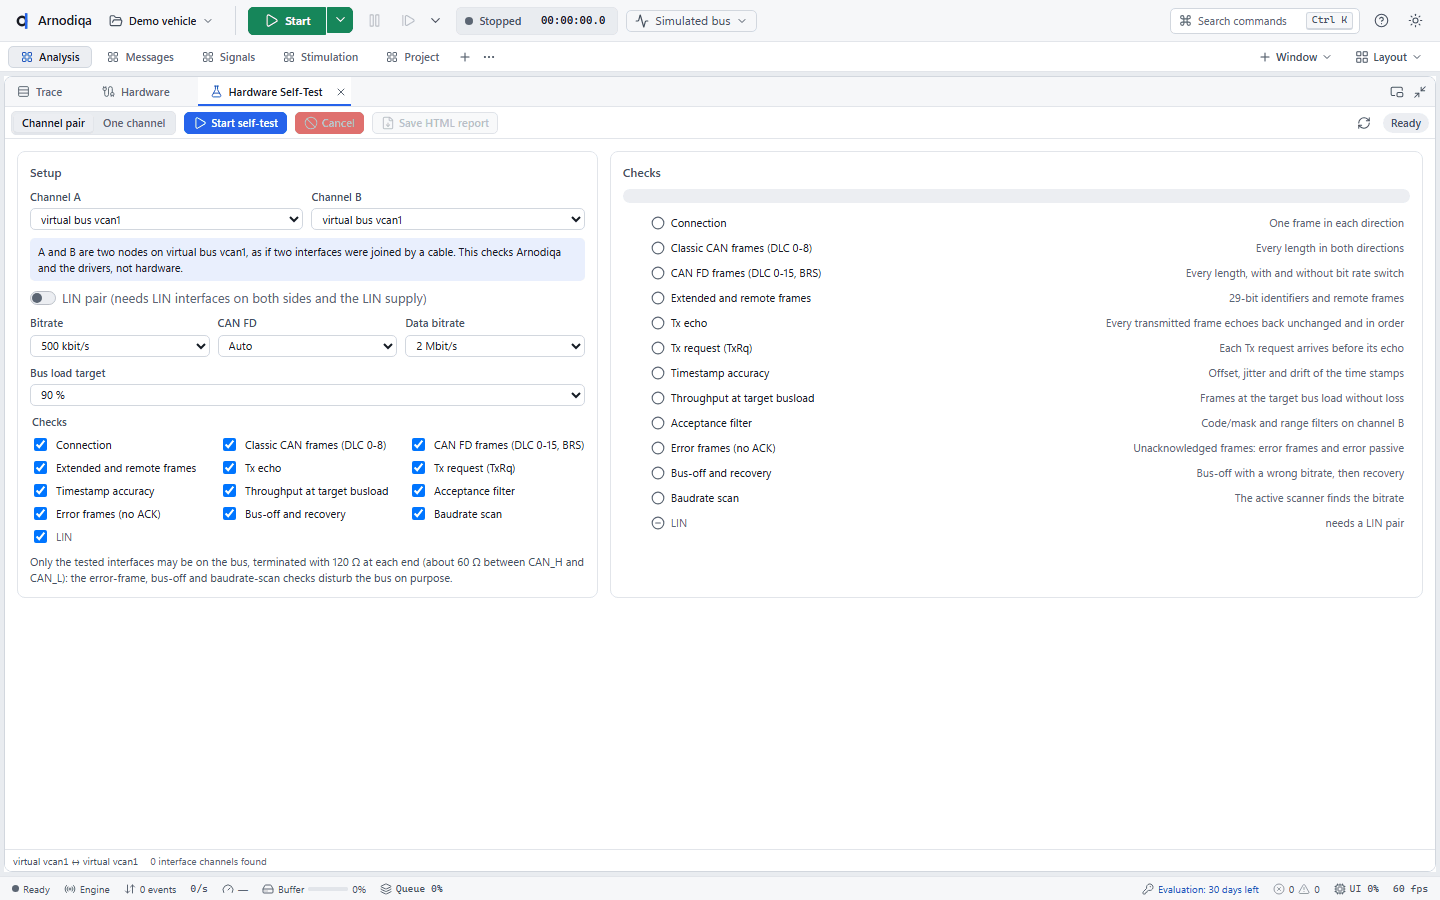
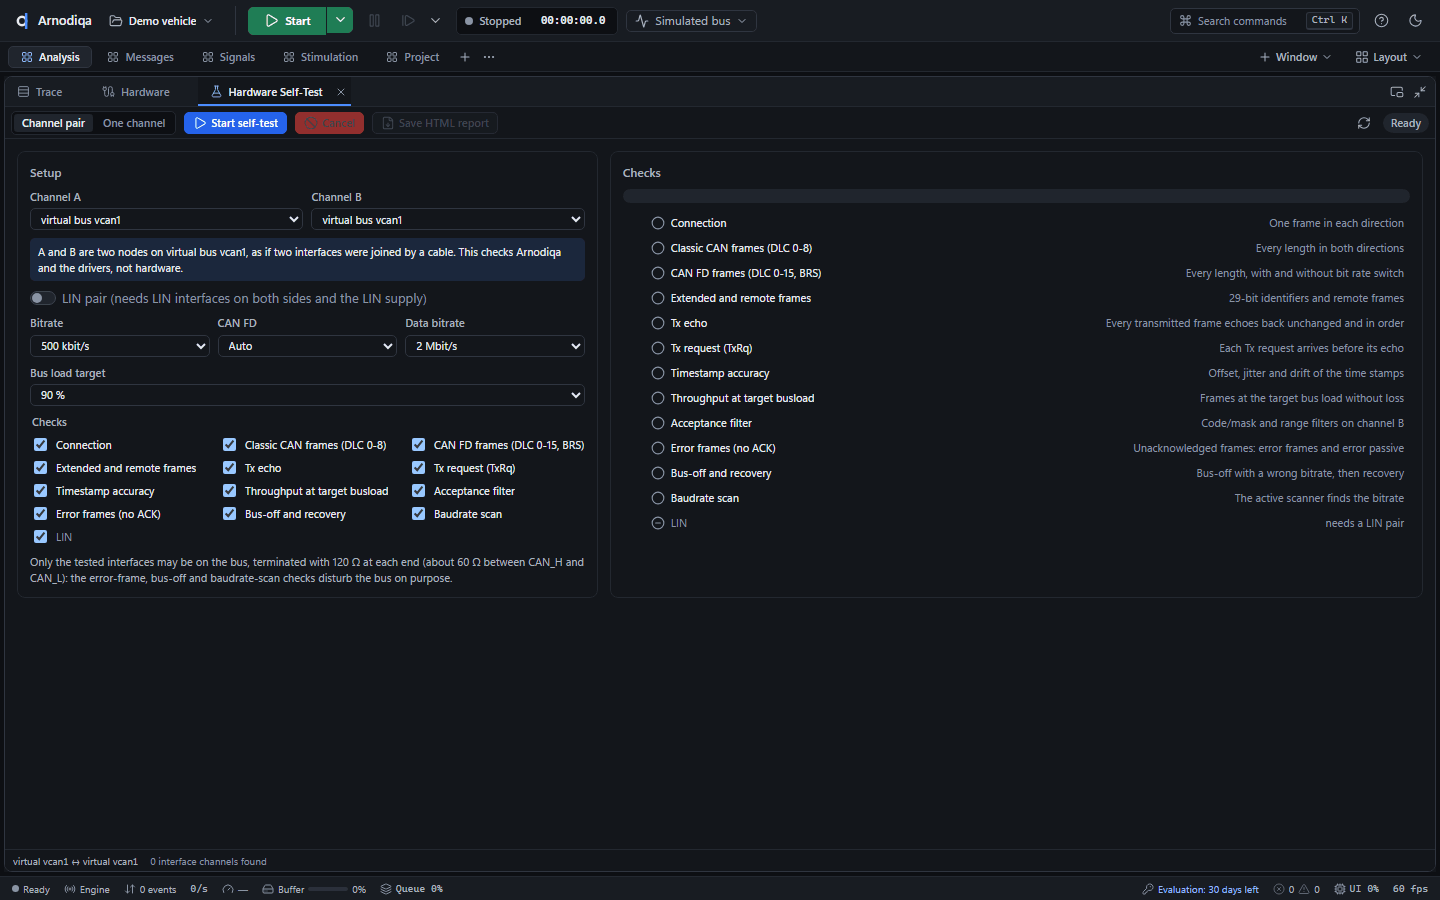
Kies de opstelling: Channel pair (twee kanalen met een kabel verbonden) of One channel, de kanalen A en B, de bitrate, CAN FD en de checks. Zonder hardware test Try on virtual channels op een virtuele bus.Choose the setup: Channel pair (two channels connected by a cable) or One channel, channels A and B, the bit rate, CAN FD and the checks. Without hardware, Try on virtual channels runs the test on a virtual bus.Choisissez la configuration : Channel pair (deux canaux reliés par un câble) ou One channel, les canaux A et B, le débit, CAN FD et les contrôles. Sans matériel, Try on virtual channels exécute le test sur un bus virtuel.
Klik op Start self-test (Ctrl+Enter). Per check zie je de status en de duur.Click Start self-test (Ctrl+Enter). Each check shows its status and duration.Cliquez sur Start self-test (Ctrl+Entrée). Chaque contrôle affiche son état et sa durée.
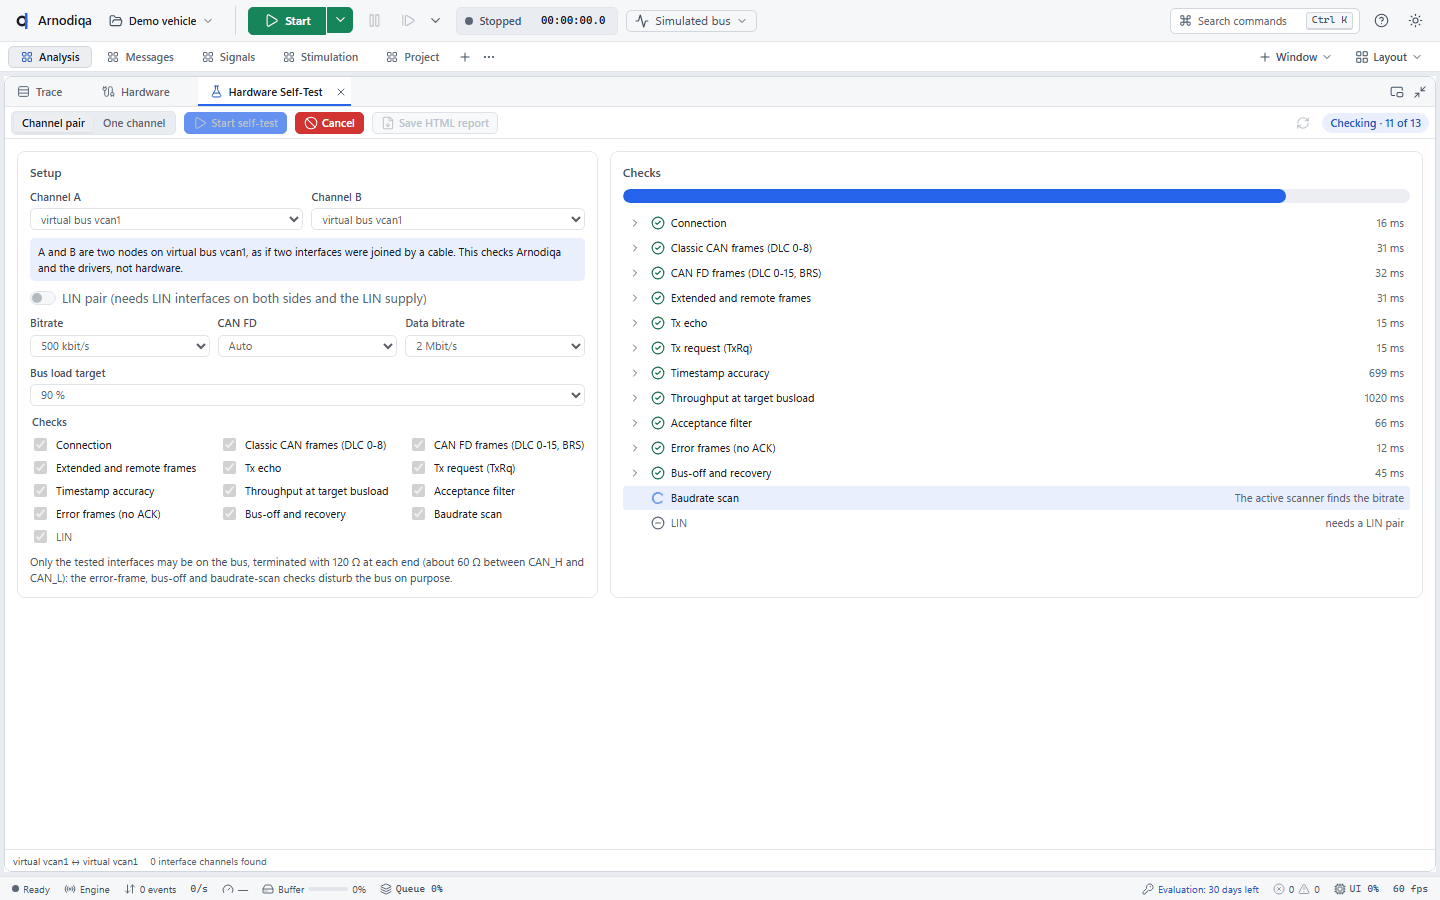
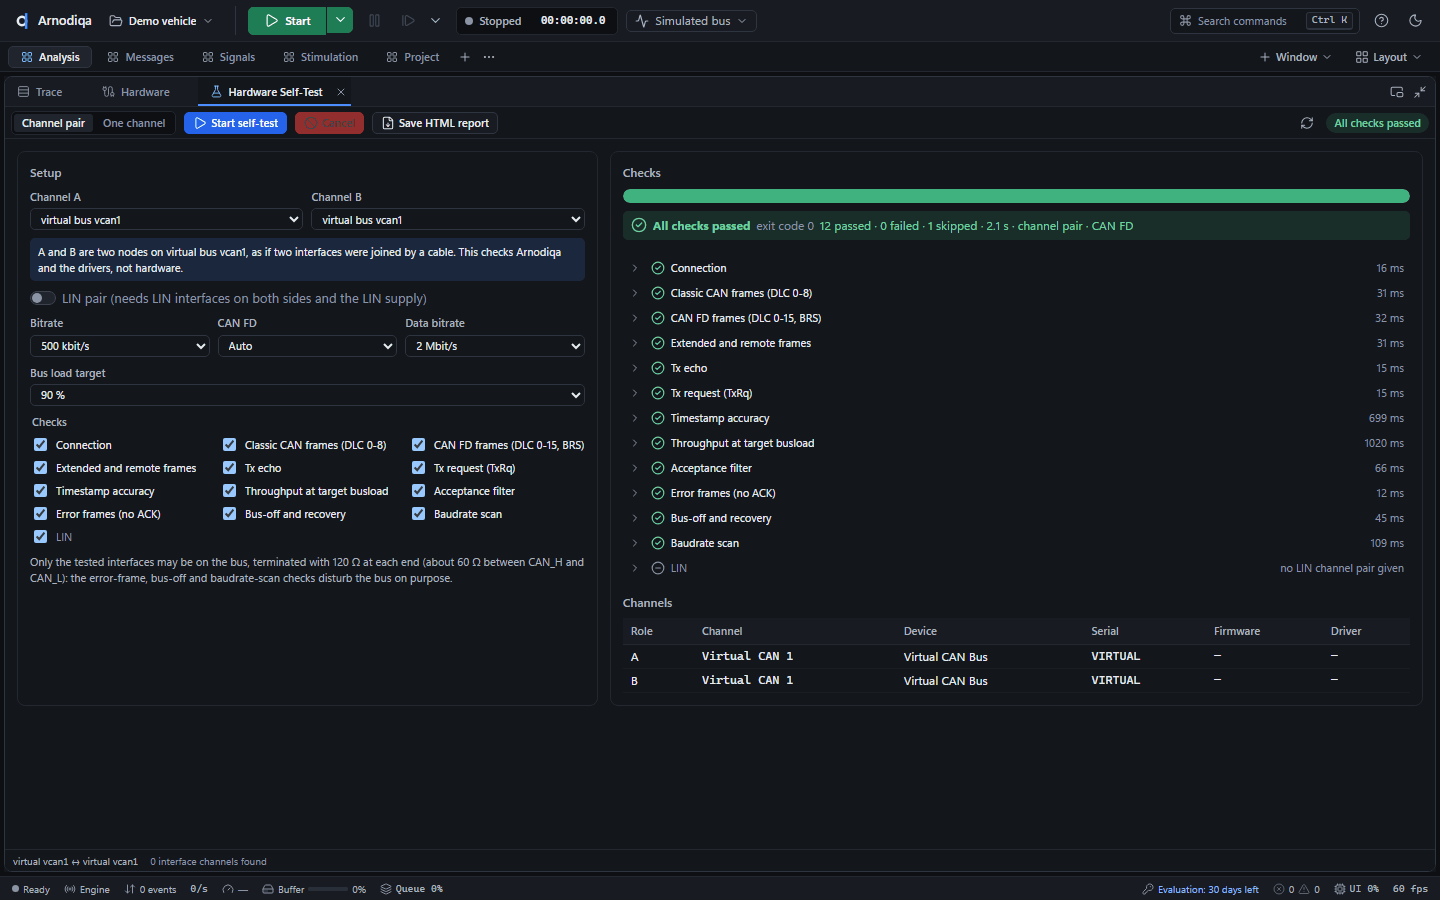
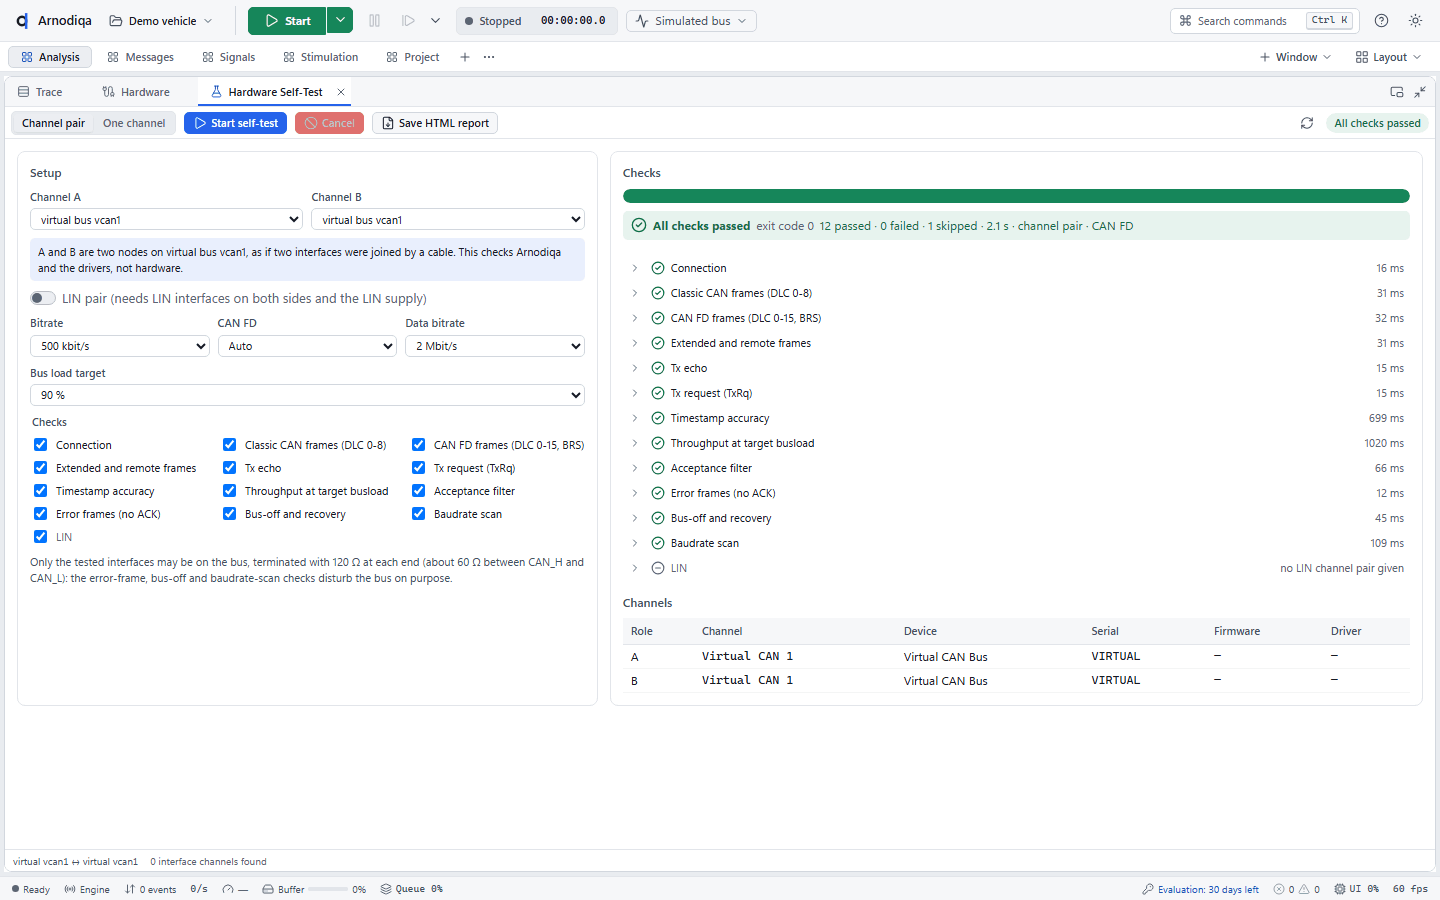
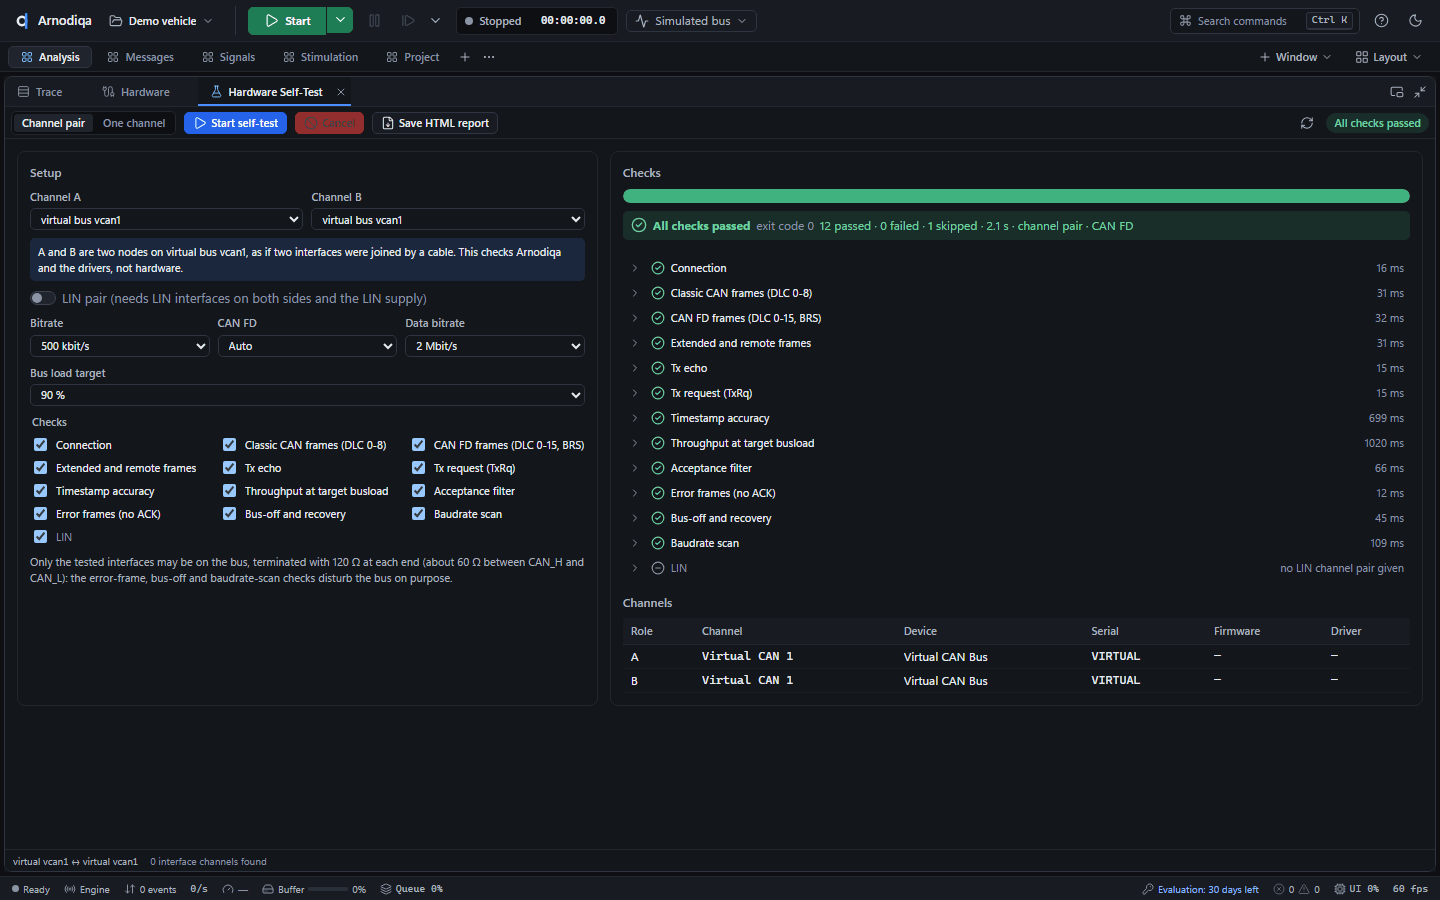
Daarna volgt de samenvatting met de kanalen (toestel, serienummer, firmware, driver). Klap een check open voor meetwaarden en bij een fout de waarschijnlijke oorzaak. Save HTML report bewaart het rapport.The summary follows, with the channels (device, serial number, firmware, driver). Expand a check for measured values and, on a failure, the likely cause. Save HTML report saves the report.Le résumé suit, avec les canaux (appareil, numéro de série, firmware, pilote). Dépliez un contrôle pour voir les valeurs mesurées et, en cas d'échec, la cause probable. Save HTML report enregistre le rapport.
Supportbundel en logmapSupport bundle and log folderArchive de support et dossier des journaux
Logs en crashrapporten blijven op de computer. Een supportbundel maak je zelf; stuur hem via je eigen kanaal door naar support@arnodiqa.com.Logs and crash reports stay on the computer. You create a support bundle yourself and send it through your own channel to support@arnodiqa.com.Les journaux et les rapports de plantage restent sur l'ordinateur. Vous créez vous-même une archive de support et la transmettez par votre propre canal à support@arnodiqa.com.
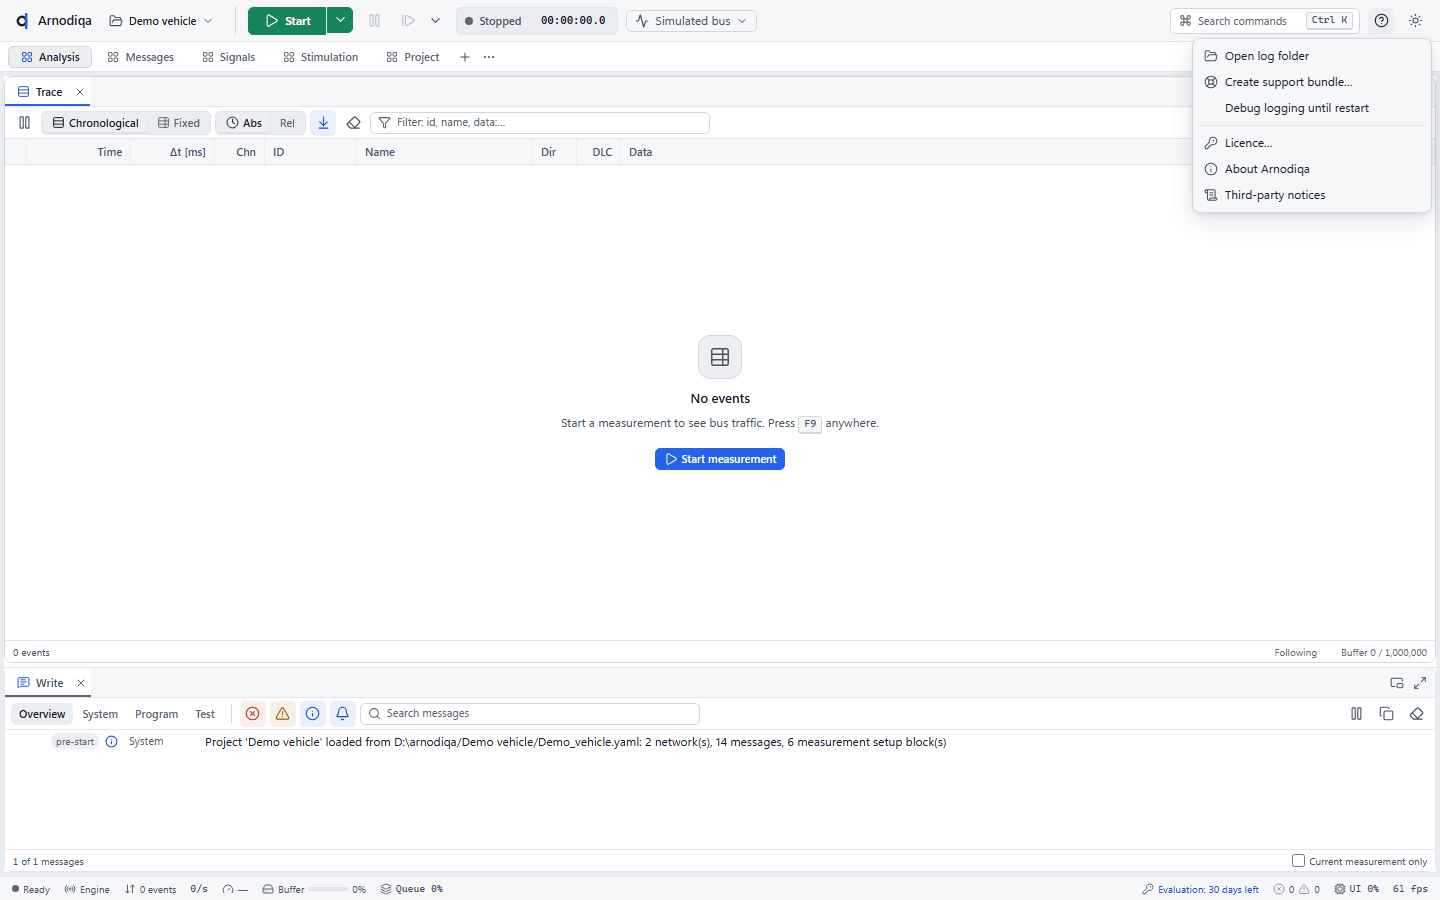
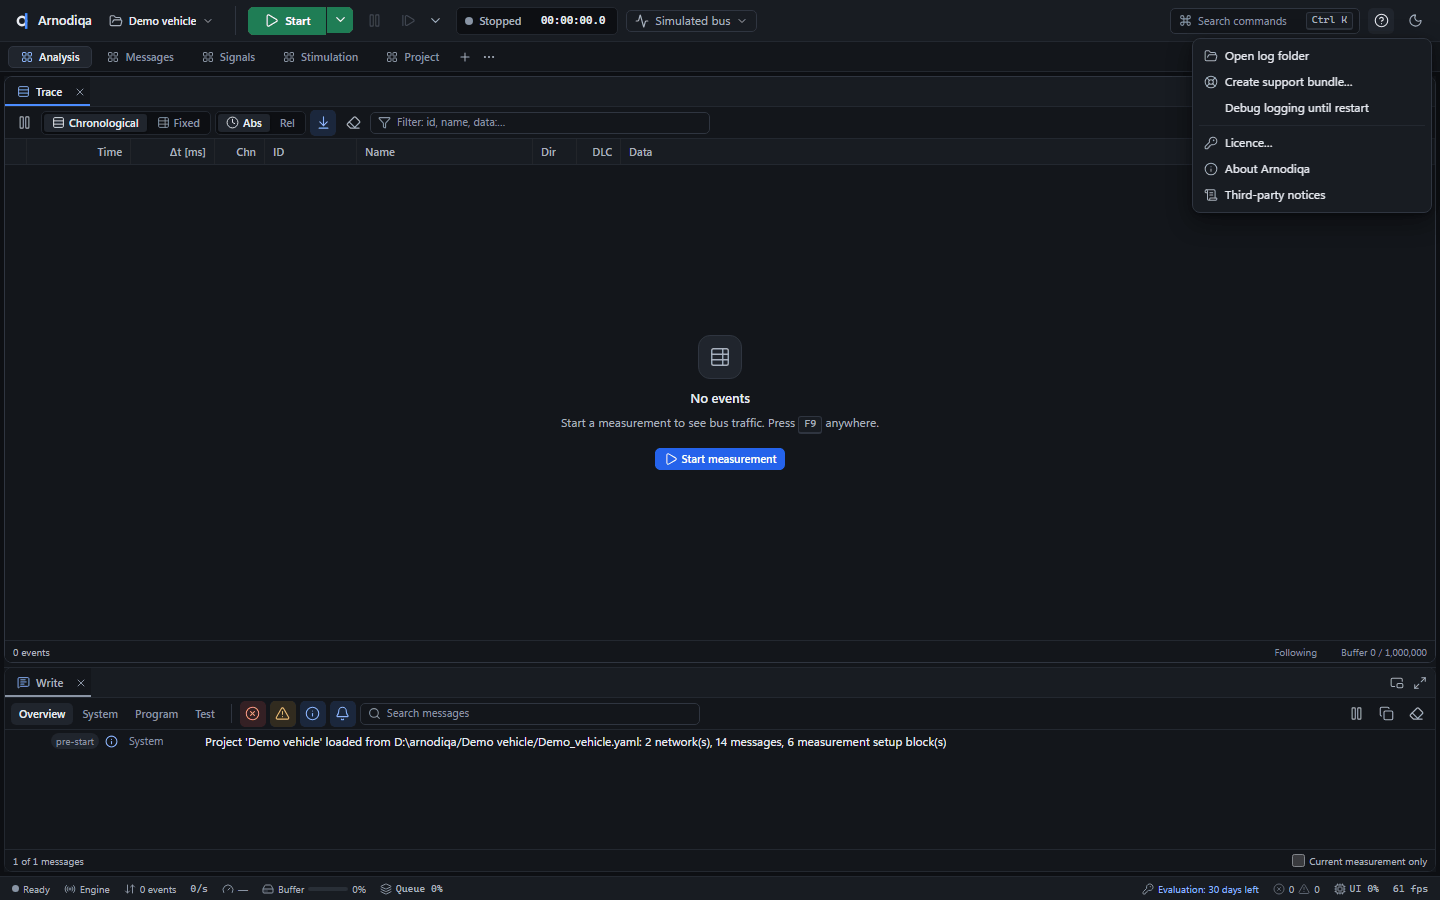
Klik rechtsboven op het vraagteken (Help). Het menu bevat Open log folder, Create support bundle…, Debug logging until restart en About Arnodiqa. Dezelfde acties staan in Ctrl+K onder Help.Click the question mark (Help) at the top right. The menu contains Open log folder, Create support bundle…, Debug logging until restart and About Arnodiqa. The same actions are available in Ctrl+K under Help.Cliquez sur le point d'interrogation (Help) en haut à droite. Le menu contient Open log folder, Create support bundle…, Debug logging until restart et About Arnodiqa. Les mêmes actions figurent dans Ctrl+K sous Help.
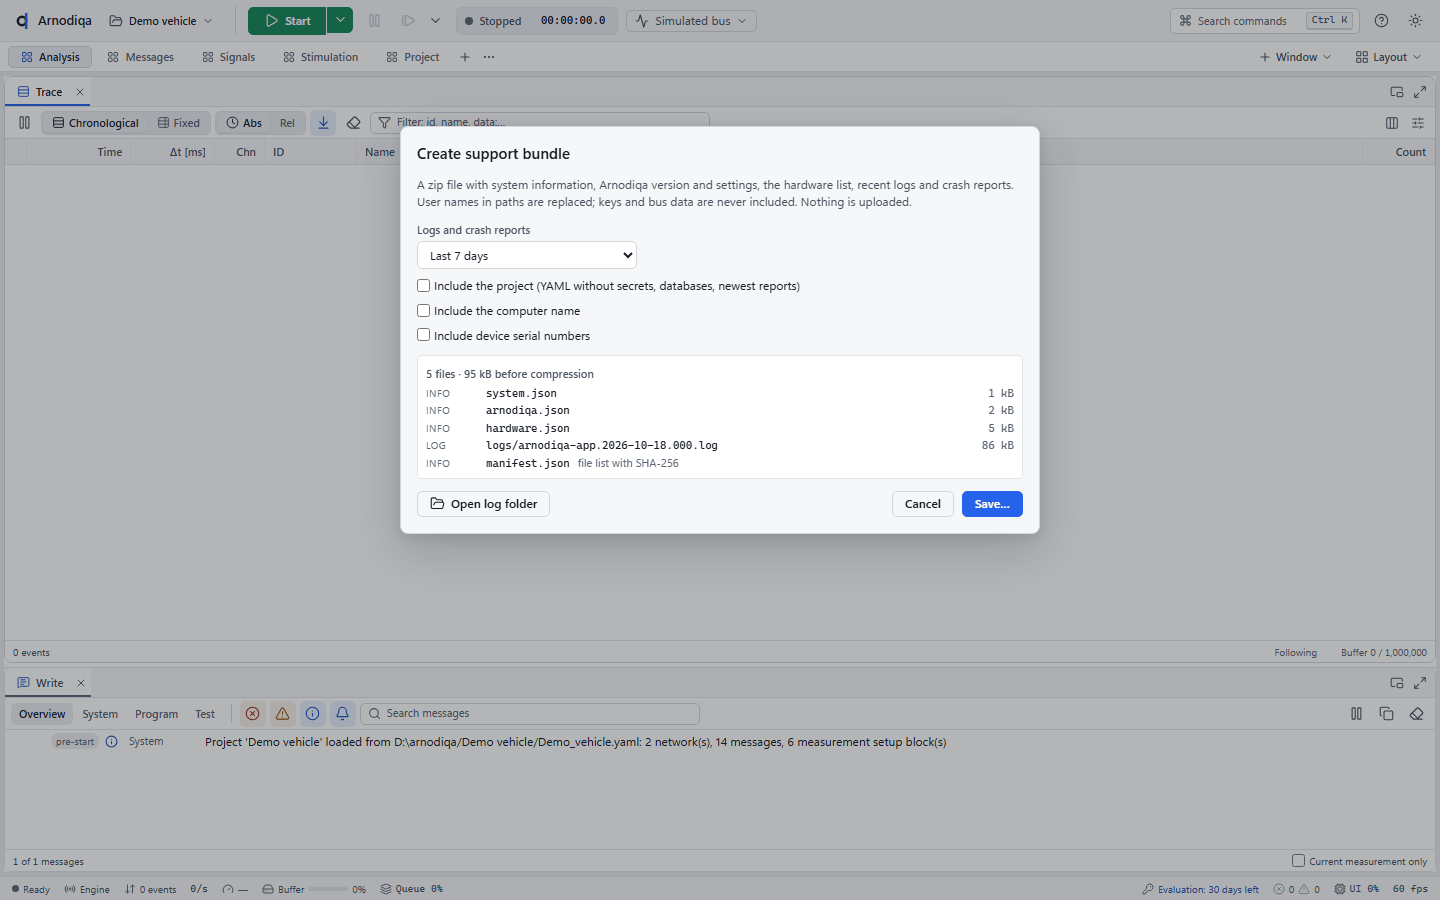
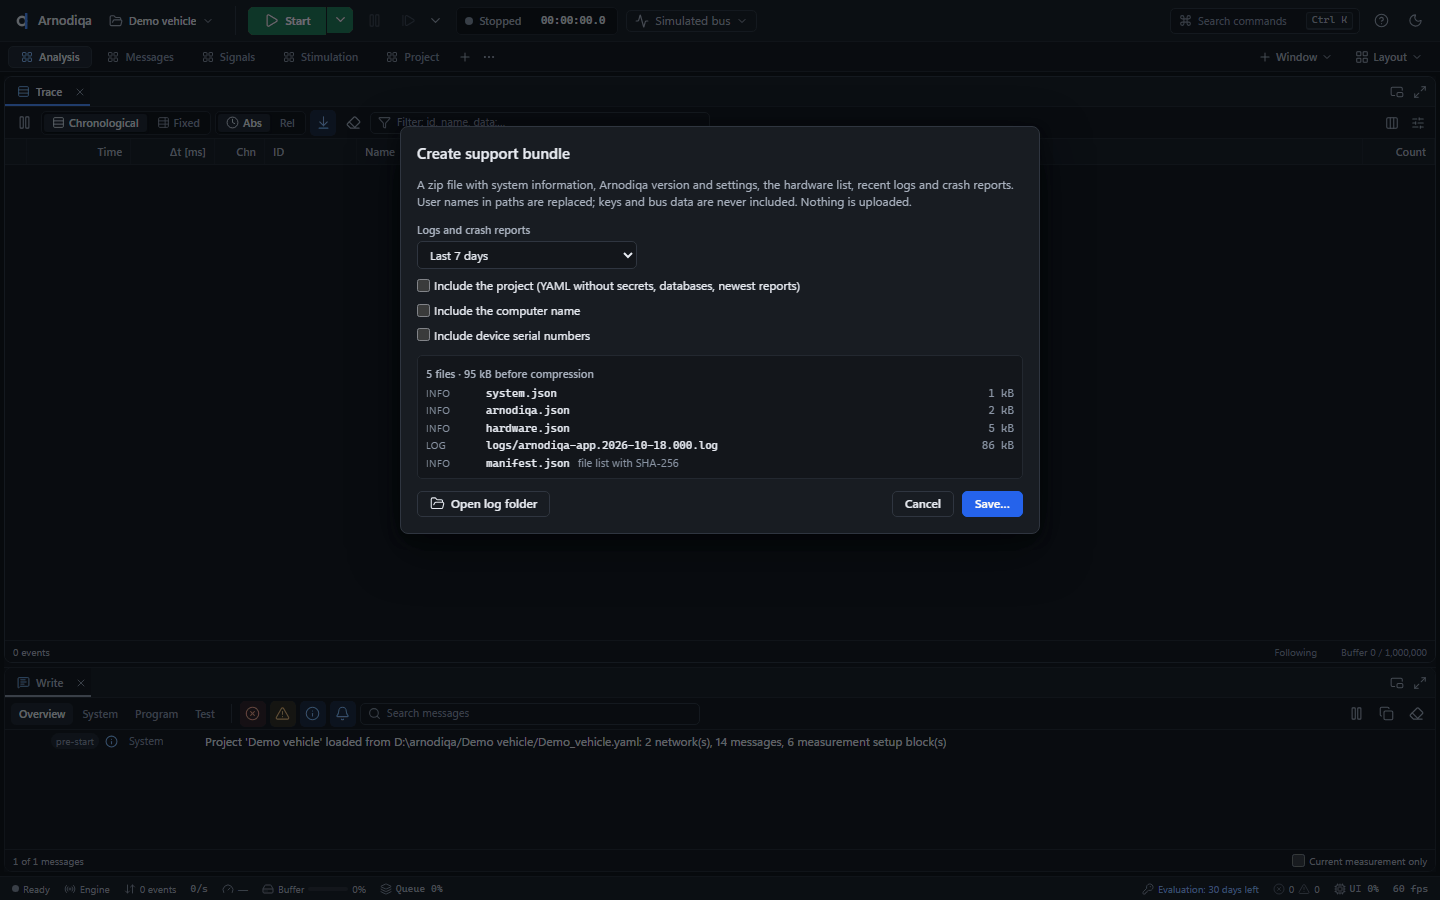
Create support bundle… toont vooraf welke bestanden in het zip-bestand komen en wat bewust wordt weggelaten. Kies de periode van de logs en of het project, de computernaam of serienummers mee mogen. Klik op Save… en kies waar het zip-bestand komt; er wordt niets verstuurd.Create support bundle… shows in advance which files go into the zip file and what is deliberately left out. Choose the period of the logs and whether the project, the computer name or serial numbers may be included. Click Save… and choose where the zip file goes; nothing is sent.Create support bundle… indique d'avance les fichiers placés dans l'archive zip et ce qui est délibérément omis. Choisissez la période couverte par les journaux et indiquez si le projet, le nom de l'ordinateur ou les numéros de série peuvent être inclus. Cliquez sur Save… et choisissez l'emplacement du fichier zip ; rien n'est envoyé.
Open log folder opent de map met de logbestanden van Arnodiqa in Verkenner; een melding toont het pad.Open log folder opens the folder with the Arnodiqa log files in Explorer; a notification shows the path.Open log folder ouvre dans l'Explorateur le dossier des fichiers journaux d'Arnodiqa ; une notification indique le chemin.
FAQ
Kan ik het met echte hardware gebruiken?Can I use it with real hardware?Puis-je l'utiliser avec du matériel réel ?
arnodiqa hw list en het venster Hardware tonen wat gevonden is. Arnodiqa gebruikt de officiële driver van de fabrikant; met de Hardware Self-Test controleer je een interface in de eigen opstelling. Zie hw list.Yes. There are backends for PEAK PCAN-Basic, Vector XL, Kvaser CANlib, SLCAN and candleLight/gs_usb; arnodiqa hw list and the Hardware window show what was found. Arnodiqa uses the manufacturer's official driver; use the Hardware Self-Test to check an interface in your own setup. See hw list.Oui. Des backends existent pour PEAK PCAN-Basic, Vector XL, Kvaser CANlib, SLCAN et candleLight/gs_usb ; arnodiqa hw list et la fenêtre Hardware indiquent ce qui a été détecté. Arnodiqa utilise le pilote officiel du fabricant ; le Hardware Self-Test permet de vérifier une interface dans votre propre configuration. Voir hw list.Kan ik een restbus simuleren?Can I simulate a rest bus?Puis-je simuler un bus résiduel ?
simulation.restbus wordt elke node uit de DBC een Interaction Layer-node met de send types, cyclustijden, start- en inactieve waarden uit de database. Sluit de te testen ECU uit met exclude. Zie Projectformaat.Yes. Under simulation.restbus every DBC node becomes an interaction layer node with the send types, cycle times, start and inactive values from the database. Exclude the ECU under test with exclude. See Project format.Oui. Sous simulation.restbus, chaque nœud du DBC devient un nœud de couche d'interaction, avec les types d'envoi, les temps de cycle et les valeurs initiales et inactives de la base de données. Excluez le calculateur testé avec exclude. Voir Format de projet.Draait mijn bestaande CAPL-code?Will my existing CAPL code run?Mon code CAPL existant fonctionnera-t-il ?
arnodiqa capl check. De taal is geïmplementeerd op basis van eigen specificaties.The script VM runs existing CAPL programs as simulation nodes or test modules, including functions for the interaction layer, diagnostics, logging, files and INI profiles. Check a program beforehand with arnodiqa capl check. The language is implemented from our own specifications.La VM de script exécute les programmes CAPL existants comme nœuds de simulation ou comme modules de test, y compris les fonctions de couche d'interaction, de diagnostic, de journalisation, de fichiers et de profils INI. Vérifiez un programme au préalable avec arnodiqa capl check. Le langage est implémenté à partir de nos propres spécifications.Kan ik tests in CI draaien?Can I run tests in CI?Puis-je exécuter des tests en CI ?
arnodiqa test voert de test units van een project uit in de gesimuleerde bus, schrijft rapporten in HTML, JSON en JUnit XML en geeft een exitcode volgens het verdict.Yes. arnodiqa test runs the test units of a project on the simulated bus, writes reports as HTML, JSON and JUnit XML and returns an exit code based on the verdict.Oui. arnodiqa test exécute les unités de test d'un projet sur le bus simulé, écrit des rapports en HTML, JSON et JUnit XML et renvoie un code de sortie conforme au verdict.Zijn de BLF-bestanden uitwisselbaar met CANoe/CANalyzer?Are BLF files interchangeable with CANoe/CANalyzer?Les fichiers BLF sont-ils interchangeables avec CANoe/CANalyzer ?
Welke platformen?Which platforms?Quelles plateformes ?
Werkt het zonder internet (air-gapped)?Does it work without internet (air-gapped)?Fonctionne-t-il sans Internet (environnements isolés) ?
Heb ik een dongle of licentieserver nodig?Do I need a dongle or licence server?Ai-je besoin d'un dongle ou d'un serveur de licences ?
*.bflic) dat Arnodiqa lokaal controleert: geen hardwaresleutel, geen activatie, geen phone-home. Machinegebonden, site- en volumelicenties zijn beschikbaar. Zonder licentie werkt Arnodiqa 30 dagen met alle functies, daarna blijven bekijken, offline afspelen, converteren en exporteren beschikbaar. Zie arnodiqa license en Prijzen.No. The licence is a signed file (*.bflic) that Arnodiqa checks locally: no hardware key, no activation, no phone-home. Node-locked, site and volume licences are available. Without a licence Arnodiqa works for 30 days with all features, after which viewing, offline replay, conversion and export remain available. See arnodiqa license and Pricing.Non. La licence est un fichier signé (*.bflic) qu'Arnodiqa vérifie localement : pas de clé matérielle, pas d'activation, aucune connexion sortante. Des licences liées à un poste, des licences site et des licences en volume sont disponibles. Sans licence, Arnodiqa fonctionne 30 jours avec toutes les fonctions ; ensuite, la consultation, la relecture hors ligne, la conversion et l'export restent disponibles. Voir arnodiqa license et Tarifs.